Topics / #dashboards
Dashboards projects on GitHub
Dashboard templates and frameworks for visualizing metrics and admin data.
As of , the most-starred Dashboards projects on GitHub are grafana (77.3K stars), AdminLTE (45.7K stars) and tabler (41.9K stars). GitHub.Locker tracks 12 Dashboards repositories with 341.6K stars combined. The fastest-growing on October 17 was grafana, with +21 stars in a day.
Hot right now
Most stars gained in a day · Oct 17
 +21
grafana
grafana/grafana · ★ 77.3KGrafana is an open-source platform for monitoring and observability: it lets you query, visualize, alert on, and explore metrics, logs, and traces from many data sources in one place.
 +8
tabler
tabler/tabler · ★ 41.9KTabler is a free and open source admin dashboard UI kit built on Bootstrap 5: ready-made layouts, components and demo pages for admin panels, dashboards and web apps, in light and dark mode.
 +6
AdminLTE
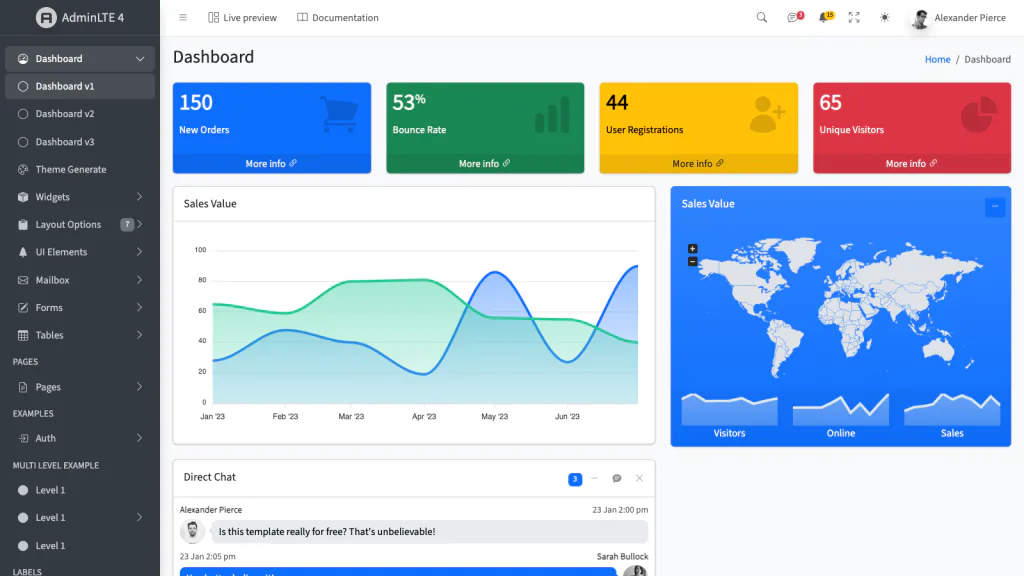
ColorlibHQ/AdminLTE · ★ 45.7KAdminLTE is a free, open-source admin dashboard template built on Bootstrap 5.3 with vanilla JavaScript (no jQuery), fully responsive and MIT-licensed, with official editions for React, Vue, Laravel, Django, Symfony, Angular, ASP.NET Core and Drupal.
 +5
signoz
SigNoz/signoz · ★ 32.4KSigNoz is an open-source observability platform built on OpenTelemetry: logs, metrics, traces, alerts, and dashboards in one tool for debugging production apps and monitoring AI agents.
The all-time top
12 projects · by stars
- 77.3K#1 · grafana/grafana
grafana
Grafana is an open-source platform for monitoring and observability: it lets you query, visualize, alert on, and explore metrics, logs, and traces from many data sources in one place.
- 45.7K#2 · ColorlibHQ/AdminLTE
AdminLTE
AdminLTE is a free, open-source admin dashboard template built on Bootstrap 5.3 with vanilla JavaScript (no jQuery), fully responsive and MIT-licensed, with official editions for React, Vue, Laravel, Django, Symfony, Angular, ASP.NET Core and Drupal.
- 41.9K#3 · tabler/tabler
tabler
Tabler is a free and open source admin dashboard UI kit built on Bootstrap 5: ready-made layouts, components and demo pages for admin panels, dashboards and web apps, in light and dark mode.
- 4
signoz
32.4KSigNoz/signoz · TypeScriptSigNoz is an open-source observability platform built on OpenTelemetry: logs, metrics, traces, alerts, and dashboards in one tool for debugging production apps and monitoring AI agents.
- 5

influxdb
31.8Kinfluxdata/influxdb · RustInfluxDB 3 Core is an open source time series database built to collect, process, transform, and store event and time series data, written in Rust on top of Apache Arrow, DataFusion, and Parquet.
- 6

dash
24.5Kplotly/dash · PythonDash is an open-source Python framework for building ML and data science web apps: interactive dashboards and data apps where dropdowns, sliders and graphs are wired directly into your analytical Python code, with no JavaScript required.
- 7
thingsboard
22.6Kthingsboard/thingsboard · JavaThingsBoard is an open-source IoT platform for device management, data collection, processing, and visualization: connect devices, store their telemetry, and build dashboards on top.
- 8

kibana
21.3Kelastic/kibana · TypeScriptKibana is the open source interface for querying, analyzing, visualizing, and managing your data stored in Elasticsearch — effectively the web window into an Elastic Stack deployment.
- 9

bokeh
20.5Kbokeh/bokeh · TypeScriptBokeh is a Python library for building interactive visualizations that run in modern web browsers: plots, dashboards, and data applications, with high-performance interactivity over large or streaming datasets.
- 10

openlayers
12.6Kopenlayers/openlayers · JavaScriptOpenLayers is a high-performance JavaScript library for building interactive maps on the web, able to display map tiles, vector data and markers from any source.
- 11

dashing
10.9KShopify/dashing · JavaScriptDashing is a Sinatra-based framework for building dashboards using Ruby and CoffeeScript, designed to look especially great displayed on TVs.
- 12

graphene
215graphene-data/graphene · TypeScriptGraphene is an everything-as-code analytics framework built specifically for coding agents: it adds a SQL semantic layer and a dashboard file format so an agent can answer data questions and build polished visualizations instead of a human clicking around a BI tool.
Related topics
Often tagged together