





What is this?
 SigNoz is an open-source observability platform built on OpenTelemetry: logs, metrics, traces, alerts, and dashboards in one tool for debugging production apps and monitoring AI agents.
SigNoz is an open-source observability platform built on OpenTelemetry: logs, metrics, traces, alerts, and dashboards in one tool for debugging production apps and monitoring AI agents.Do I have to run it myself, or is there a hosted version?Both. The Community edition is free open-source software you deploy on your own infrastructure; SigNoz Cloud is fully managed; Enterprise adds Cloud, BYOC, or self-hosted with compliance features.
Both. The Community edition is free open-source software you deploy on your own infrastructure; SigNoz Cloud is fully managed; Enterprise adds Cloud, BYOC, or self-hosted with compliance features.How do I get it running?Easiest path is a managed Cloud workspace with a 30-day free trial and no credit card. To self-host the free Community edition, deploy with Docker, Kubernetes, Linux, or Foundry, then instrument your apps.
Easiest path is a managed Cloud workspace with a 30-day free trial and no credit card. To self-host the free Community edition, deploy with Docker, Kubernetes, Linux, or Foundry, then instrument your apps.How does my app's data get into it?You instrument applications with OpenTelemetry; Prometheus, language SDKs, and integrations for frameworks, databases, cloud providers, and LLM tools are also supported.
You instrument applications with OpenTelemetry; Prometheus, language SDKs, and integrations for frameworks, databases, cloud providers, and LLM tools are also supported.Is everything in the free Community edition, or are some features paid-only?Some AI features are Cloud-only: Noz, the native AI teammate that investigates incidents, tunes alerts, and builds dashboards, is not part of the self-hosted Community edition.
Some AI features are Cloud-only: Noz, the native AI teammate that investigates incidents, tunes alerts, and builds dashboards, is not part of the self-hosted Community edition.Does it meet compliance requirements like SOC 2 or HIPAA?Self-hosting keeps your whole data plane under your control. Enterprise plans add SOC 2 Type II and HIPAA compliance, RBAC, ingestion controls, custom retention, and data residency.
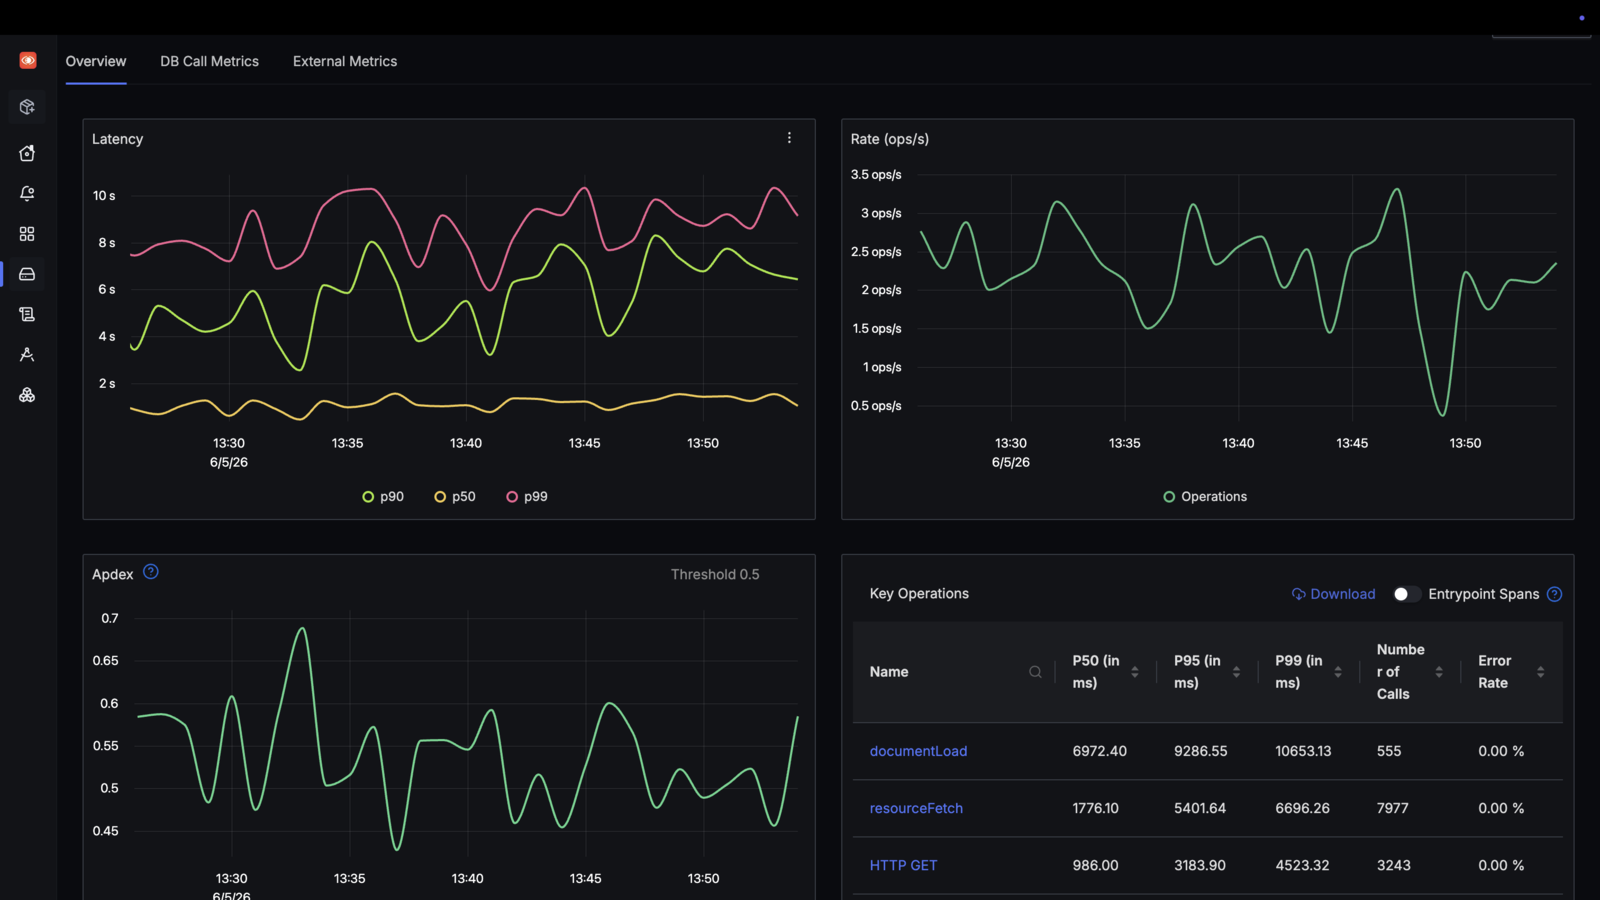
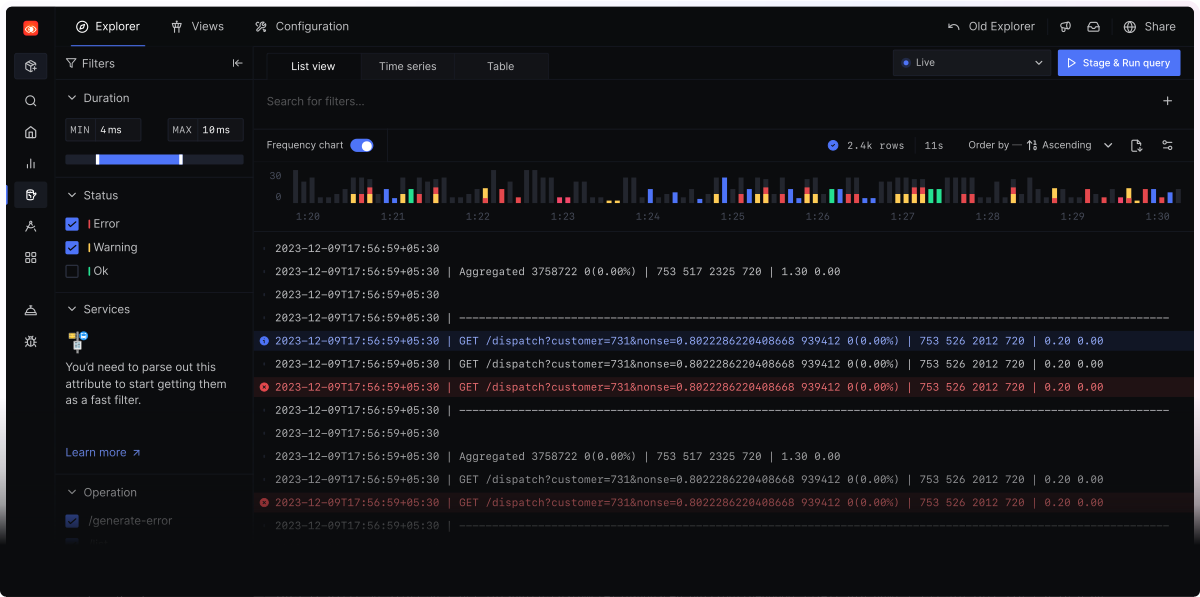
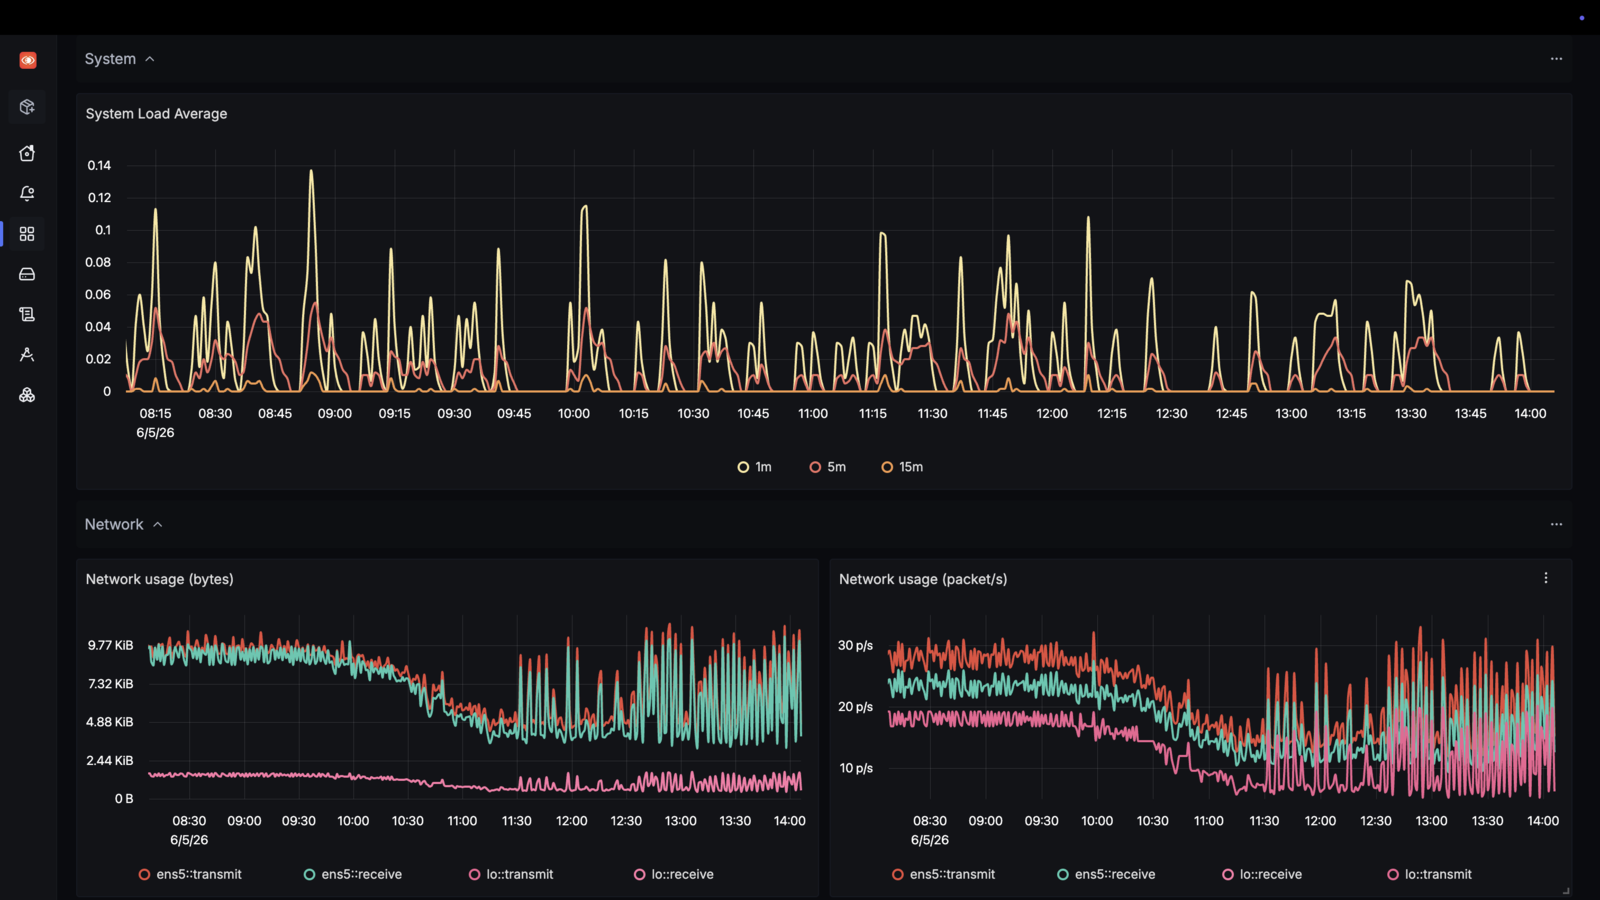
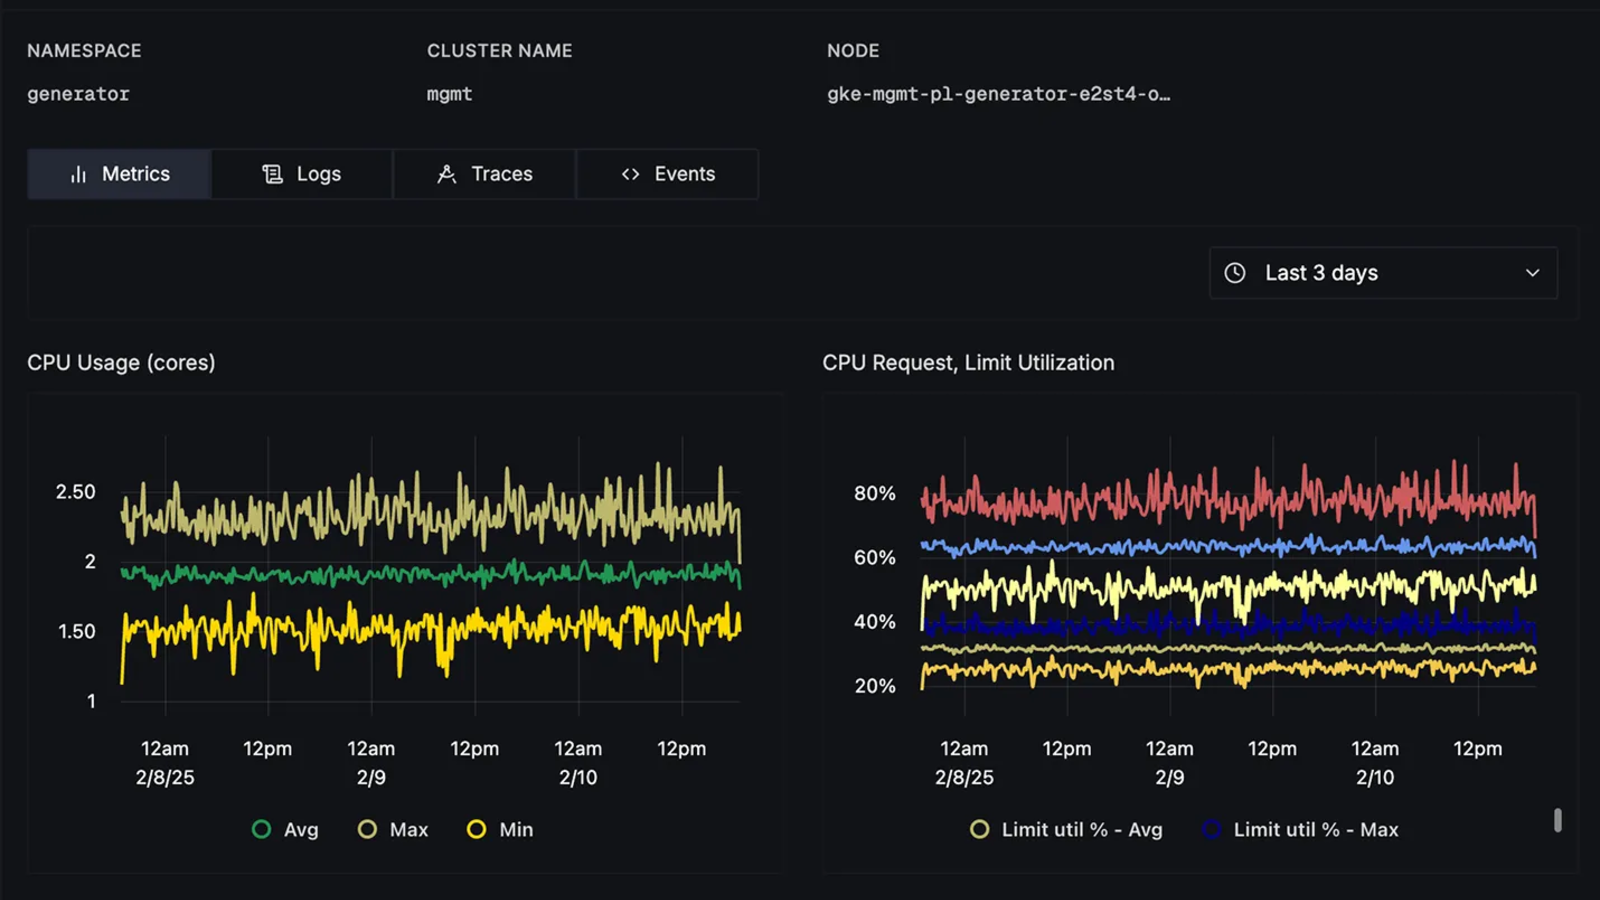
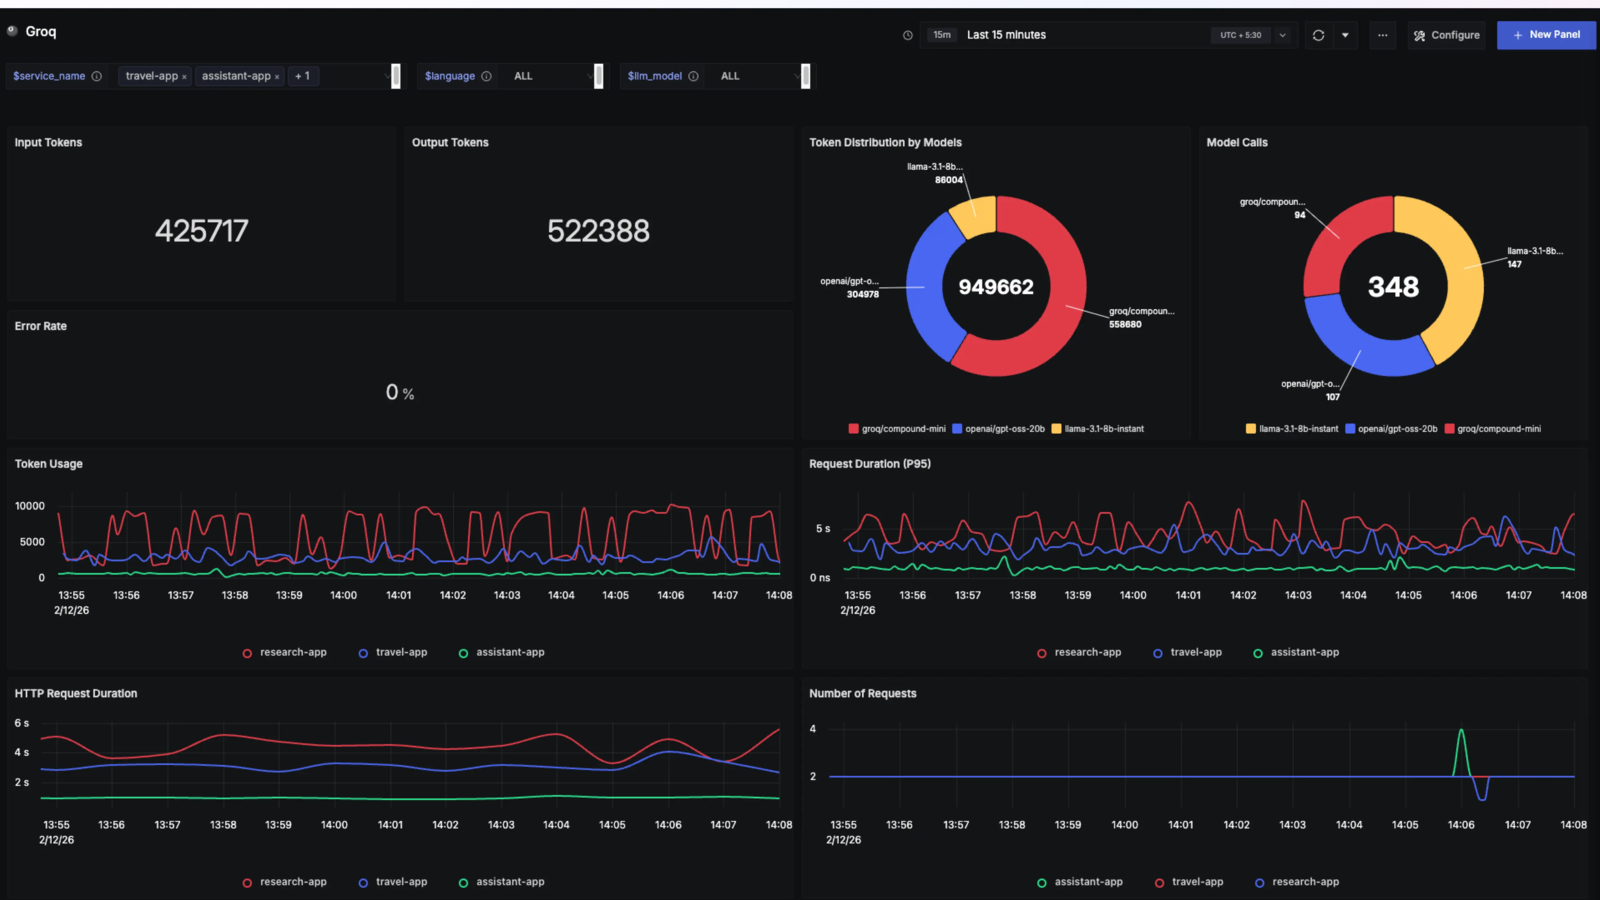
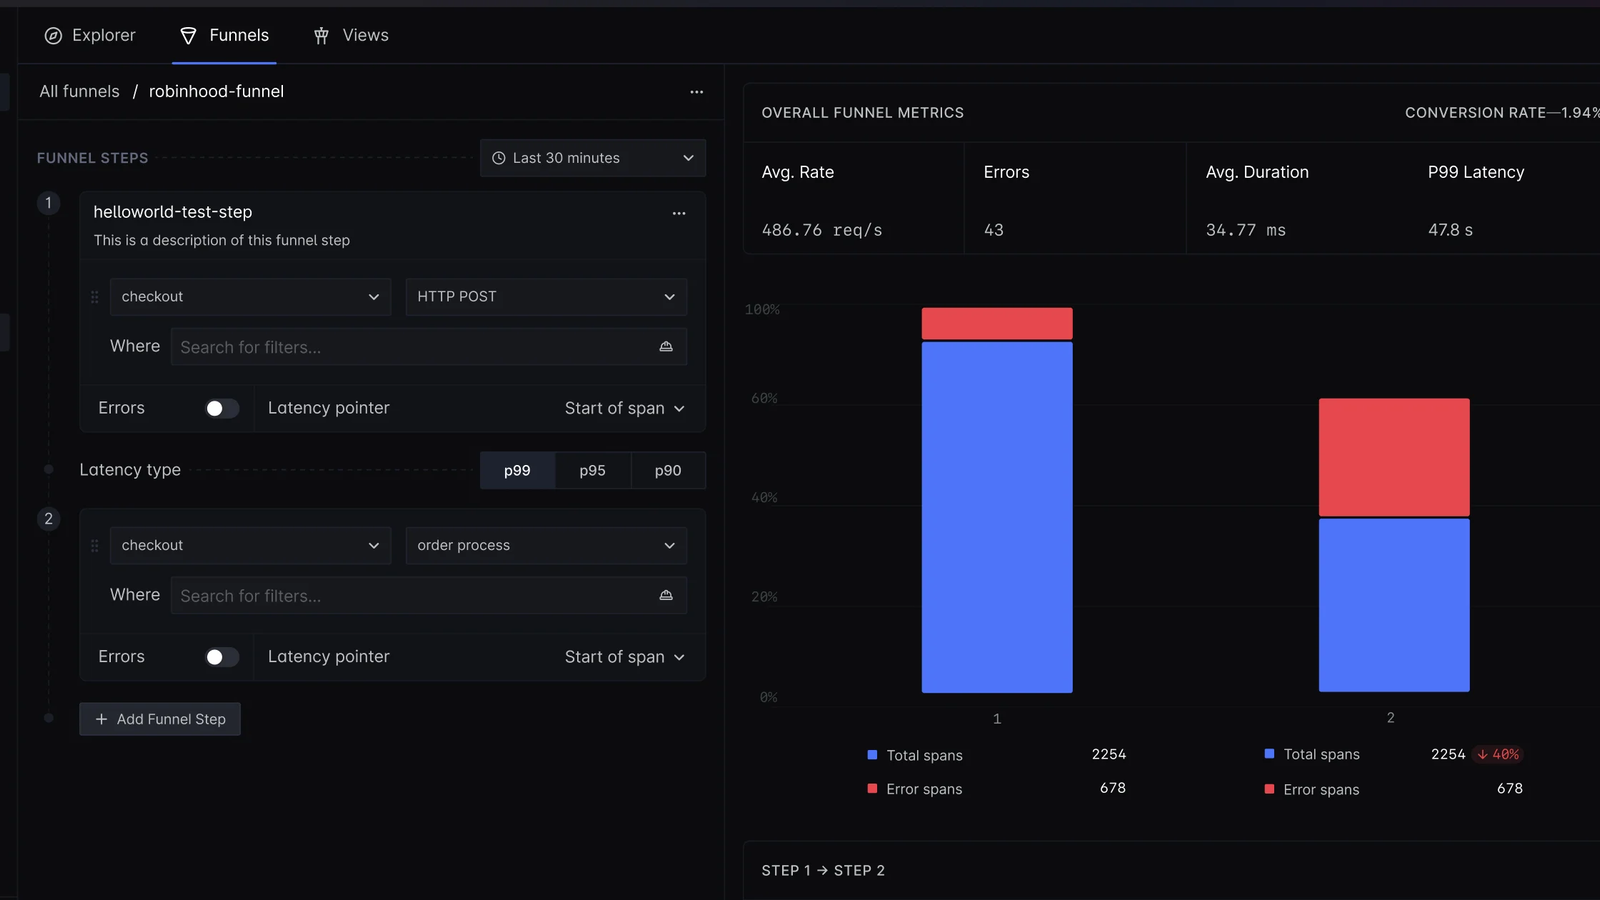
Self-hosting keeps your whole data plane under your control. Enterprise plans add SOC 2 Type II and HIPAA compliance, RBAC, ingestion controls, custom retention, and data residency.What can I actually monitor with it?Service latency, error rate, throughput, Apdex, and database calls (APM); logs via a visual query builder; dashboards with PromQL or ClickHouse SQL; Kubernetes clusters, pods, nodes, and hosts; plus LLM apps — prompts, tool calls, tokens, latency, and costs.
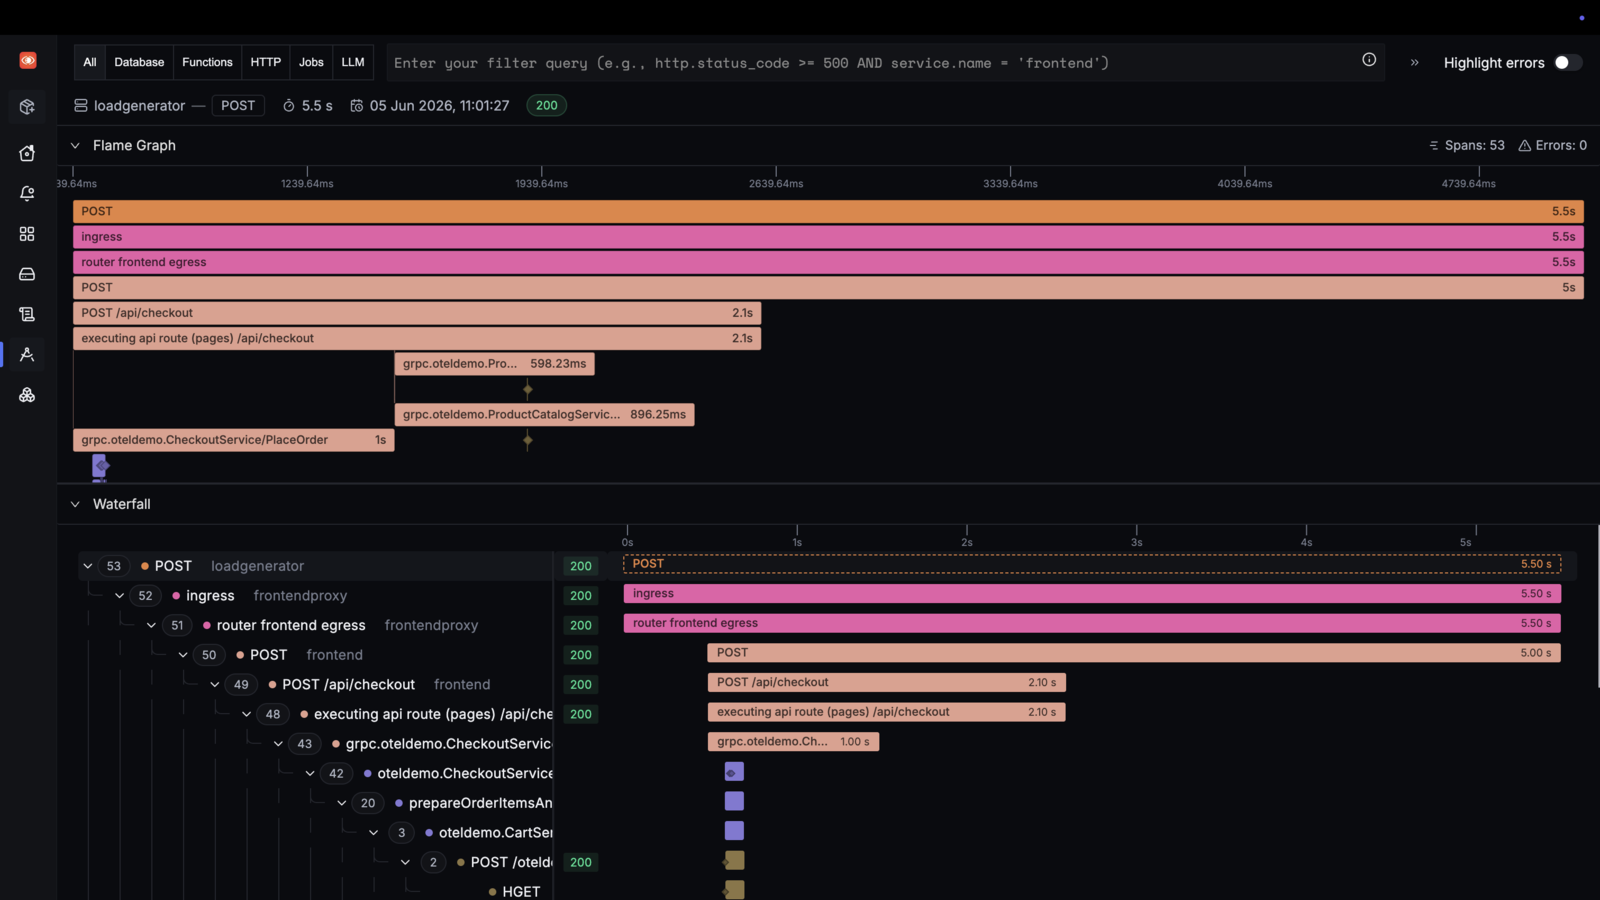
Service latency, error rate, throughput, Apdex, and database calls (APM); logs via a visual query builder; dashboards with PromQL or ClickHouse SQL; Kubernetes clusters, pods, nodes, and hosts; plus LLM apps — prompts, tool calls, tokens, latency, and costs.How is it different from Jaeger or Prometheus?Jaeger only does distributed tracing and Prometheus is metrics-only. SigNoz keeps metrics, logs, traces, dashboards, and alerts together with trace-to-log correlation, and claims 50% lower resource requirements than Elastic during ingestion.
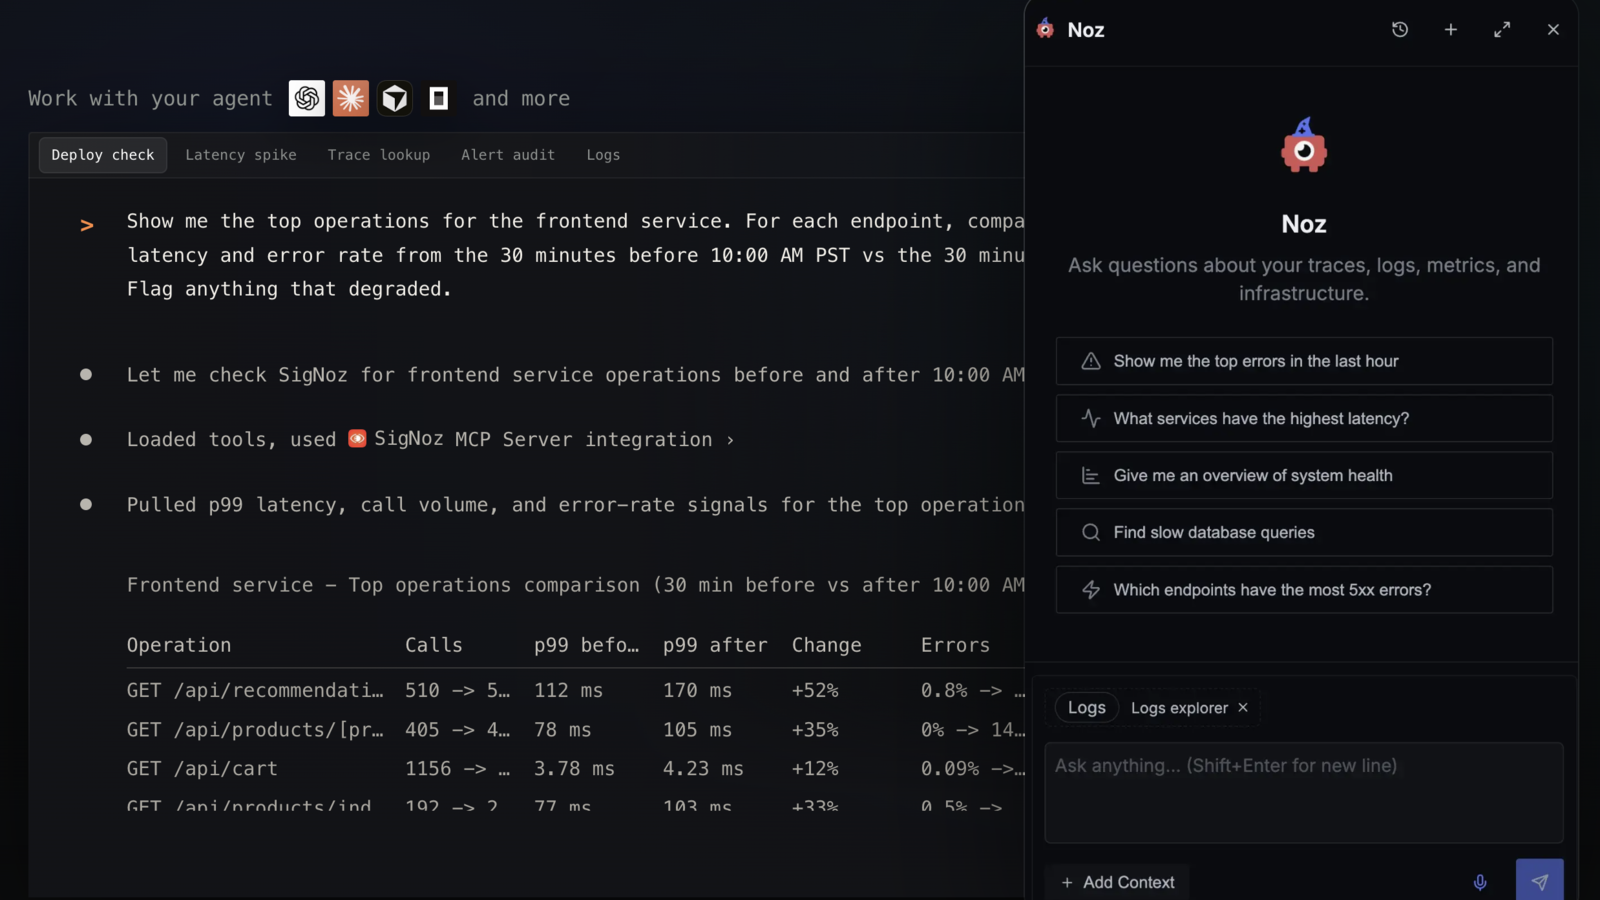
Jaeger only does distributed tracing and Prometheus is metrics-only. SigNoz keeps metrics, logs, traces, dashboards, and alerts together with trace-to-log correlation, and claims 50% lower resource requirements than Elastic during ingestion.What is Noz?A native AI teammate built into SigNoz that investigates incidents, tunes alerts, and builds dashboards with production context. It is available only on SigNoz Cloud.
A native AI teammate built into SigNoz that investigates incidents, tunes alerts, and builds dashboards with production context. It is available only on SigNoz Cloud.Can my AI coding agent pull telemetry from SigNoz?Yes — a SigNoz MCP server brings telemetry into coding agents, and agent skills docs show how to wire it up, so agents can investigate issues with real production context.
Yes — a SigNoz MCP server brings telemetry into coding agents, and agent skills docs show how to wire it up, so agents can investigate issues with real production context.What are similar projects?openobserve, jaeger, grafana, nightingale, VictoriaMetrics, serve, lago, cat
openobserve, jaeger, grafana, nightingale, VictoriaMetrics, serve, lago, catWhich topics is it in?distributed-tracing, logs, apm, log, dashboards, llm-observability, good-first-issue, alerting, tracing, telemetry, opentelemetry, clickhouse
distributed-tracing, logs, apm, log, dashboards, llm-observability, good-first-issue, alerting, tracing, telemetry, opentelemetry, clickhouse