
What is this?
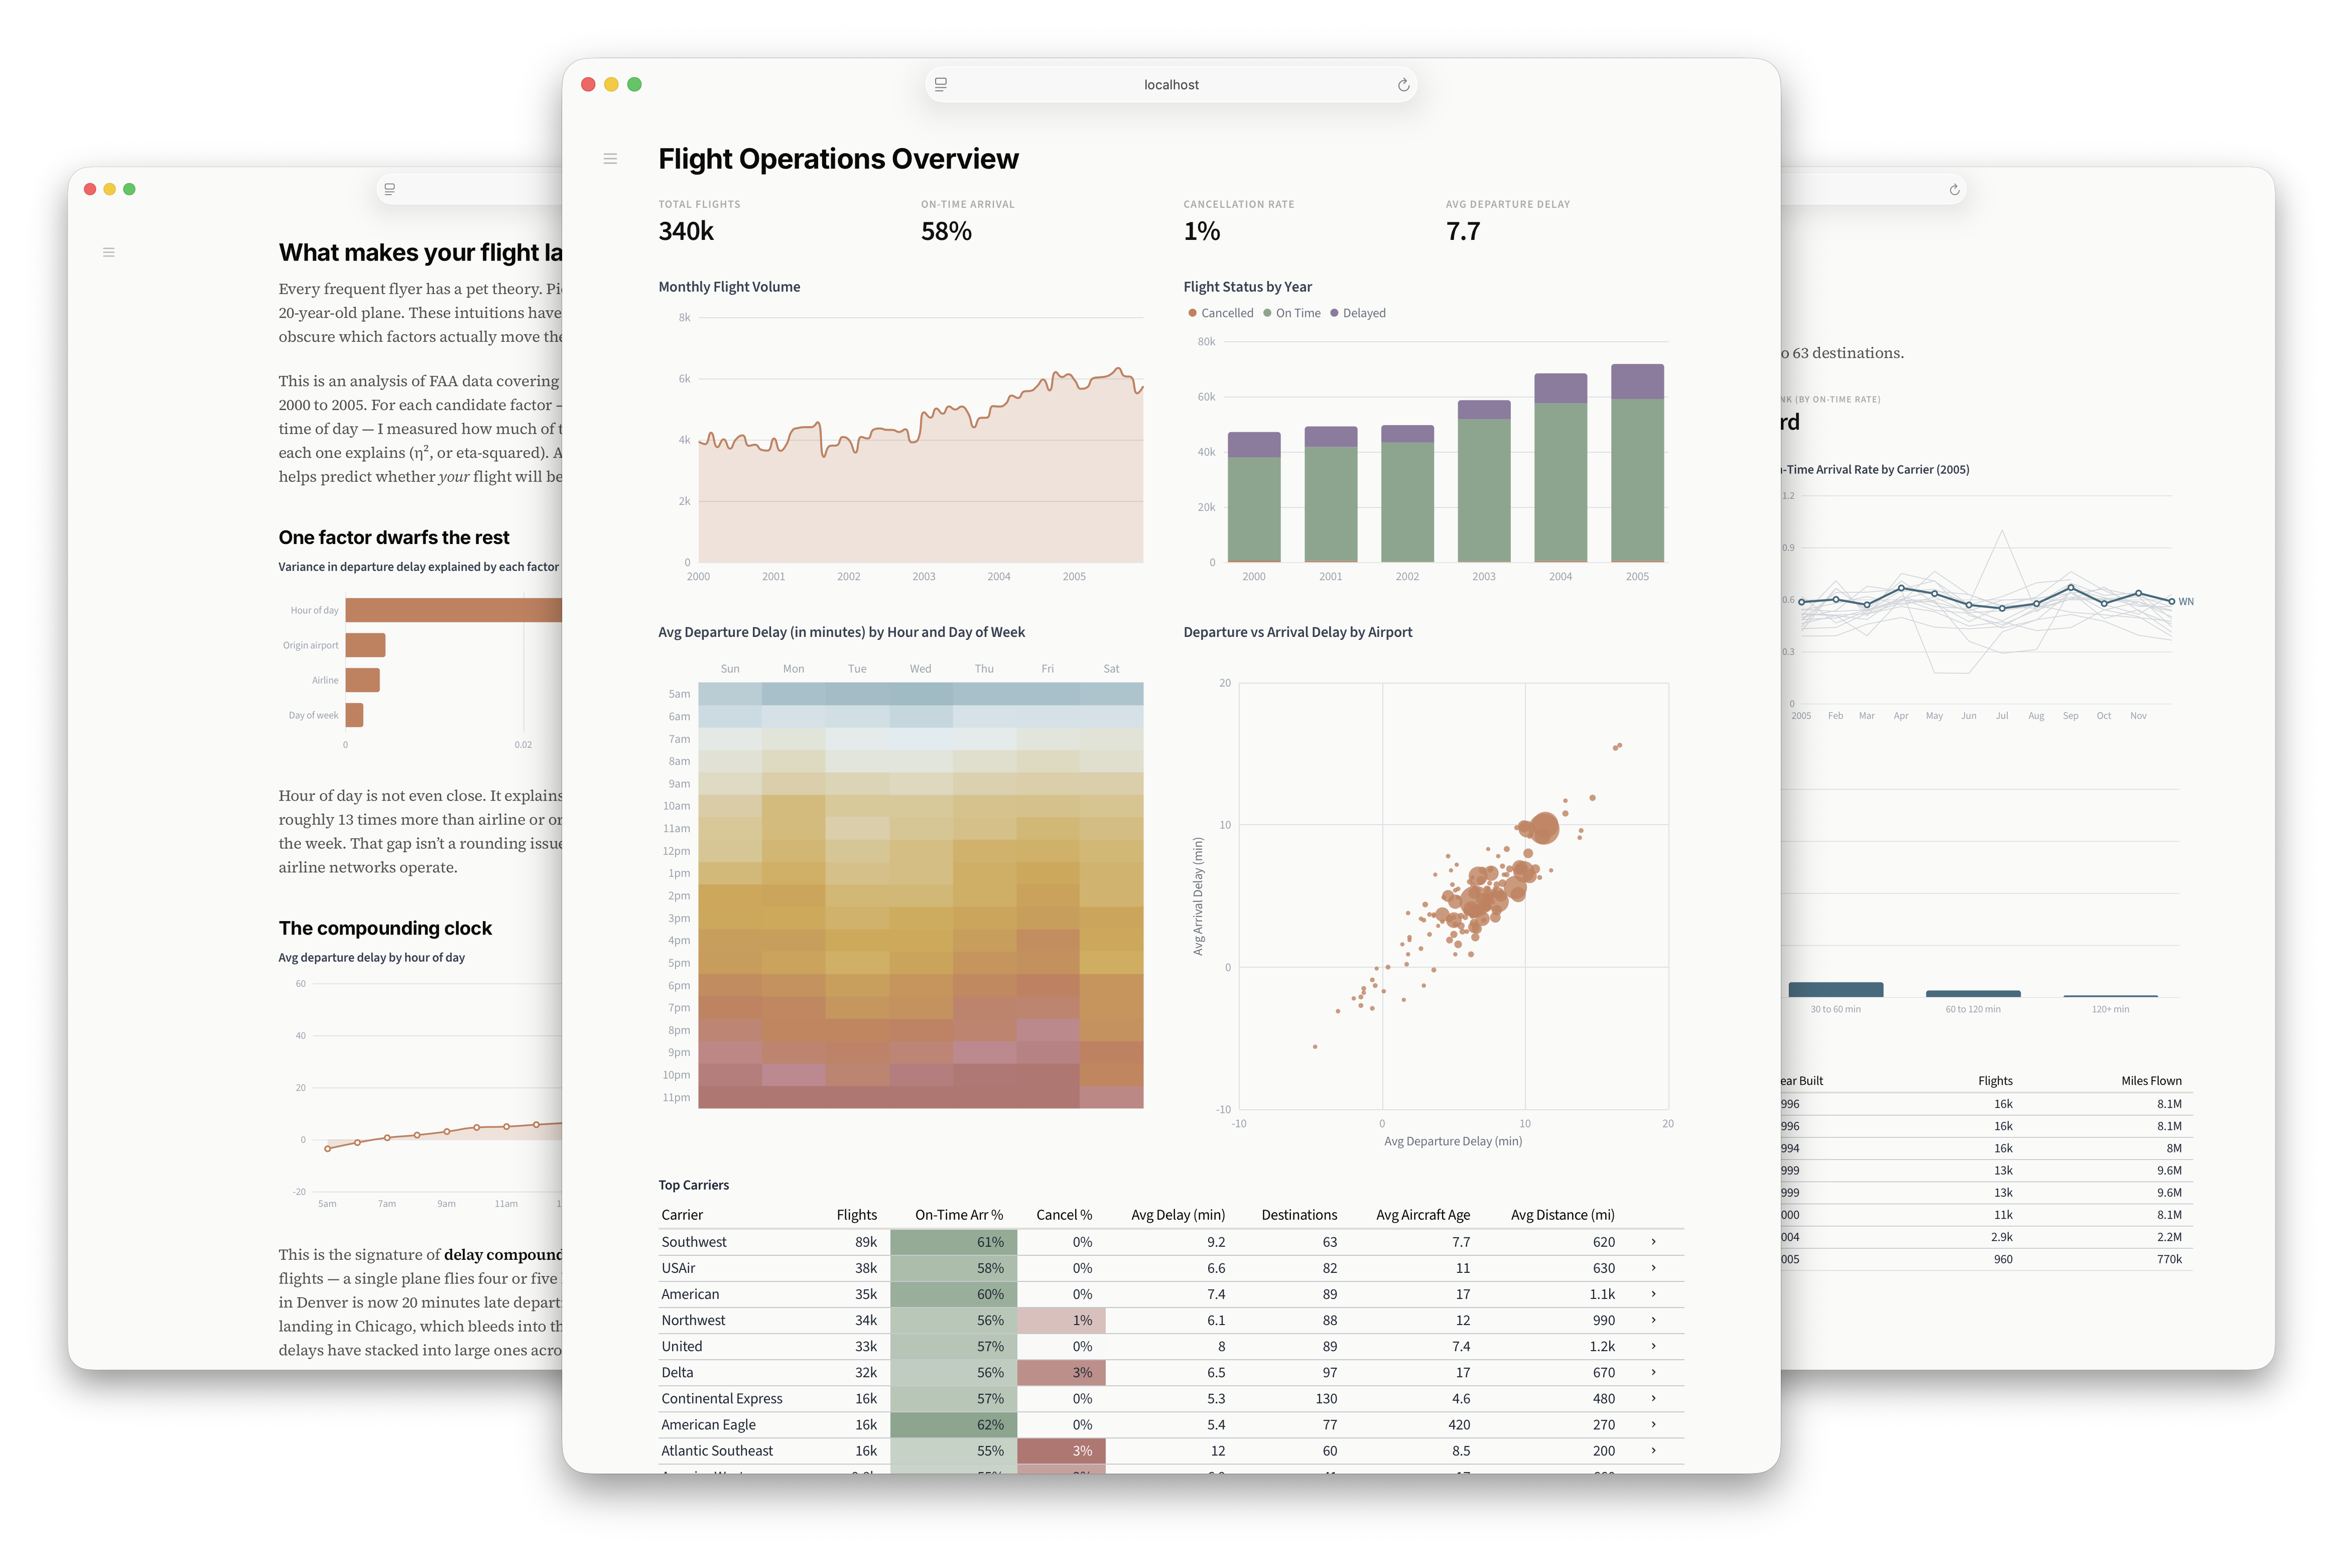
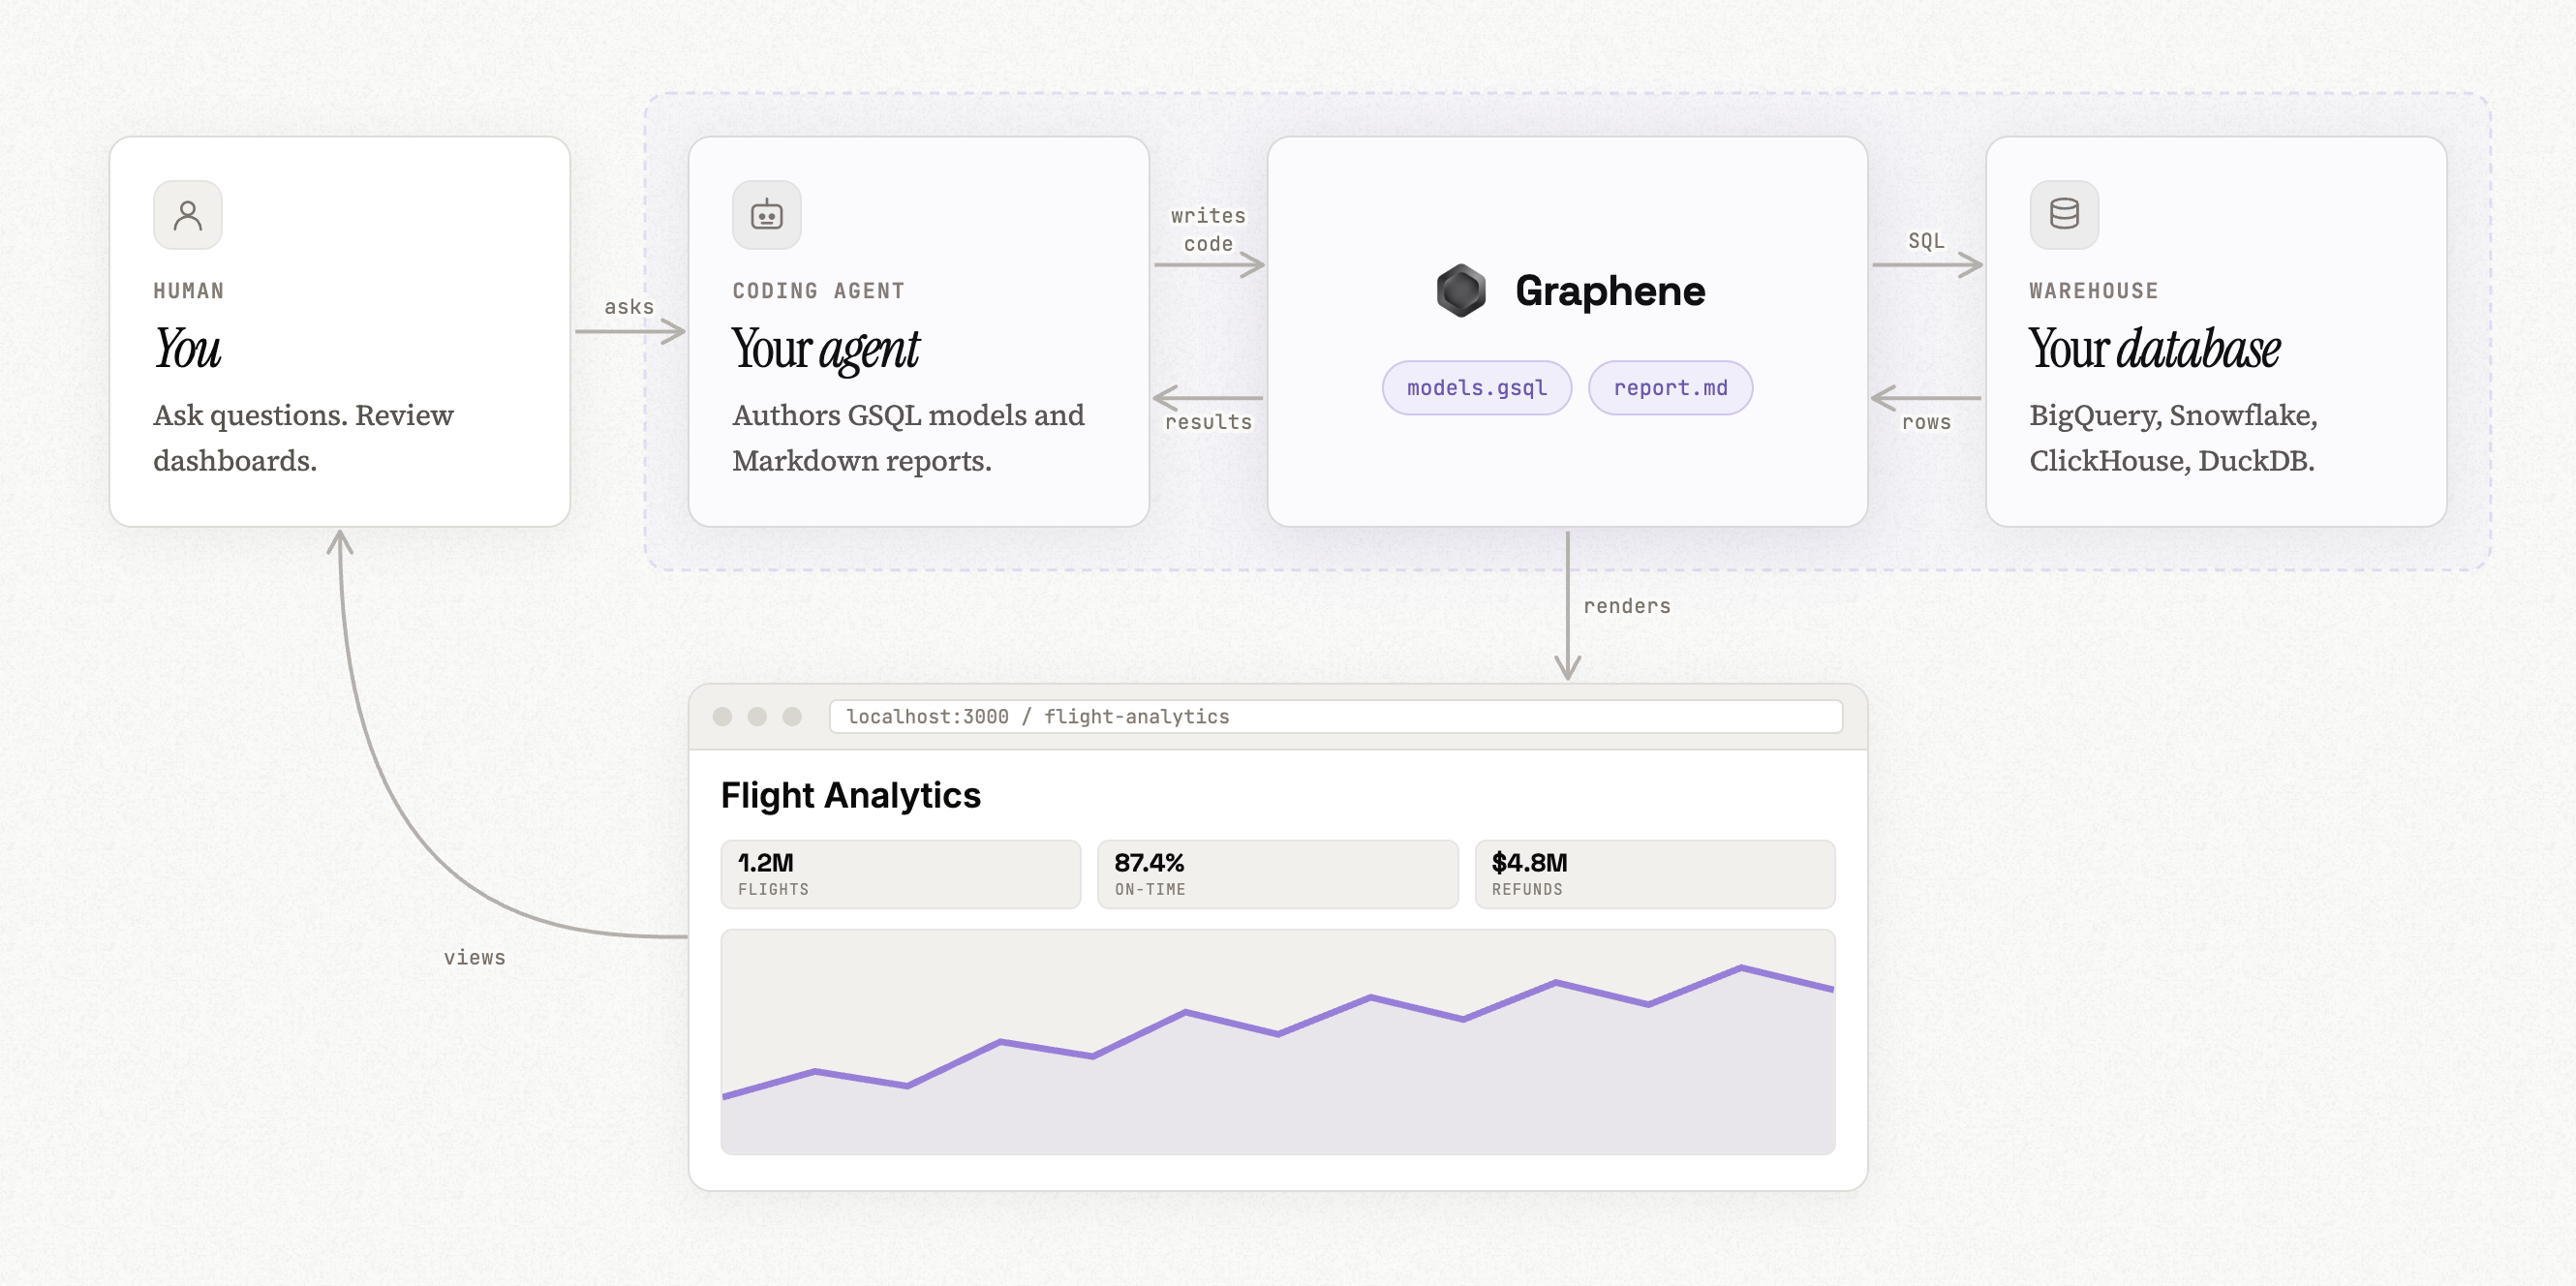
 Graphene is an everything-as-code analytics framework built specifically for coding agents: it adds a SQL semantic layer and a dashboard file format so an agent can answer data questions and build polished visualizations instead of a human clicking around a BI tool.
Graphene is an everything-as-code analytics framework built specifically for coding agents: it adds a SQL semantic layer and a dashboard file format so an agent can answer data questions and build polished visualizations instead of a human clicking around a BI tool.Is this a hosted BI dashboard app or a code-first framework?It is code-first: semantic models live in .gsql files and dashboards live in .md pages inside your own git repo, compiled and served by a CLI rather than edited in a hosted drag-and-drop tool.
It is code-first: semantic models live in .gsql files and dashboards live in .md pages inside your own git repo, compiled and served by a CLI rather than edited in a hosted drag-and-drop tool.How do I get a Graphene project running?Install the Graphene CLI from npm, create (or clone the demo) project with its .gsql models and .md pages, then run npm exec graphene serve (or the pnpm/yarn equivalent) to start the dev server before prompting your coding agent to build dashboards.
Install the Graphene CLI from npm, create (or clone the demo) project with its .gsql models and .md pages, then run npm exec graphene serve (or the pnpm/yarn equivalent) to start the dev server before prompting your coding agent to build dashboards.Which databases can I point Graphene at?It currently connects to Snowflake, BigQuery, ClickHouse, Postgres, MotherDuck, or local data via DuckDB, and the team says adding more sources is easy on request.
It currently connects to Snowflake, BigQuery, ClickHouse, Postgres, MotherDuck, or local data via DuckDB, and the team says adding more sources is easy on request.Do I have to use git and a coding agent to use Graphene?Yes for the free, self-hosted version — the README is explicit that the only alternative without git/an agent is the paid Graphene Cloud, which adds a Slack agent, browser SaaS UI, and MCP server.
Yes for the free, self-hosted version — the README is explicit that the only alternative without git/an agent is the paid Graphene Cloud, which adds a Slack agent, browser SaaS UI, and MCP server.What is Graphene SQL exactly?It behaves like regular ANSI SQL with CTEs, subqueries, and window functions, but adds measures and modeled joins from semantic layers, so you can write things like 'revenue' or 'users.name' instead of hand-writing joins and aggregations.
It behaves like regular ANSI SQL with CTEs, subqueries, and window functions, but adds measures and modeled joins from semantic layers, so you can write things like 'revenue' or 'users.name' instead of hand-writing joins and aggregations.Why not just build dashboards with React or Python notebooks?You can, but teams using that route end up with inconsistent visuals and duplicate metric formulas; Graphene codifies metrics into deterministic objects so every chart computes 'EBITDA' the same way and renders consistently by default.
You can, but teams using that route end up with inconsistent visuals and duplicate metric formulas; Graphene codifies metrics into deterministic objects so every chart computes 'EBITDA' the same way and renders consistently by default.How does the company make money if the core project is free?Through Graphene Cloud, a paid managed service that hosts the dashboards and reports an agent builds, plus a Slack bot and MCP server for quick ad-hoc questions.
Through Graphene Cloud, a paid managed service that hosts the dashboards and reports an agent builds, plus a Slack bot and MCP server for quick ad-hoc questions.What inspired Graphene SQL's design?It's inspired by Malloy, from the creators of LookML, but implemented as plain SQL rather than a new query language so coding agents already fluent in SQL can use it immediately.
It's inspired by Malloy, from the creators of LookML, but implemented as plain SQL rather than a new query language so coding agents already fluent in SQL can use it immediately.What are similar projects?redash, superset, grafana, dataease, ChatLab, perspective, pi-autoresearch, metabase
redash, superset, grafana, dataease, ChatLab, perspective, pi-autoresearch, metabaseWhich topics is it in?bi, dashboards, data-analysis, charts, analytics, data-visualization, sql, cli-tool, monitoring, coding-agent, framework, agent
bi, dashboards, data-analysis, charts, analytics, data-visualization, sql, cli-tool, monitoring, coding-agent, framework, agent