What AiSOC does
Telemetry arrives from your security tools. AiSOC normalizes it, runs the 2966 executable rules of
its 7408-rule library, groups what fires into incidents, investigates each one with an AI agent whose
every prompt and tool call is recorded, and proposes an action. New threat intelligence re-sweeps the
history you already collected, and a human approves before anything reaches a vendor.
What it looks like running
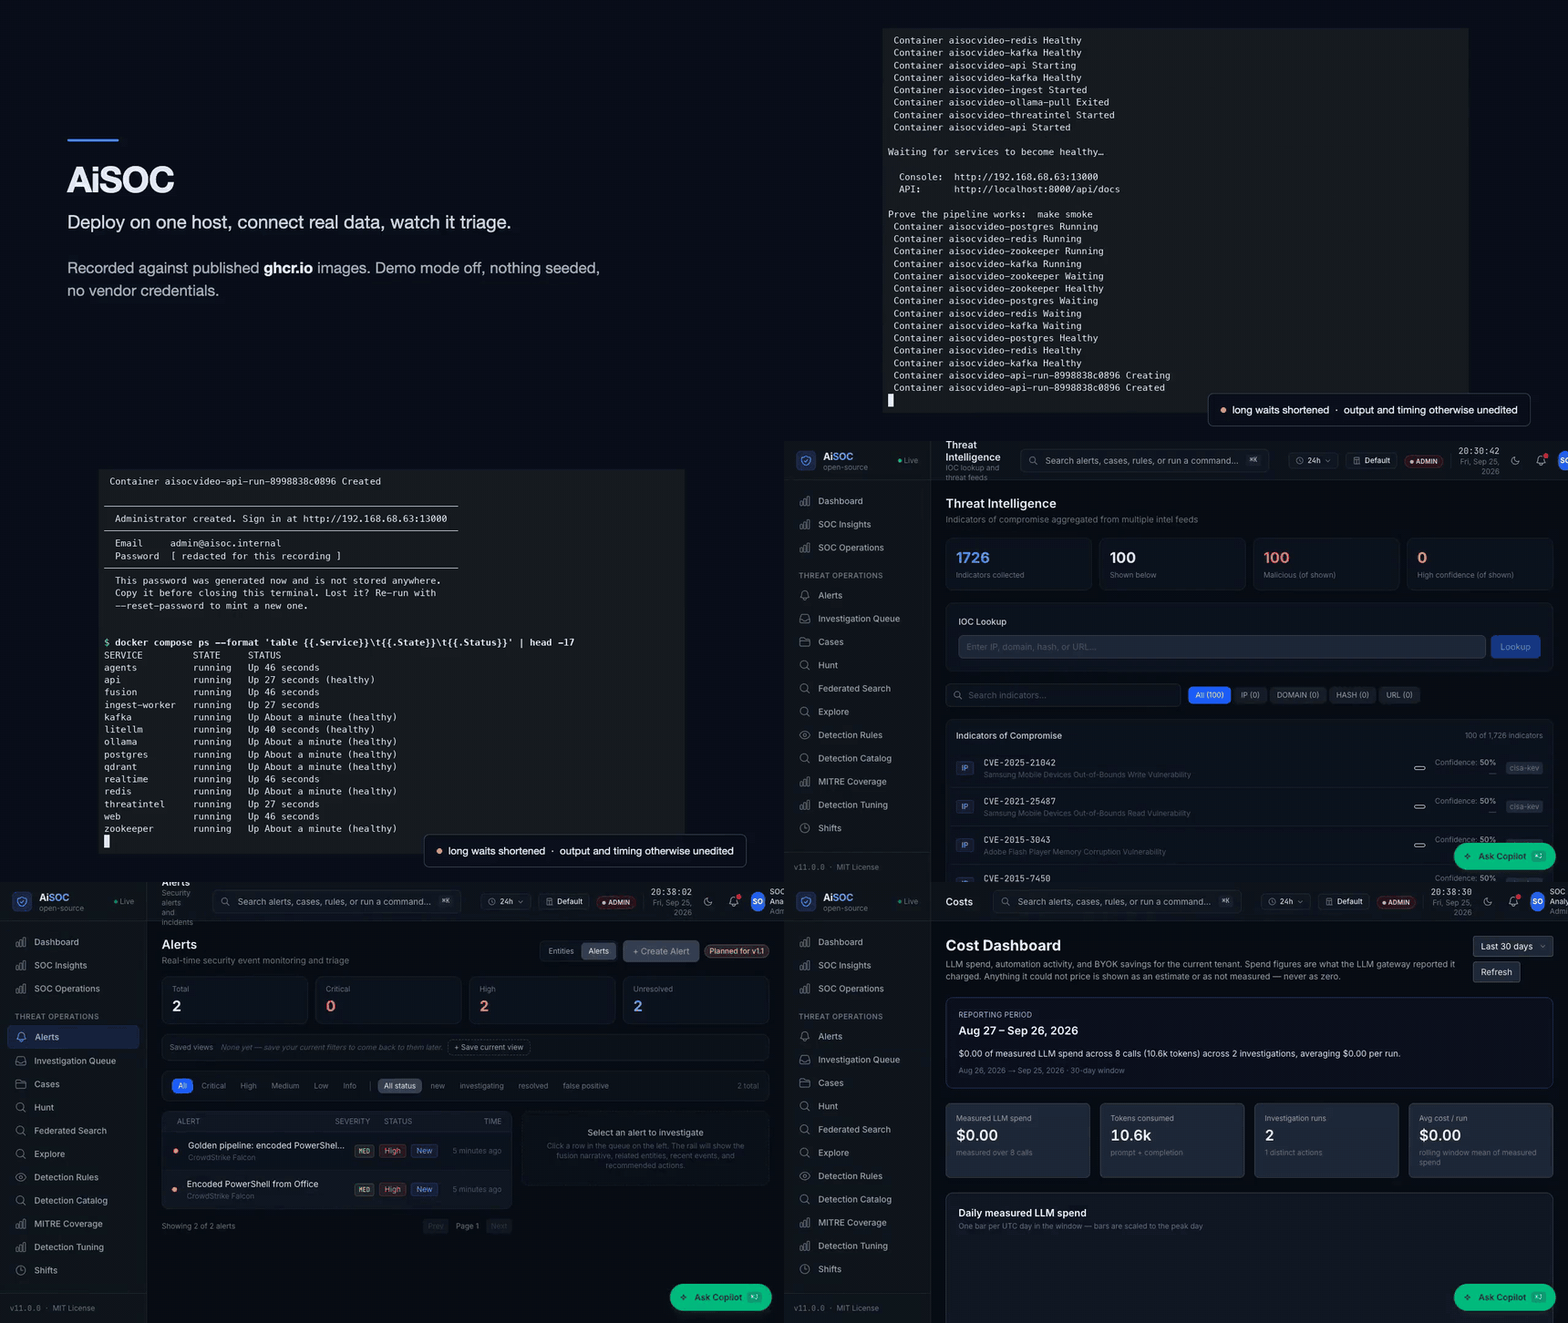
Watch the full three minutes — install to AI verdict on one
server against the published images, terminal waits shortened and the recording saying so on screen.
The stills below are from a v20.1.0 run under the same rules — the recording is older than they are.
(step by step · what is real)
|
|
 |
 |
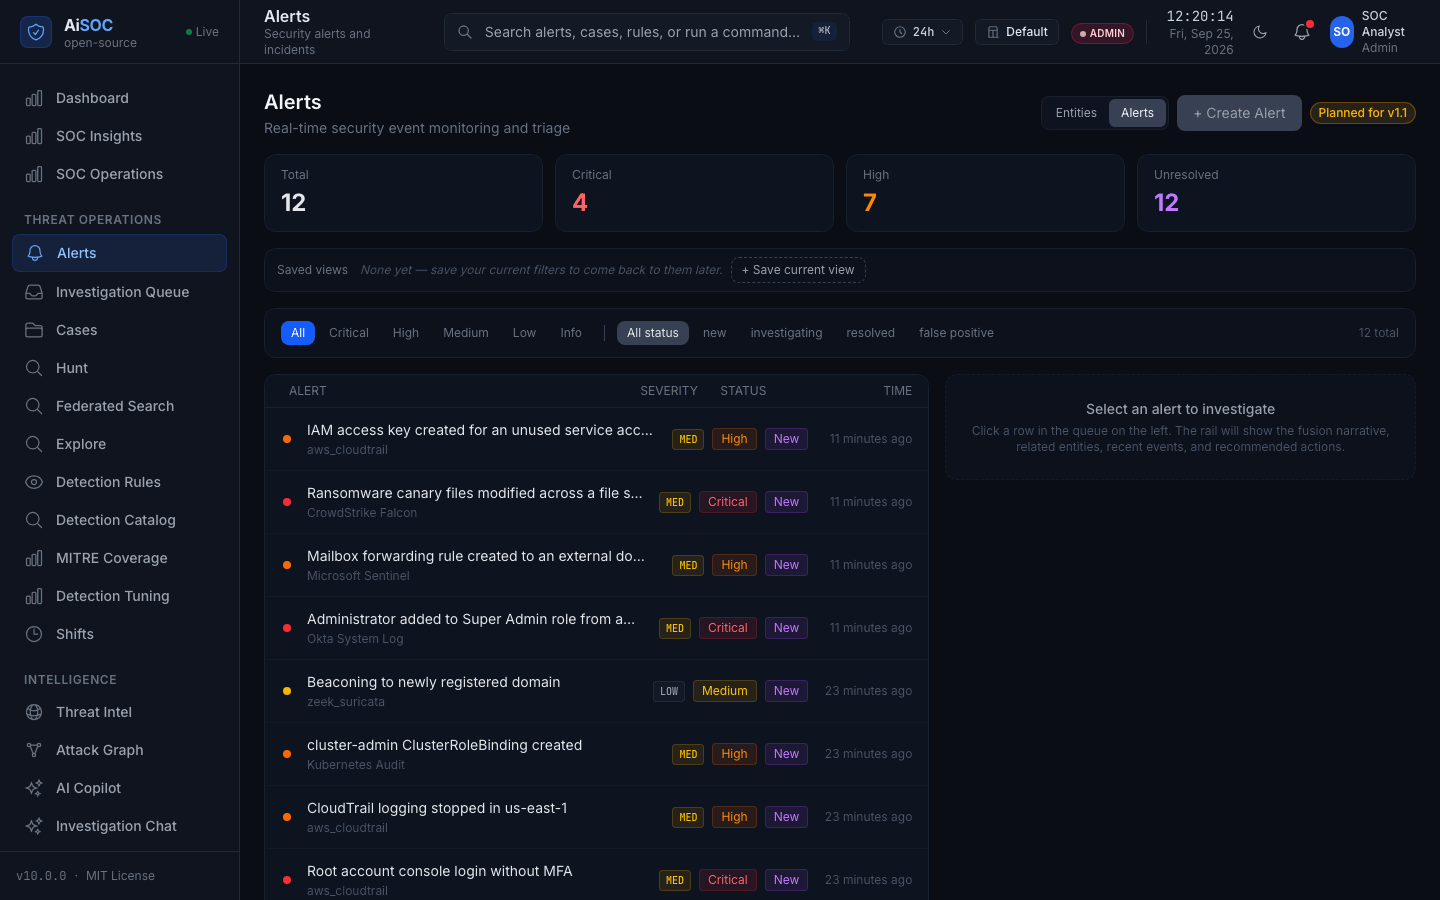
| Alerts — each attributed to the connector that fed it. |
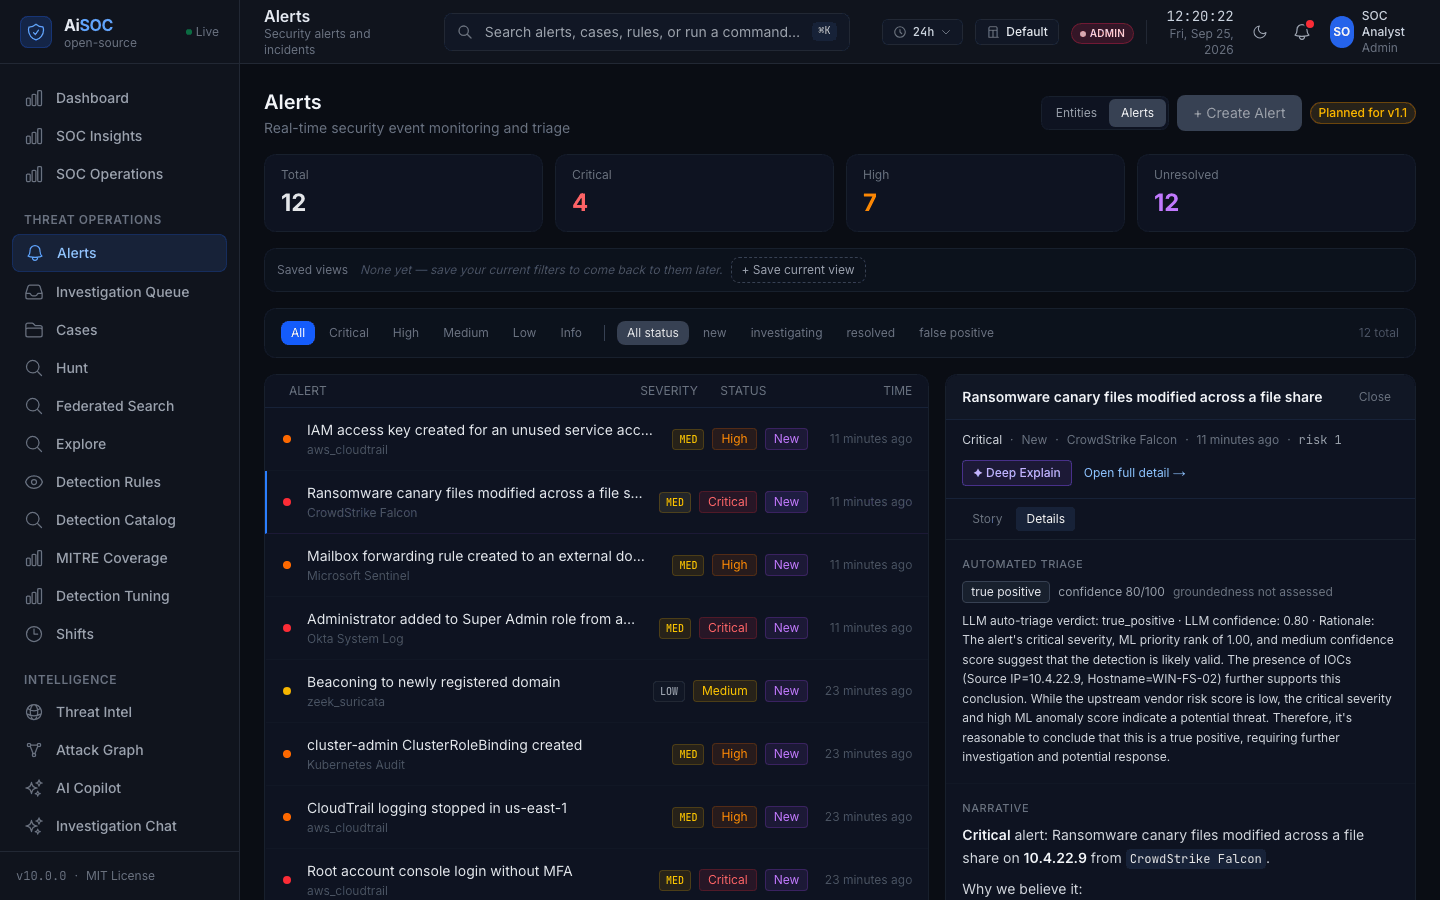
Automated triage — the bundled local model's verdict, confidence and rationale, verbatim. |
 |
 |
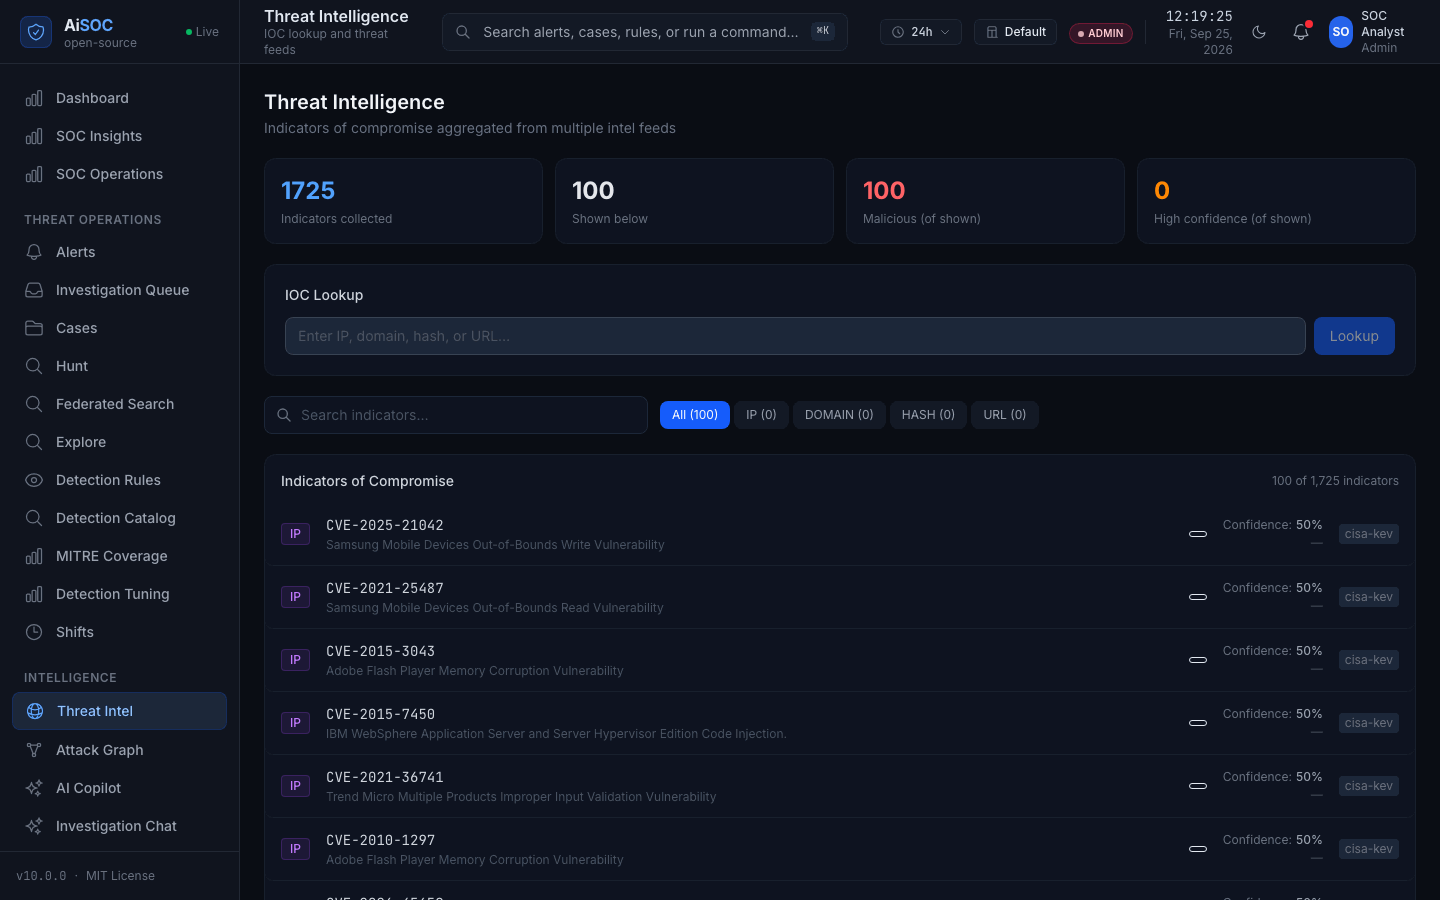
| Threat intelligence — the real CISA KEV catalog, minutes after boot, with no API key. |
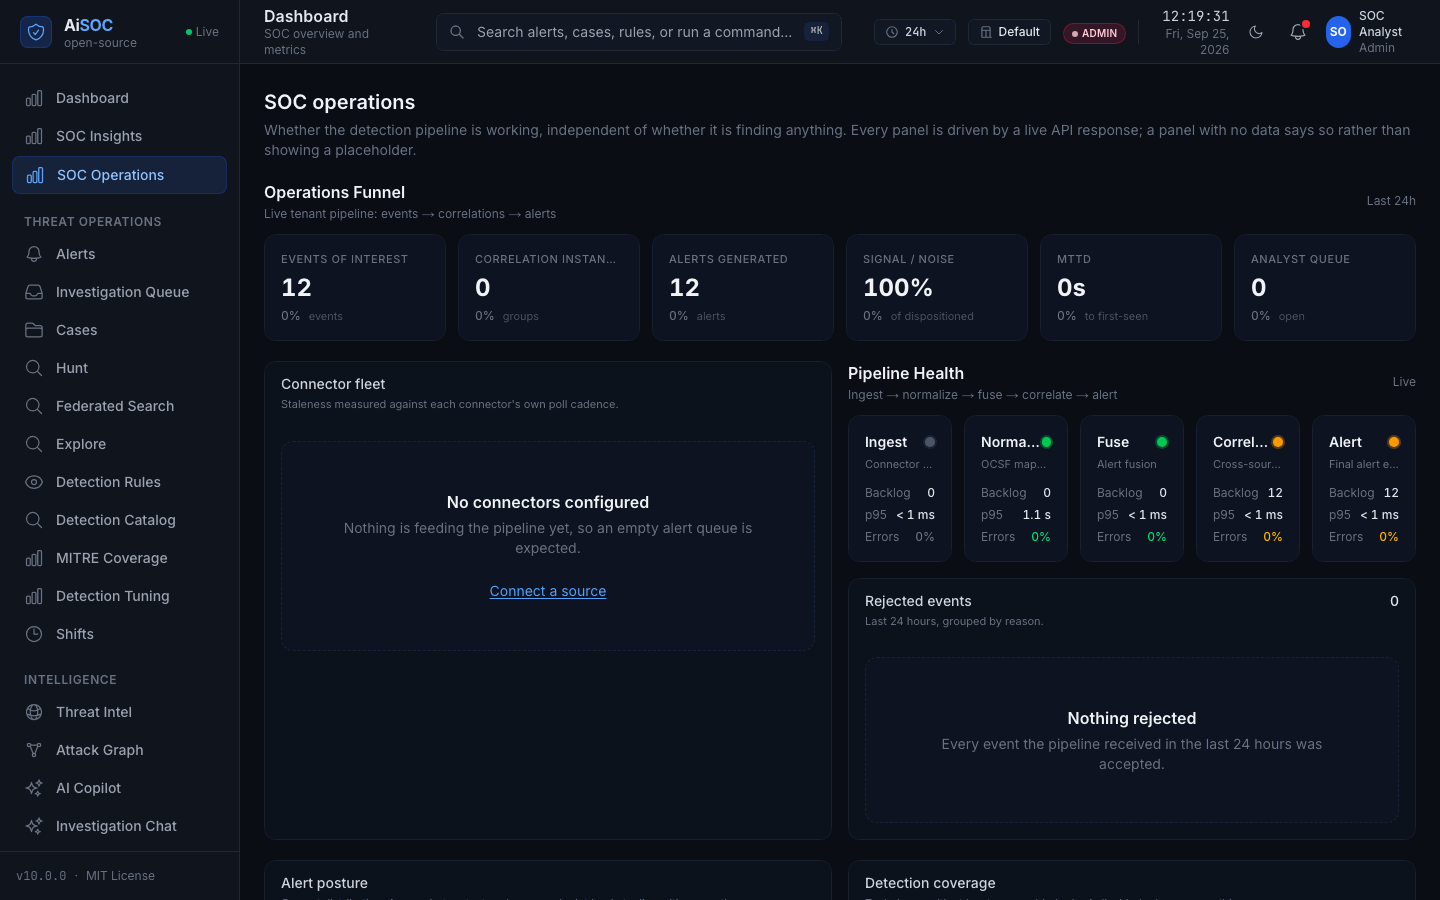
SOC operations — with nothing connected yet, and it says so rather than showing a placeholder. |
Quick start
git clone https://github.com/beenuar/AiSOC && cd AiSOC
make up
On Windows, or on a machine with nothing installed yet, one line does the prerequisites too: iwr -useb https://raw.githubusercontent.com/beenuar/AiSOC/main/install.ps1 | iex (curl -fsSL https://raw.githubusercontent.com/beenuar/AiSOC/main/install.sh | bash on Linux and macOS). Without Docker at all, pip install aisoc-sandbox && aisoc-sandbox demo walks one alert through the agent funnel offline in under 30 seconds. Without your own machine, open the repo in GitHub Codespaces and run make up in its terminal. All four end at the same console; only the first three install anything.
The Technical Guide covers this in depth: server sizing, where the model runs, every failure mode with its cause and fix, the REST API, MCP, and every console surface.
Needs Docker Compose v2 with 8 GB memory and 20 GB free disk in the Docker VM, plus python3 (3.9+) and bash; make doctor checks all of it and Installation says what each number was measured against. The first run downloads a ~2 GB model into a volume only make clean clears.
make up also creates .env and generates the fifteen secrets in it — the credential vault, the
session signing key, five service-to-service credentials and four datastore passwords — then creates an
administrator and prints its password, generated on your machine, shown once and stored nowhere. Lost
it? make bootstrap ARGS=--reset-password mints another.
A port already in use does not stop the install. AiSOC publishes on a free one, names what held the
old one, and moves the console address with it: 64 seconds to a signed-in console on a bare clone with
5432 and 11434 both taken.
Then prove it works. make smoke posts one real event to the ingest API and follows it through
Kafka, detection, correlation and Postgres, then reads the alert back out of the public API. Every
stage reports PASS or FAIL:
$ make smoke
[PASS] raw telemetry accepted by ingest
[PASS] event traversed the spine and became an alert
PASS: 10/10 stages
Sign in at the address make up printed. A tenant with nothing connected lands on a setup
wizard rather than an all-zero dashboard, and its state is read from your own data so it stays
right if you connect a source through the API. The spec is
docs/openapi.yaml — interactive docs are off in this production-class stack.
Stuck? make doctor, which on a host where you have not run make up yet says exactly that.
Press Load sample data in the wizard. Five scenarios take the same ingest path a real connector uses — not inserted rows — so watching them become alerts means watching the pipeline work. They span low to critical on purpose, because a first run where everything is a crisis teaches you nothing about how triage separates signal from routine. They are attributed to AiSOC in the source column, refuse to load into a tenant that already has real alerts, and do not mark setup complete. (what each step proves) For the larger fixed corpus used by demos and evals, make demo loads a synthetic dataset — the pipeline shape, never a benchmark, a customer or an incident. Every row is is_synthetic = true and labelled in the console.
Connect real data
Push, with a credential from make ingest-token (the tenant comes from it, not a header):
curl -X POST http://localhost:8081/v1/ingest/batch \
  -H 'Content-Type: application/json' -H "Authorization: Bearer $AISOC_INGEST_TOKEN" \
  -d '{"connector_id":"edr-1","connector_type":"crowdstrike","events":[{"severity":"high",
       "title":"Encoded PowerShell from Office","host":"WIN-FIN-01"}]}'
Or pull, by configuring one of 97 click-and-connect data connectors in Settings → Connectors
— Splunk, Sentinel, Elastic, CrowdStrike, Okta, AWS and Kubernetes audit among those with
vendor-specific normalization and setup docs
(coverage). Without a vendor profile
a connector still ingests through a generic mapping that resolves host, user and source IP.
A real cloud estate does not hand you its logs over a REST call. Four collectors read the
surfaces one actually emits to: a CloudTrail organisation trail on S3 notified over SQS
(management events, data events and VPC flow logs), a GCP Pub/Sub subscription on a Cloud Logging
sink, an Azure Event Hubs capture, and a syslog/CEF listener. Each keeps a resumable cursor
and a bounded per-poll budget, so a backlog applies backpressure instead of flooding ingest.
Bringing existing detections? packages/aisoc-migrate translates Splunk SPL, Sentinel KQL and
Elastic EQL and refuses rather than approximating what it cannot carry, because an almost-right
rule is harder to find than a missing one: of the 2,005 Splunk rules bundled here 1,734 translate and
1,711 of those are partial (what that means).
How it works
Ingest normalizes to a common shape and stamps an activity projection on every event — actor, action, resource, location, outcome, with actor.kind read from each vendor's own documented field rather than inferred — then Kafka carries it.
Then fusion runs 2966 executable detection rules, of 7408 on disk, plus 76 sliding-window rules (73 count across events; 3 match an ordered sequence), applies your tenant's own tuning on top — the disables, floors and suppressions the console writes, so a rule you turned off actually stops firing — and decides what becomes an alert.
Correlation groups related alerts, an agent investigates and writes its reasoning to the Investigation Ledger, and a playbook may start from the result. Separately, new threat intelligence sweeps the lake for sightings you already collected, and a hypothesis becomes a hunt without anyone writing a query — the model fills a closed schema and every value is bound as a parameter, so it cannot express a query at all.
A playbook triggered by an alert previews before it acts. Three switches must agree — the
deployment, the tenant, the playbook — and every default is off; anything less runs in preview with
its plan attached to the alert. An approval step is a durable pause: the run suspends to Postgres,
survives a restart, resumes after the approval, and expires with a recorded outcome rather than
hanging.
Executable is earned, not declared. A rule joins the compiled ruleset only after a vendor-shaped
event is replayed through the real connector and engine and that rule is watched to fire — never
inferred from a directory or an enabled: flag. The proof can fail: --prove-gate reverts the
Windows connector and requires all 1,687 Windows rules to go silent. It means reachable, not that it
detects an attack. Two rules still cannot fire — down from 119, because a rule that could not fire
stopped being counted as executable — and both are waiting on a behavioural baseline. The ratchet
only moves down. (why 1,362 were refused)
Every answer carries its receipts. The copilot cites each checkable claim to the ledger entry behind
it and labels the rest uncited rather than dropping them, and any investigation exports as a signed
evidence bundle — byte-identical, prompts as digests, OCSF 1.9.0. (how)
Where state lives. Twenty service trees (14 Python, 4 Go, 2 TypeScript) behind the Next.js console. Kafka is the
spine; Postgres holds the alerts, cases and the tamper-evident audit chain; Redis and Qdrant are in CORE too, and
full adds ClickHouse (the event lake), Neo4j (the entity graph) and OpenSearch (full-text search).
docs/architecture/README.md walks that path one step at a time —
eleven steps, five diagrams, every box linking to the code — and mirrors to the docs portal.
Deployment profiles
| Profile |
Command |
Services |
RAM |
What you get |
| core |
make up |
16 |
~8 GB |
The full alerting pipeline: ingest → detect → correlate → alert → triage → console, plus the LLM gateway, a local model, the CISA KEV threat feed, and the connector and response services the agent's vendor tools reach |
| full |
make up-full |
22 |
~12 GB |
Core plus event lake, entity graph, full-text search, enrichment |
| demo |
make up && make demo |
16 |
~8 GB |
Core plus labelled synthetic data |
CORE is the smallest deployment that takes a real event and produces a real alert, and it needs no
credentials to do either.
The model ships with the gateway. Ollama runs a pinned ~2 GB llama3.2:3b-instruct-q4_K_M
sized for CPU-only inference, so make up produces real triage verdicts with real token counts in
the Investigation Ledger — not a stub. It is not a frontier model: over 50 alerts it gave triage
usable output 44 times before the reply was constrained to JSON and 50 after
(method), and the rail labels which path answered. Run it
faster with make up-gpu, make up-host-llm, or your own provider from the console
(all four). No hosted provider has ever been
exercised here — there is no funded key, so per-model rows read not measured rather than zero.
(ADR-0006)
One real external feed ships too. services/threatintel polls the CISA Known Exploited
Vulnerabilities catalog — public, no API key — into the console's Threat Intelligence page: the one
thing in a fresh install that is neither synthetic nor yours.
Evaluation, reflex and replay
The published numbers carry their own provenance. (methodology · real vs synthetic data)
- Every verdict scorecard names the model that actually served it — gateway-attested or self-reported, with an explicit provenance status. A run with missing attribution, zero real calls or a deterministic fallback cannot be advertised as a named model's performance, and a measurement that cannot be bound to an attributed call cannot authorize closures.
- Denominators are published, and the uncomfortable direction wins. Full-cohort recall keeps abstentions and failures in the malicious denominator; closure claims ship with their contamination rate; alert reduction has three labelled figures (75.3% legacy grouping, 33.3% production key, 24.5% on a detection-shaped cohort after a missing identifier was fixed to narrow the group instead of widening it). Unmeasured reads not measured, never
0.
- The reflex path is observable — nine named stages from queue delay to verification, and a decision contract carrying supporting evidence, contradictory evidence, missing prerequisites and the escalation reason.
- Replay is time-frozen; re-hunting is labelled. Historical replay enforces evidence cutoffs in the retrieval queries (never by prompt), discloses the model-knowledge limit, and cannot execute real actions — the mutation boundary is the write adapter. Applying new intelligence to old telemetry is a distinct, rehearsable mode, and its discoveries are never counted as predictions at the original event time.
- Model suitability is per task. The matrix grades each configured model on the same locked evidence against a deterministic baseline floor (balanced accuracy exactly 0.250); unfunded rows read not measured, with one-command reproduction against any local OpenAI-compatible endpoint.
AI agents
Agents triage alerts and investigate incidents. What they can and cannot do:
- They read the alert, its correlated siblings, entity context, and prior verdicts for the same signature.
- They call typed tools — lake queries, graph traversals, enrichment lookups. The model picks the tool and passes arguments; it never writes SQL.
- Everything is logged to the Investigation Ledger — prompts, tool calls, citations, verdict, token cost — and exports as a signed bundle.
- Grounding is checked. A verdict citing an indicator the evidence never contained is demoted to human review rather than auto-closed.
- A prompt is validated before it is sent. Raw logs, OCSF payloads and secret-shaped values are refused, not redacted after the fact.
- No vendor is touched without a human, unless a tenant has explicitly granted autonomy for that verb. Every response step is graded against its own capability contract at dispatch, so approving a playbook never authorises whatever its steps happen to contain, and an approver must hold the required permission tier and must not be the person who requested the action.
Project maturity
Stable is defined, and a gate enforces it. It was ungated prose until three rows were found describing coverage that did not exist. A row is Stable only with a check that runs on every pull request with no path filter, drives the real production path against real infrastructure, and has a negative control proven by breaking the thing and watching it go red. (the bar)
| Capability |
Status |
Tested |
Production ready |
| Ingest → detect → correlate → alert |
Stable |
E2E + unit |
Yes |
| Detection engine (2966 executable rules) of 7408 |
Stable |
Replay proof |
Yes |
| Alert correlation into incidents |
Stable |
Unit |
Yes |
| REST API + web console |
Stable |
Unit + integration |
Yes |
| AI triage + Investigation Ledger |
Stable |
Live Postgres ledger + a PR-gated local-model agent run. No hosted provider has been exercised |
Yes, copilot mode |
| Event lake + hunting (ClickHouse) |
Stable |
Live ClickHouse on the shipped DDL, with a negative control |
Yes, full profile |
| Retro-hunts when new intel arrives |
Stable |
Live ClickHouse + Kafka with the flag on, with a negative control |
Opt-in, full profile |
| 68-hunt YAML library, compiled against tenant events in the lake |
Stable |
Live ClickHouse: scheduled hunts read tenant data and refuse to fall back to the fixture; all 114 field names the corpus filters on compile, via a lake column or the stored payload |
Yes, full profile |
| SCIM 2.0 provisioning |
Stable |
Live Postgres through the real app: PATCH in both providers' dialects, group membership, deprovisioning proved by its consequences, with a negative control |
Yes |
| White-label branding |
Stable |
Live Postgres: the scheduled report and its covering email carry the organisation's brand, with two negative controls |
Yes |
| Usage metering |
Stable |
Live ClickHouse on the shipped DDL, with a negative control that makes an unscoped meter fail |
Yes |
| Entity graph (Neo4j) |
Stable |
Live Neo4j against the production reader, with a negative control |
Yes, full profile |
| Governed response actions |
Stable |
Live socket: permits, refuses, never leaks a refusal, with a negative control |
Human-approved only |
| Alert-triggered playbooks, with a durable approval pause |
Stable |
Live Postgres: suspend, restart, resume, expiry, with a negative control |
Yes — three opt-ins deep, preview by default |
| Per-tenant detection tuning in the live engine |
Stable |
Live Postgres: tuning written changes what the engine fires, with a negative control |
Yes |
| Scheduled connectors |
Stable |
Live scheduler polls a stub vendor into ingest, with a negative control |
Yes |
| UEBA |
Stable |
Live Postgres: migrations, scoring, persistence, isolation, with a negative control |
Yes, full profile |
| Package distribution (npm/PyPI) |
Beta |
The five PyPI packages resolve at the tree's versions, checked against the live registries in both directions with a self-test; the npm half has no registry state to verify |
pip install aisoc-sandbox (and the other four) works today; the three npm packages still need the first-upload NPM_TOKEN, an account action |
What AiSOC is not
- Not a drop-in SIEM replacement. It correlates and investigates; it does not replace long-term log retention and compliance search.
- Not able to see telemetry you have not connected. There is no discovery.
- Not autonomous by default. Response requires explicit policy authorization and a human approver.
- Demo and sample incidents are not real incidents, and benchmark numbers are substrate self-consistency measures, not live agent accuracy — labelled as such wherever published.
Troubleshooting
make doctor checks host tools, memory, disk, every port and each datastore by querying it rather than asking whether its container is up, then prints the command to run next. A container killed by a full Docker VM is named as that, not as the service that happened to die.
(the six most common failures)
Security
Secrets are generated per deployment and never committed; connector credentials are encrypted at rest. Services connect to Postgres as a DML-only role, so row-level security actually applies, and tenant isolation is enforced at the query layer in every store. RBAC gates every mutating route, ingest is authenticated, and the default install sends no prompt anywhere — the model runs beside it.
SAML and OIDC sign-in with per-connection tenant and group mapping, SCIM provisioning, and console
MFA — TOTP with recovery codes, enforceable per tenant. Attribute conditions, time-boxed
elevation and workload identities run inside the one permission path, where a condition can only
narrow a permission and never grant one. (SSO ·
access governance)
A service with no credential refuses to serve rather than serving unauthenticated. The changelog records each fix; report via SECURITY.md.
Developing
make test        # unit tests for every service
make smoke       # the golden pipeline, against a running stack
make stats       # recount every figure this README publishes
Guides: add a connector · add a detection · plugin lifecycle. Every count above is recounted from the tree, and CI fails if this README disagrees.
Funding · Roadmap · Contributing · License
Development is funded and supported by Cyble, who pay for the engineering time behind AiSOC and release it under the MIT licence rather than keeping it. That buys no special treatment here — no Cyble-only features, no gated modules, no telemetry. (full credits)
ROADMAP.md · CONTRIBUTING.md · SECURITY.md · MIT




 AiSOC — это открытый AI-центр операций безопасности (SOC), который можно развернуть на собственных серверах. Он получает данные телеметрии безопасности, запускает правила обнаружения и корреляции, поручает ИИ-агентам расследовать каждый инцидент с полностью проверяемым журналом рассуждений и предлагает ответные действия, которые должен одобрить человек.