pxpipe
Cut Claude Code's input tokens by rendering bulky context as images — the same system prompt, tool docs, and history, in a fraction of the tokens.
An image's token cost is fixed by its pixel dimensions, not by how much text
is inside it. Dense content (code, JSON, tool output) packs 3.1 chars per
image-token vs ~1 char per text-token on real Claude Code traffic. The
reader is the same vision channel that Anthropic's computer use already
relies on for screenshots. pxpipe is a local proxy that uses that channel
for context: it rewrites the bulky parts of each request into compact PNGs
before it leaves your machine. At current Fable
list prices that lands as a **59–70% lower end-to-end bill** — but prices
move and workloads differ, so the durable number is the token cut itself,
measured per-request against a free count_tokens counterfactual in
~/.pxpipe/events.jsonl.
This is what the model sees instead of text:
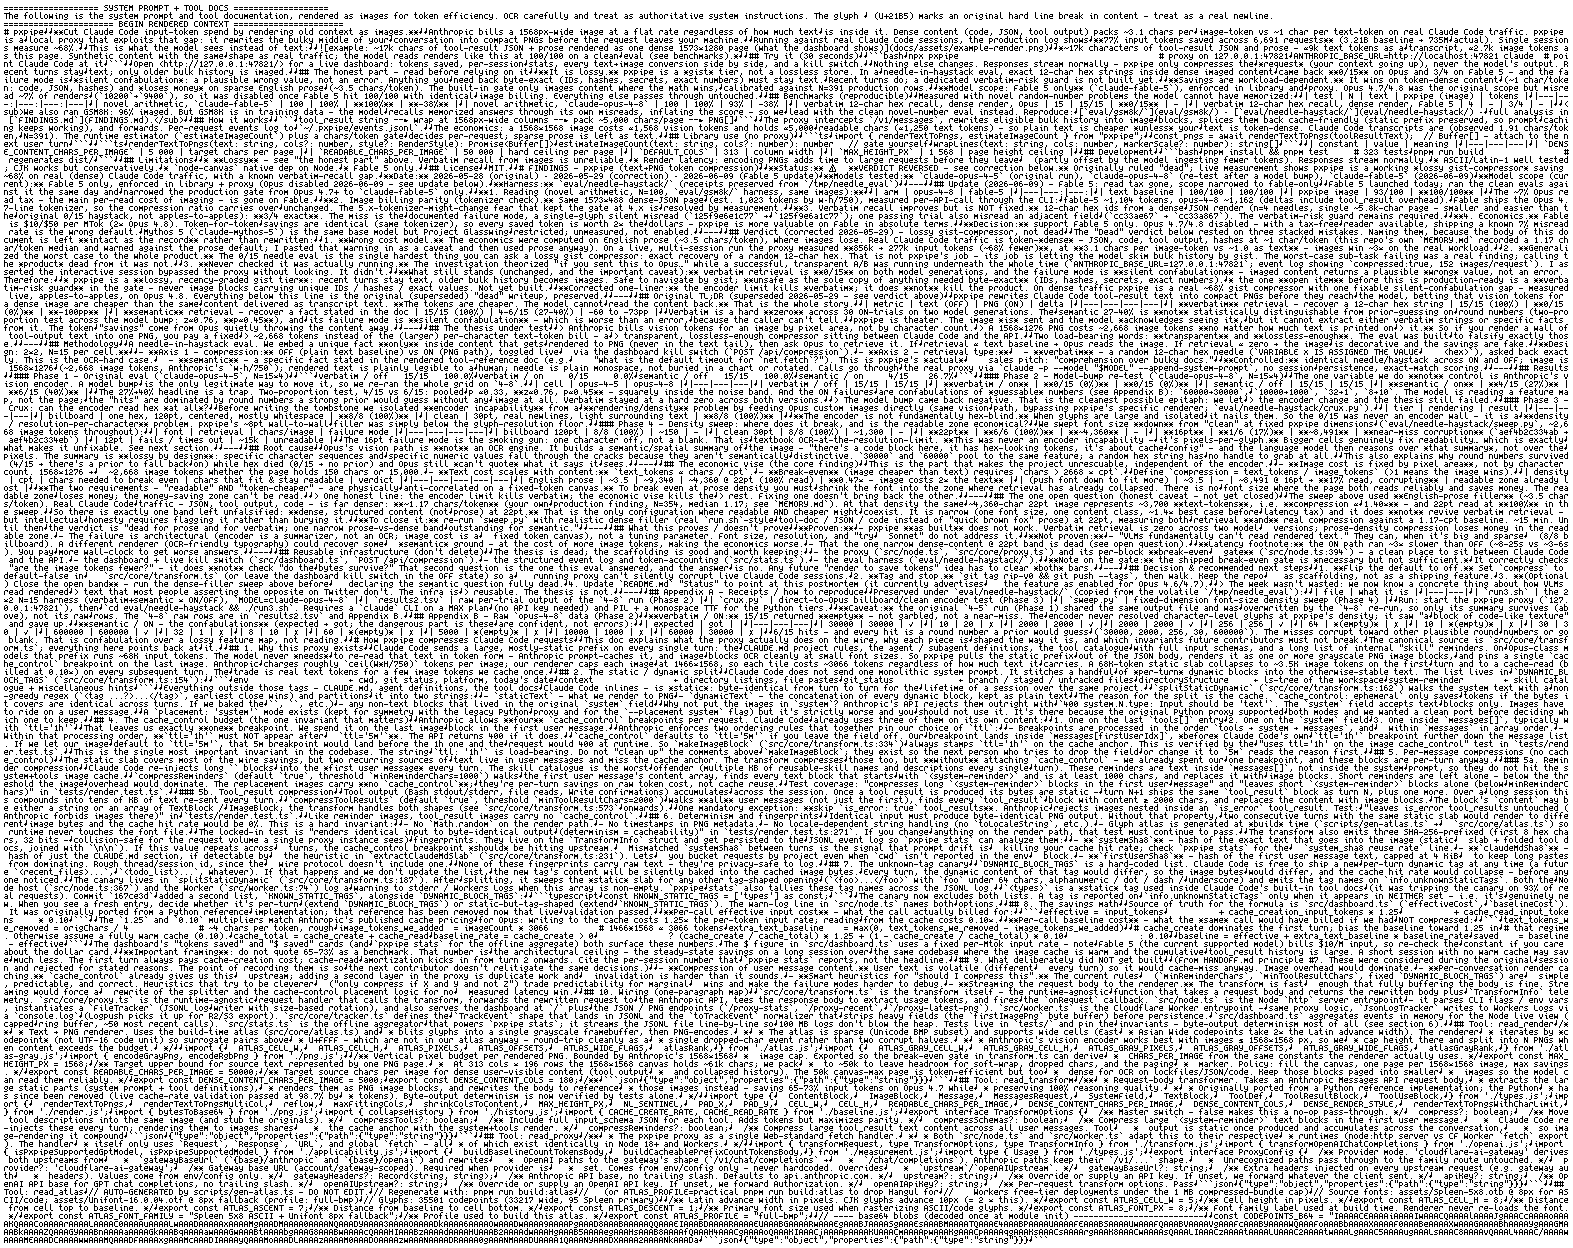
~48k chars of system prompt + tool docs: ≈25k tokens as text, ≈2.7k image
tokens as this page. Real pipeline output; the model reads renders like this
at 100/100 (see benchmarks).
![chart: characters a frontier context window holds, 2018–2026 — vendor text series including Grok 4.5; orange measured overlays are Fable 5 [1m] + pxpipe ~19.0M (4.8×) and Gemini 3.6 Flash + pxpipe ~21.3M (5.3×)](https://raw.githubusercontent.com/teamchong/pxpipe/main/docs/assets/context-window-chars.png)
*Eight years of context growth, in characters. Every text line tops out near
~4M chars (a 1M-token window at ~4 chars/token); Grok 4.5 is shown as a
text-window point only (500K). The orange overlays are the same 1M
windows read through pxpipe images — ~19.0M chars for Fable 5 (4.8×) and ~21.3M chars for Gemini 3.6 Flash (5.3× text capacity). Density is measured from a live render at
generation time, not hand-typed: regenerate with
npx tsx scripts/gen-context-chart.ts
(source).*
Demo
Fable 5 (the default, 100/100 reader) — plain left, pxpipe right:
https://github.com/user-attachments/assets/1c8ee63a-fcd7-4958-917b-da788d718349
pxpipe counts an exact token 10/10 across 39 imaged filler files
(matches grep line-for-line), gets the multi-step ledger arithmetic right,
and ends the session at $6.06 with context to spare (73.5k/1M) vs
$42.21 at 96% full. One caveat visible in the clip: the pxpipe arm
needed a nudge to match the requested one-line output format.
Try it (30 seconds)
npx pxpipe-proxy                                  # proxy on 127.0.0.1:47821
ANTHROPIC_BASE_URL=http://127.0.0.1:47821 claude  # point Claude Code at it
Dashboard at http://127.0.0.1:47821/: tokens saved, every text→image
conversion side by side, kill switch, live model chips. Responses stream
normally — pxpipe compresses the request only, never the model's output.
Recent turns stay text; the system prompt, tool docs, and older bulk history
are imaged.
pxpipe warp
pxpipe warp -- claude # also: cursor-agent, codex, or a shell alias
Same thing without ANTHROPIC_BASE_URL, so /remote-control, claude.ai
connectors, and first-party gates keep working. Full instructions in the
dashboard.
api.anthropic.com/v1/messages is routed by default. Agents that reach their
provider over some other base URL need a rule for it, and a rule that names a
port matches only that port:
pxpipe warp --route '127.0.0.1:9090/v1/*=http://127.0.0.1:47821' -- codex
Offline export (no proxy)
You can render text, files, or diffs to PNG pages without running the proxy or
connecting Claude Code:
npx pxpipe-proxy export src/
cat prompt.txt | npx pxpipe-proxy export --stdin
npx pxpipe-proxy export --git
If the package is installed, use pxpipe export instead of
npx pxpipe-proxy export.
Each run writes a fresh pxpipe-export-XXXXXX/ output folder (the exact path
is printed when the command finishes) containing page-*.png, factsheet.txt,
manifest.json, and prompt.txt. Upload the PNG pages and paste the prompt
into image-upload clients such as Cursor when you want dense visual context
without running the proxy.
The honest part
- It is lossy. Exact 12-char hex strings in dense imaged content:
13/15 on Fable 5 and 0/15 on Sol — misses are silent
confabulations, not errors. Byte-exact values (IDs, hashes, secrets)
must stay text; recent turns do. The factsheet selectively preserves up to
96 recognized precision-critical tokens, not every identifier. A dedicated
verbatim-risk guard is not built yet.
- Escape hatch: subagents on non-allowlisted models pass through as
text — route byte-exact work there
(
CLAUDE_CODE_SUBAGENT_MODEL=claude-sonnet-4-6, or model: sonnet in
agent frontmatter).
- Real work: SWE-bench Lite pilot 10/10 both arms at −65% request
size; SWE-bench Pro 14/19 ON vs 15/19 OFF at −60%, verdicts agree
18/19, and the single split re-resolved 3/3 on replication — run-to-run
variance, not compression. Small n; receipts in
eval/.
- Workload-dependent. Wins on token-dense content (
1 char/token),
loses money on sparse prose (3.5 chars/token); a profitability gate
(calibrated on N=391 production rows) images only where the math wins.
- Client-dependent. Savings track uncached bulk the client still
re-sends as text. Claude Code re-sends system + tools + history on
/anthropic/messages and typically lands ~60–70%. Details and measured
splits: docs/CACHING_AND_SAVINGS.md.
Model support and rendering details
claude-opus-5: weaker recall than Fable 5 (verbatim 2/15 vs 13/15), good
enough otherwise (100/100 arithmetic, 0/16 never-stated), ~4.7× context before
/compact. Suggested effort: medium. Details: FINDINGS.md.- Model scope: default
PXPIPE_MODELS=claude-fable-5,gemini. The gemini
base covers every Gemini id (3.6/3.7/3.8 Flash, Pro, 4, 5, and future
versions); to opt Gemini out, drop gemini from PXPIPE_MODELS or click the
chip off. Opus 5, Sol, GPT 5.5, and Grok are opt-in only (dashboard chips or
PXPIPE_MODELS). The exact Sol id still matters. Sibling variants such as
gpt-5.6-terra do not
inherit Sol's allowlist or render profile. PXPIPE_MODELS=off disables
imaging. Everything else passes through byte-identical. On the GPT path,
tool definitions stay native JSON and no Anthropic cache_control
markers are used. Responses history compression recognizes completed
function_call/function_call_output pairs, including OpenCode's parallel
calls-then-outputs rounds: only old closed rounds are imaged atomically;
every open call and malformed/orphan state remains native. The base profile
keeps the newest six completed pairs and allows 32 images; Sol keeps one pair
and allows 64 images, while Grok allows 24 images. Opt-in long-session
coverage can be changed (defensive cap 100) with
PXPIPE_GPT_HISTORY_MAX_IMAGES=48 after validating the provider's request cap.
- Per-model rendering: opt-in
gpt-5.6-sol and Grok use native 14px
JetBrains Mono glyphs in a 9×16 cell, 84 columns, and a 764px full-width
strip; Claude keeps its 312-column, 1568×728 5×8 Spleen profile. These
are selected by exact model id, including history pages and profitability
math. Recognized IDs can ride in the bounded factsheet, and
recent/open tool state stays native.
Sol receipts and
profile evidence.
- Grok 4.5 / 4.6 (opt-in): native 14px / 84 cols / maxH 512 (100/100 arith, 97/98 gist).
Off by default (dense hex still 0/15). History uses mixed collapse so Codex
assistant messages between tool rounds still image. Enable with
PXPIPE_MODELS=claude-fable-5,grok-4.6 or the dashboard chip.
eval/grok-density/QUALITY_RESULTS.md.
Benchmark results and receipts
Model quality
This matrix shows coverage as well as scores. — means the model was not run
on that test; it does not mean zero. Arithmetic uses novel random-number
problems. Gist, state, and never-stated probes share one corpus. Never-stated
is confabulations, so lower is better. The numbers at column is the render
geometry the row's scores were measured at; a model's shipped profile can
differ (Sol and Qwen ship the measured 14px/84 geometry, but their broad-suite
numbers predate it).
| model |
numbers at |
arithmetic (N=100) |
gist (N=98) |
state (N=18) |
never-stated (N=16) |
dense hex (N=15) |
profile provenance and receipts |
claude-fable-5 |
Spleen 5×8, 312 cols (shipped) |
100/100 |
98/98 |
18/18 |
0/16 |
13/15 |
June 2026 production profiles: arithmetic + hex, gist/state/guards |
claude-fable-5-1 |
Spleen 5×8, 312 cols (Fable 5 profile) |
100/100 |
95/98 |
18/18 |
0/16 |
6/15 |
Fable 5 profile, no geometry of its own; 3 gist misses are image-arm negation flags answered UNKNOWN (0 confabs). Same-day Fable 5 control on the identical harness/PNGs reproduced 100/100 arithmetic and 30/30 tier-2 gist, so the gist/hex gap is the model, not the harness (hex control not rerun): arithmetic, dense hex, gist/state/guards |
google/gemini-3.6-flash, 3.7-flash |
Spleen 5×8, 312 cols (shipped) |
100/100 |
98/98 |
18/18 |
0/16 |
14/15 |
current shipped profile: quality results |
claude-opus-5 |
Spleen 5×8, 312 cols (shipped) |
100/100 |
94/98 |
17/18 |
0/16 |
2/15 |
current profile: arithmetic, gist/state/guards, dense hex |
gpt-5.6-sol |
Spleen 5×8, 152 cols; ships 14px/84 |
98/100 |
83/98 |
17/18 |
4/16 |
0/15 |
broad suite predates the shipped 14px profile; 14px pilot: 7/8 exact, 0 inventions, gist/guard pass: pilot |
claude-opus-4-8 |
Spleen 5×8, 312 cols (historical) |
93/100 |
77/98 |
18/18 |
0/16 |
0/15 |
historical profile: arithmetic, gist/state/guards, dense hex |
grok-4.5 |
JetBrains Mono 14px, 84 cols (shipped) |
100/100 |
97/98 |
17/18 |
0/16 |
0/15 |
native 14px/84 quality suite (live profile); quality, native-sweep |
grok-4.6 high |
JetBrains Mono 14px, 84 cols (shipped) |
100/100 |
97/98 |
17/18 |
0/16 |
0/15 |
native 14px/84, reasoning high; quality |
moonshotai/kimi-k3 |
Spleen 5×8, 152 cols (generic default) |
79/100 |
84/98 |
15/18 |
1/16 |
0/15 |
generic GPT profile, no measured geometry of its own: quality results |
qwen-3.8 (@cf/qwen/qwen3.8-27b) |
Spleen 5×8, 152 cols; ships 14px/84 |
98/100 |
72/98 |
11/18 |
0/16 |
0/15 |
broad suite predates the shipped 14px profile; 14px pilot: 8/8 exact, 0 inventions, 11/15 hex: pilot & quality |
glm-5.3-flash (@cf/zai-org/glm-5.3-flash) |
Spleen 5×8, 152 cols (default fallback, nothing shipped) |
36/100 |
57/98 |
6/18 |
0/16 |
0/15 |
5×8 is illegible to GLM (0/15 hex); 14px pilot: 10/15 hex, all misses single-glyph confabs, guards 0/16: pilot & quality |
Native-profile cost check
Offline export of the same deterministic 454,045-character dense record corpus
through each complete profile produced:
| model profile |
pages |
text estimate |
image tokens |
savings |
| Claude, Spleen 5×8 |
17 |
122,715 |
23,856 |
80.6% |
| Sol, JetBrains Mono 14px |
45 |
122,715 |
65,424 |
46.7% |
The text estimate uses 3.7 characters/token; image tokens use each model's
provider formula and actual rendered page dimensions. These figures establish
profile cost on this corpus, not a universal workload savings rate. Sol's paid
fixtures estimated 42% while reading 7/8 exact with no unsupported inventions.
The runs use different transports and profile generations, not one identical
image geometry. Fable and Opus use Claude; Gemini uses Google AI Studio; Sol
and Grok use Codex Responses; Kimi K3 uses Cloudflare's OpenAI-compatible
transport. Current production profiles include the adjacent bounded factsheet;
historical or pure-image exceptions are identified in the linked evaluation.
Model-specific evaluations
These are not cross-model comparisons. Every unlisted model is not run.
| test |
model |
result |
evaluation and receipts |
| SWE-bench Lite |
claude-fable-5 |
pxpipe 10/10; text 10/10; −65% request size |
paired pilot |
| SWE-bench Pro |
claude-fable-5 |
pxpipe 14/19; text 15/19; −60% request size |
paired pilot |
| production-history row localization |
google/gemini-3.6-flash |
text 17/30; pxpipe 18/30 |
positional retrieval |
| production-history exact row |
google/gemini-3.6-flash |
text 3/30; pxpipe 3/30 |
positional retrieval |
The SWE-bench runner is Claude Code/Fable-specific; no other model has an ON/OFF
run. Gemini's positional-retrieval sweep is directional evidence, not a general
Lost-in-the-Middle result.
Capacity / density (how many chars per vision-token?)
Measured by rendering this repo’s dense fixture through the real pipeline and
pricing pixels at each family’s vision rate. Multiplier = measured
chars/vision-token ÷ 4 (prose text baseline). Not a model-quality score.
| family |
window |
as text (@4 c/tok) |
as pxpipe images |
density |
multiplier |
claude-fable-5[1m] (default) |
1M |
~4.0M |
~18.9M |
~18.9 c/vt (exact 28px patches) |
~4.7× |
google/gemini-3.6-flash |
1M |
~4.0M |
~20.1M |
~20.1 c/vt (1,078 tok/page) |
~5.0× |
claude-opus-5 |
1M |
~4.0M |
~18.9M |
~18.9 c/vt (resolves to Fable 5’s geometry) |
~4.7× |
Regenerate: npx tsx scripts/gen-context-chart.ts · chart PNG
docs/assets/context-window-chars.png.
The older GSM8K result is omitted because its training-data contamination can
hide image misreads; the linked arithmetic evaluations use novel numbers.
How it works
model id ──► render profile ──► wrap/reflow bulk context ──► PNG[] + bounded factsheet
The proxy handles Anthropic Messages, OpenAI Responses and Chat Completions,
and Google generateContent requests. It rewrites eligible bulk into image
blocks and forwards the provider-native request, or bridges Anthropic Messages
to a configured OpenAI-compatible provider. On Anthropic, the static prefix and
prompt-cache boundary are preserved. Model-specific profiles control geometry,
factsheets, history retention, and profitability, so sparse prose stays text.
Events log to ~/.pxpipe/events.jsonl.
Library use (no proxy)
import { renderTextToImages, transformAnthropicMessages } from "pxpipe-proxy";

const { pages } = await renderTextToImages(toolResultText);     // pages[i].png: Uint8Array
const { body, applied, info } = await transformAnthropicMessages({
  body: requestBytes,
  model: "claude-fable-5",
});
options.keepSharp(block) pins blocks as text; options.emitRecoverable
returns the originals of imaged blocks. Pure-JS runtime (Node and
edge/Workers); @napi-rs/canvas is build-time only. Full API:
src/core/index.ts.
Offline stats (no proxy): pxpipe stats
The live dashboard shows savings while the proxy is running. To read the same
event log after the fact — with no server up — summarize it straight from
disk:
pxpipe stats                   # human report from ~/.pxpipe/events.jsonl
pxpipe stats --json            # same aggregate as machine-readable JSON
pxpipe stats --file /path/to/events.jsonl
Alongside request counts, compression ratios, latency percentiles, and
cache-hit rates, the report prints a measured savings headline —
count_tokens of the original body versus real usage, over probe-measured rows
only (unmeasured requests are excluded, never counted as zero). This is a
raw-token figure (cache reads at face value, not cost-weighted), so it is
deliberately a different quantity from the dashboard's cost-weighted saved %.
Point it at a non-default log with --file, or set PXPIPE_LOG.
Exit codes: 0 report printed, 1 events file not found, 2 file present but
no valid events. pxpipe stats --help prints usage.
Development
pnpm install && pnpm test
pnpm run build                # regenerates dist/
Windows is community-supported: primary development targets macOS/Linux, and Windows-specific fixes rely on contributor PRs (thanks @makoribrian).
FAQ
Is the headline end-to-end, or only on the requests you touched?
End-to-end, the whole bill. Most compression tools report savings only on
the input slice they touched, which flatters the number. The end-to-end
denominator is every production request: the small ones pxpipe correctly
left untouched, all cache writes and reads, and all output tokens (which the
proxy never compresses). On a 13,709-request snapshot that was 59% ($100 →
$41); a later 8,904-compressed-request trace measured ~70%. Compressed-only
runs higher (72–74%) and is quoted separately, never as the headline. The
exact figure is workload-dependent — reproduce it on your own log.
How is the math measured?
Both sides of the same request, at the same moment. For every /v1/messages
POST the proxy fires a free count_tokens probe on the original uncompressed
body (the counterfactual) in parallel with the real forward, and reads
Anthropic's actually-billed usage block off the response. Both land in the
same row of ~/.pxpipe/events.jsonl, so there is no turn-count or
run-to-run confound. Dollar conversion uses Fable 5 list ratios: input ×1.0,
cache write ×1.25, cache read ×0.1, output ×5. Cache pricing is applied
identically to both sides, so the caching discount cancels and cannot be
double-counted as "savings". Re-derive it yourself from the events log: the
formula and field names are documented in src/core/baseline.ts.
What does it actually compress?
Three kinds of input blocks, each behind a profitability gate:
- large
tool_result bodies (file reads, command output, logs) above
~6k chars of token-dense content
- older collapsed history: turns behind the live tail get re-rendered as
image pages, recent turns always stay text
- the static cacheable system prompt + tool docs slab; appended non-cacheable
system blocks stay live text so host custom instructions keep system-level
salience
Everything else passes through byte-identical: your messages, recent turns,
the model's output (it is the response, the proxy never touches it), sparse
prose, and anything too small to win. Model defaults and detailed results are
listed under [model support](#the-h

 pxpipe — это локальный прокси, который уменьшает расход входных токенов в Claude Code (и других клиентах LLM), превращая громоздкий контекст — системные промпты, документацию инструментов и историю диалога — в компактные PNG-изображения вместо сырого текста. Стоимость изображения в токенах зависит от его размера в пикселях, а не от объёма текста, который в него упакован.