








claude-devtools README

The project's README from github.com/matt1398/claude-devtools. As one markdown file: README.md.

Your Claude is coding blind

claude-devtools

Your Claude is coding blind. See everything it did.

The debugging tool for Claude Code. Read session transcripts, inspect tool calls, track token usage — directly from the Claude Code logs on your machine.

GitHub stars  Website  Latest Release  Downloads  Platform  Mentioned in Awesome Claude Code


Download for macOS    Download for Linux    Download for Windows    Deploy with Docker    Install with Homebrew


Your browser does not support the video tag.


The Problem

Claude Code started hiding what it does.

Since v2.1.20, Claude Code replaced detailed output with opaque summaries. Read 3 files. Searched for 1 pattern. Edited 2 files. No file paths. No content. No line numbers. The community backlash was immediate.

But the problem goes deeper than collapsed file paths:

The only workaround is --verbose, which dumps raw JSON, internal system prompts, and thousands of lines of noise. There is no middle ground.

The Solution

claude-devtools is the debugging tool for Claude Code. It reads the Claude Code logs and session transcripts already saved to ~/.claude/ on your machine, and reconstructs everything.

What the terminal hides What claude-devtools shows
Read 3 files Exact file paths, syntax-highlighted content with line numbers
Searched for 1 pattern The regex pattern, every matching file, matched lines
Edited 2 files Inline diffs with added/removed highlighting
Three-segment context bar Per-turn token attribution across 7 categories with compaction visualization
Collapsed subagent output Full execution trees per agent with tool traces, tokens, duration, cost
Nothing about thinking Extended thinking content, fully visible
--verbose JSON dump Structured, filterable, navigable interface — no noise
Per-project Claude memory hidden in ~/.claude/projects/.../memory/ MEMORY.md rendered as a clickable index of layers; open any layer in your editor
Copy from terminal = wrapped lines, ANSI codes, broken Markdown Real selectable text, one-click copy on every message and code block

Zero configuration. No API keys. No wrappers. Works with every session you've ever run.

[!TIP] If claude-devtools saves you time debugging Claude Code, leaving a ⭐ on the repo is the single best way to support the project — it helps other developers find it.


Installation

Homebrew (macOS)

brew install --cask claude-devtools

Direct Download

Platform Download Notes
macOS (Apple Silicon) .dmg Download the arm64 asset. Drag to Applications. On first launch: right-click → Open
macOS (Intel) .dmg Download the x64 asset. Drag to Applications. On first launch: right-click → Open
Linux .AppImage / .deb / .rpm / .pacman Choose the package format for your distro
Windows .exe Standard installer. May trigger SmartScreen — click "More info" → "Run anyway"
Docker docker compose up Open http://localhost:3456. See Docker deployment

Key Features

Context Reconstruction

context

Per-turn token attribution across 7 categories — CLAUDE.md (global, project, directory), skills, @-mentioned files, tool I/O, thinking, team overhead, user text. See exactly what's in the context window at any point.

Terminal-Friendly Copy & Paste

Copying Claude Code output from the terminal mangles it — selection wraps at the terminal width, ANSI color codes leak into the clipboard, and code blocks lose their Markdown formatting. claude-devtools renders every message, tool call, and output as real selectable text with one-click copy on every code block, plus full-session export to Markdown / JSON / plain text.

Project Memory

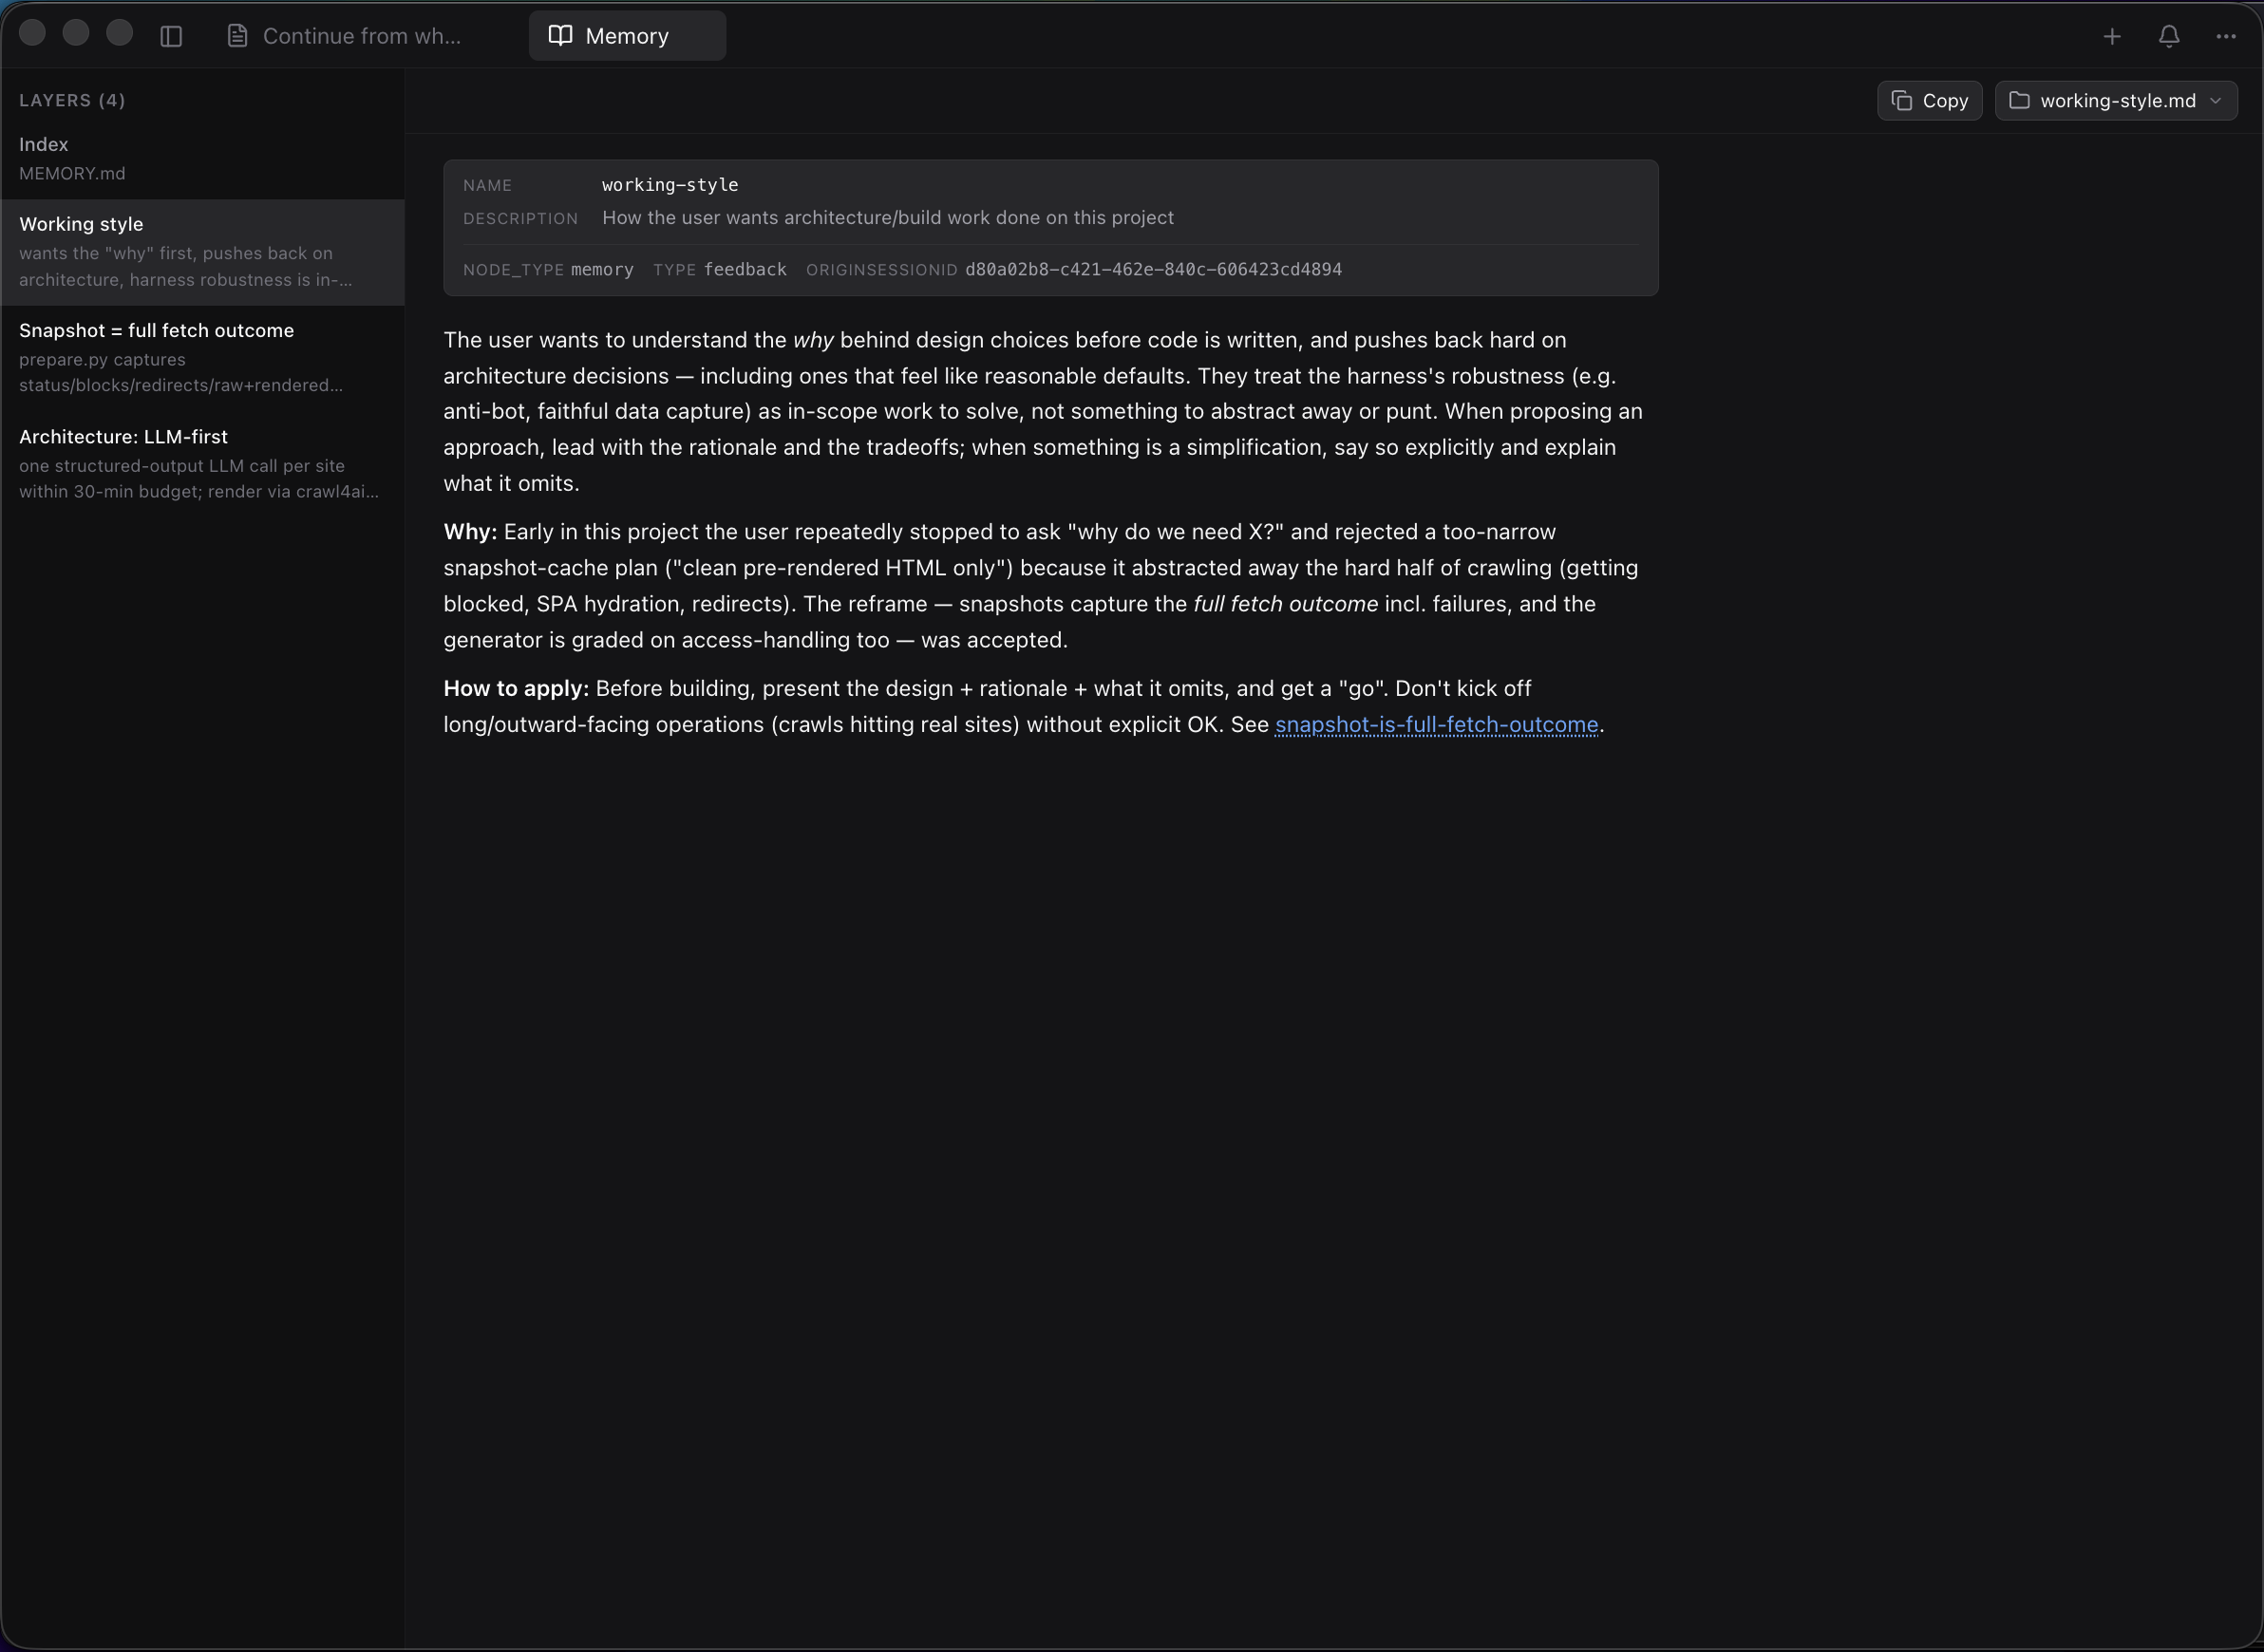
Project memory viewer with layer list, frontmatter card, and Open-in launcher

Claude Code stores per-project memory at ~/.claude/projects/<project>/memory/ — a MEMORY.md index plus one .md file per layer (working style, architecture notes, etc.). claude-devtools surfaces this as a sidebar entry that opens a dedicated pane: layer list on the left, full markdown rendering on the right with frontmatter shown as a metadata card, Obsidian-style [[wikilinks]] for cross-layer navigation, and an icon-driven "Open in…" launcher that hands any layer (or the whole memory folder) off to Finder/Explorer, Cursor, VS Code, Zed, Xcode, iTerm, Ghostty, Terminal — or copies the absolute path.

Team & Subagent Trees

Isolated execution trees per agent with tool traces, token metrics, duration, and cost. Nested agents render recursively.

Tool Call Inspector

Every tool call expanded with specialized viewers — syntax-highlighted Read calls, inline Edit diffs, Bash output, and full subagent trees.

SSH Remote Sessions

Inspect sessions on any remote machine over SSH. Reads ~/.ssh/config, supports agent forwarding and key auth.

Compaction Visualization

See the moment your context hits the limit. Visualizes how context fills, compresses, and refills — so you know exactly what was lost. (Why did Claude forget? — debugging walkthrough)

Notification Triggers

System notifications for .env access, tool errors, high token usage, and custom regex patterns on any field.

Command Palette & Multi-Pane Layout

Cmd+K for cross-session search. Open multiple sessions side-by-side with drag-and-drop tabs.

📖 Full documentation: claude-dev.tools/docs · Copy from Claude Code: claude-dev.tools/docs/copy-paste · JSONL format reference: claude-dev.tools/docs/jsonl-format · claude --verbose comparison: claude-dev.tools/docs/verbose-vs-devtools


Not a Wrapper

claude-devtools does not wrap, modify, or interfere with Claude Code. It reads session logs that already exist on your machine. Works with sessions from the terminal, IDEs, or any tool that uses Claude Code.


Docker / Standalone Deployment

Run without Electron — in Docker, on a remote server, or anywhere Node.js runs.

docker compose up
# Open http://localhost:3456

Or manually:

docker build -t claude-devtools .
docker run -p 3456:3456 -v ~/.claude:/data/.claude:ro claude-devtools
Variable Default Description
CLAUDE_ROOT ~/.claude Path to the .claude data directory
HOST 0.0.0.0 Bind address
PORT 3456 Listen port

The standalone server has zero outbound network calls. For maximum isolation: docker run --network none -p 3456:3456 -v ~/.claude:/data/.claude:ro claude-devtools. See SECURITY.md.


Development

Build from source

Prerequisites: Node.js 20+, pnpm 10+

git clone https://github.com/matt1398/claude-devtools.git
cd claude-devtools
pnpm install
pnpm dev
Command Description
pnpm dev Development with hot reload
pnpm build Production build
pnpm typecheck TypeScript type checking
pnpm test Run all tests
pnpm check Full quality gate (types + lint + test + build)

Community

Contributing

See CONTRIBUTING.md for guidelines. Please read our Code of Conduct.

Security

IPC handlers validate all inputs with strict path containment checks. File reads are constrained to the project root and ~/.claude. See SECURITY.md.

License

MIT


Star History

Star History Chart

Found this useful? ⭐ Star the repo — it’s the easiest way to help other developers discover claude-devtools.

claude-devtools (matt1398/claude-devtools)

Searching Database…

What is this?claude-devtools is a free, open-source debugging tool for Claude Code that reads the session logs already saved on your machine and reconstructs tool calls, thinking steps, subagent trees, token usage, and context window breakdowns in a visual desktop UI.
Is this a wrapper around Claude Code, or just a viewer for its logs?It is a standalone Electron desktop app that only reads existing ~/.claude/ session logs. It does not wrap, modify, or sit in front of Claude Code in any way.
Do I need an API key or any setup before using it?No. It works with zero configuration and no API keys, since it simply reads the session logs Claude Code already writes to ~/.claude/ on your machine.
Any install gotchas I should know about?The macOS build is unsigned, so on first launch you must right-click → Open instead of double-clicking, and the Windows installer may trigger a SmartScreen warning that you'll need to click through.
Does my session data leave my machine?No, the standalone server makes zero outbound network calls, and all file reads are strictly validated and constrained to the project root and the ~/.claude directory.
What does the Compaction Visualization feature show?It visualizes the moment your context hits its limit and how context fills, compresses, and refills, so you can see exactly what information was lost during compaction.
Can I inspect sessions running on a remote server?Yes, via SSH Remote Sessions it reads your ~/.ssh/config and supports agent forwarding and key auth to inspect Claude Code sessions on any remote machine.
How does it surface per-project Claude memory?It renders the MEMORY.md index from ~/.claude/projects/.../memory/ as a clickable sidebar pane with full markdown rendering, wikilink navigation between layers, and an 'Open in...' launcher for editors like VS Code, Cursor, and Zed.
Can it alert me to risky tool activity?Yes, Notification Triggers fire system notifications for things like .env file access, tool errors, high token usage, or custom regex matches on any field.
Creator
matt1398
Size
105.7 MB
Stars
4K
Age
8mo
Commits · 90 Days