hotpath-rs README

The project's README from github.com/pawurb/hotpath-rs. As one markdown file: README.md.

hotpath-rs logo hotpath - Rust Performance, CPU & Memory Profiler

GH Actions Latest Version Downloads Sponsor

A simple Rust profiler that shows exactly why your code is slow.

Performance feedback for developers and coding agents. Profile CPU, memory, async execution, SQL and HTTP calls, I/O streams, lock contention and channels. Built-in support for Prometheus metrics and Grafana dashboards.

Try the TUI demo via SSH - no installation required:

ssh demo.hotpath.rs

Or let your own AI agent configure profiling in a repo:

cargo install hotpath
hotpath init --agent claude # or --agent codex / --agent opencode

hotpath-rs is an easy-to-configure Rust performance profiling toolkit that shows exactly where your code spends time, burns CPU, and allocates memory.

It helps you distinguish between functions that are slow because they wait on I/O and those that are CPU-intensive. Instrument functions, channels, futures, streams, SQL queries, HTTP calls, and byte-level I/O to find bottlenecks and focus optimizations where they matter most. Get actionable insights into time, memory, and async data flow with minimal setup.

Explore the full documentation at hotpath.rs. See CONTRIBUTING.md for development setup and guidelines.

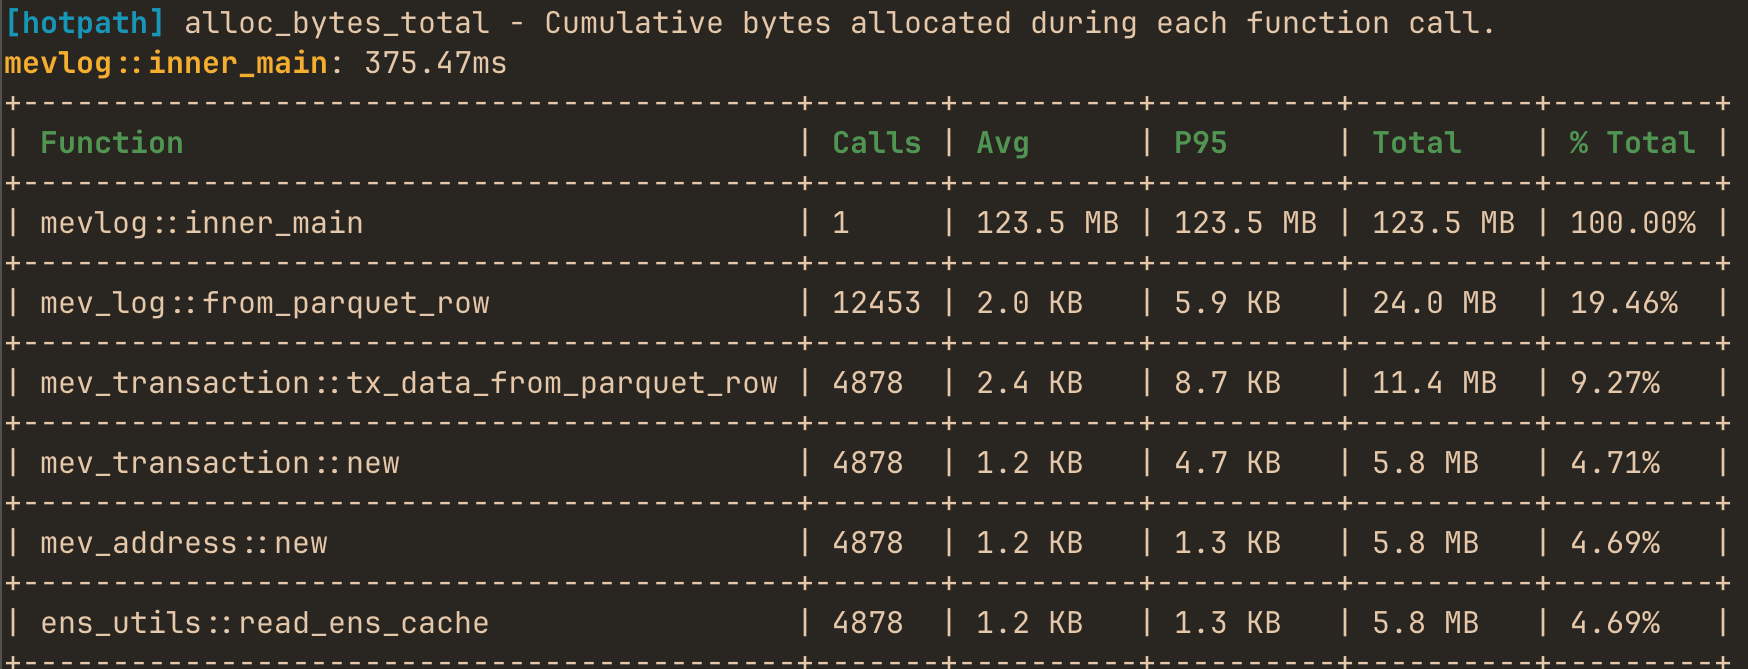
You can use it to produce one-off performance (timing, memory or CPU) reports:

hotpath alloc report

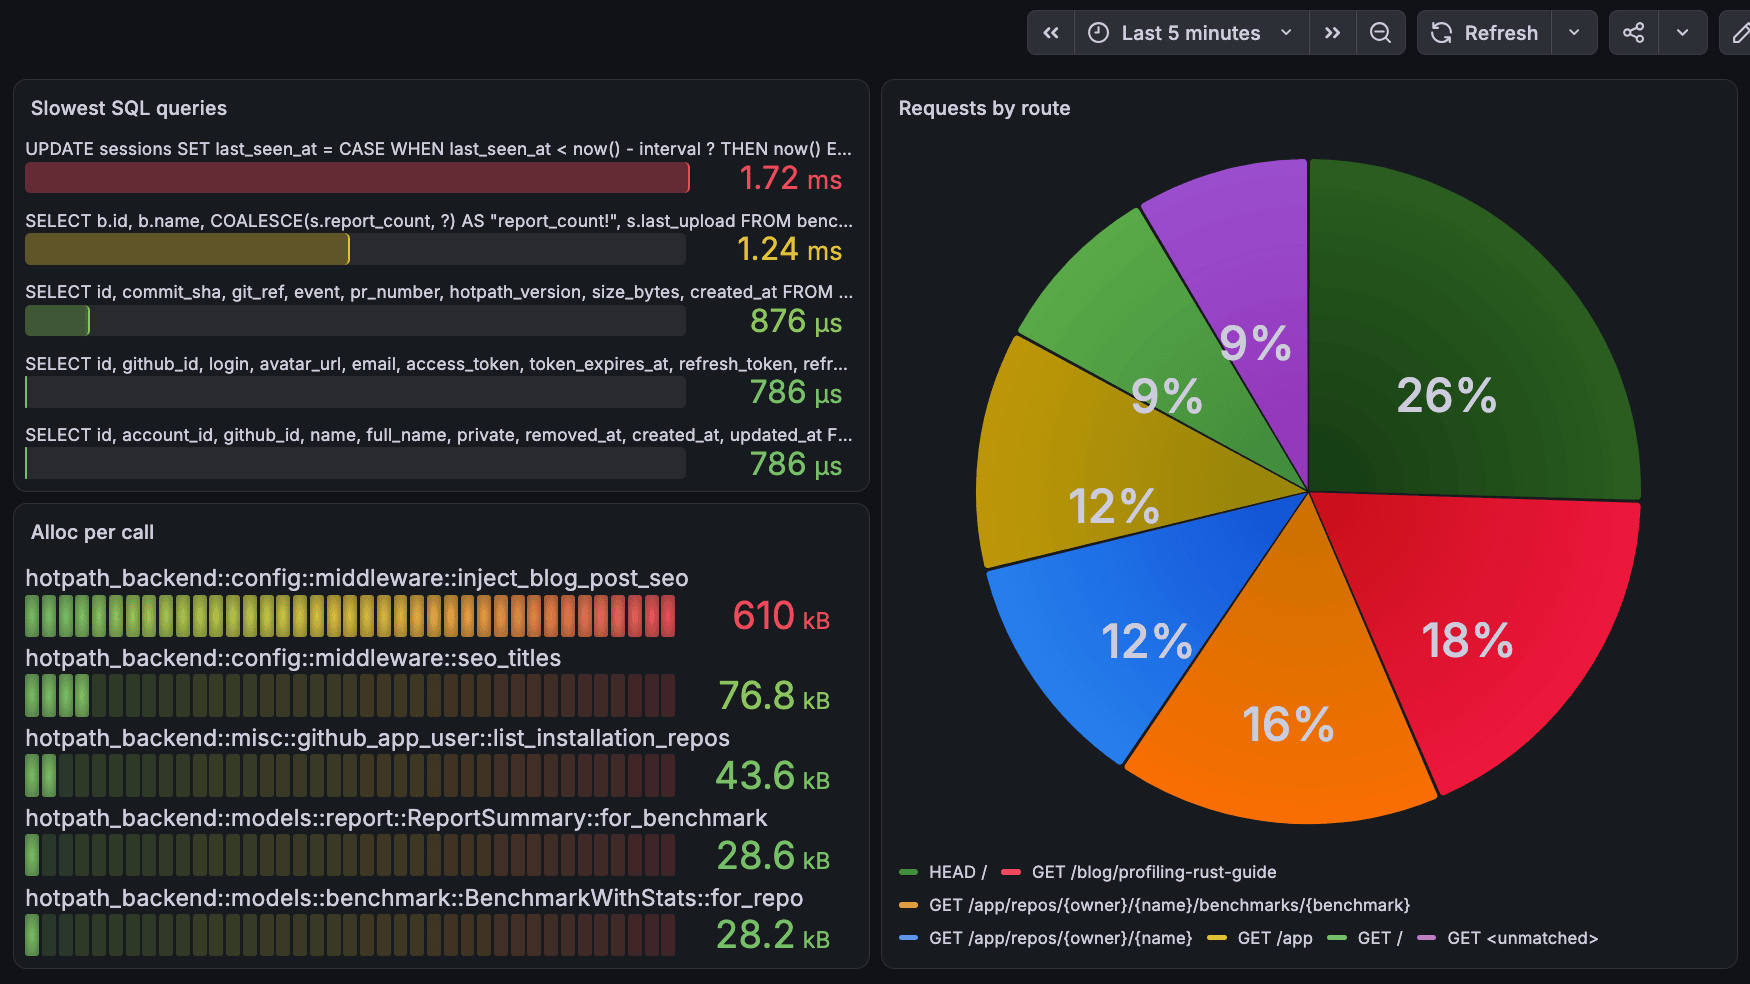
correlate all performance signals in Grafana with minimal profiling overhead:

Grafana dashboard built on hotpath-rs Prometheus metrics showing slowest SQL queries, per-function allocations and requests by route

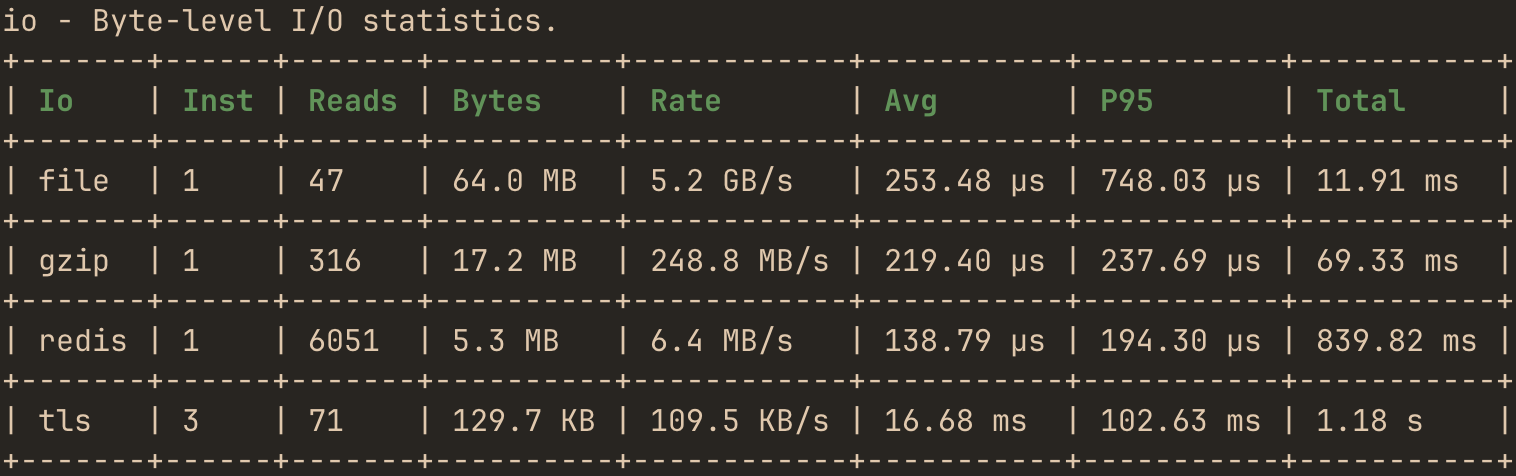
inspect throughput and latency of network, file or compression I/O streams:

hotpath-rs I/O profiling report showing per-stream read counts, bytes, transfer rate, average and P95 latency

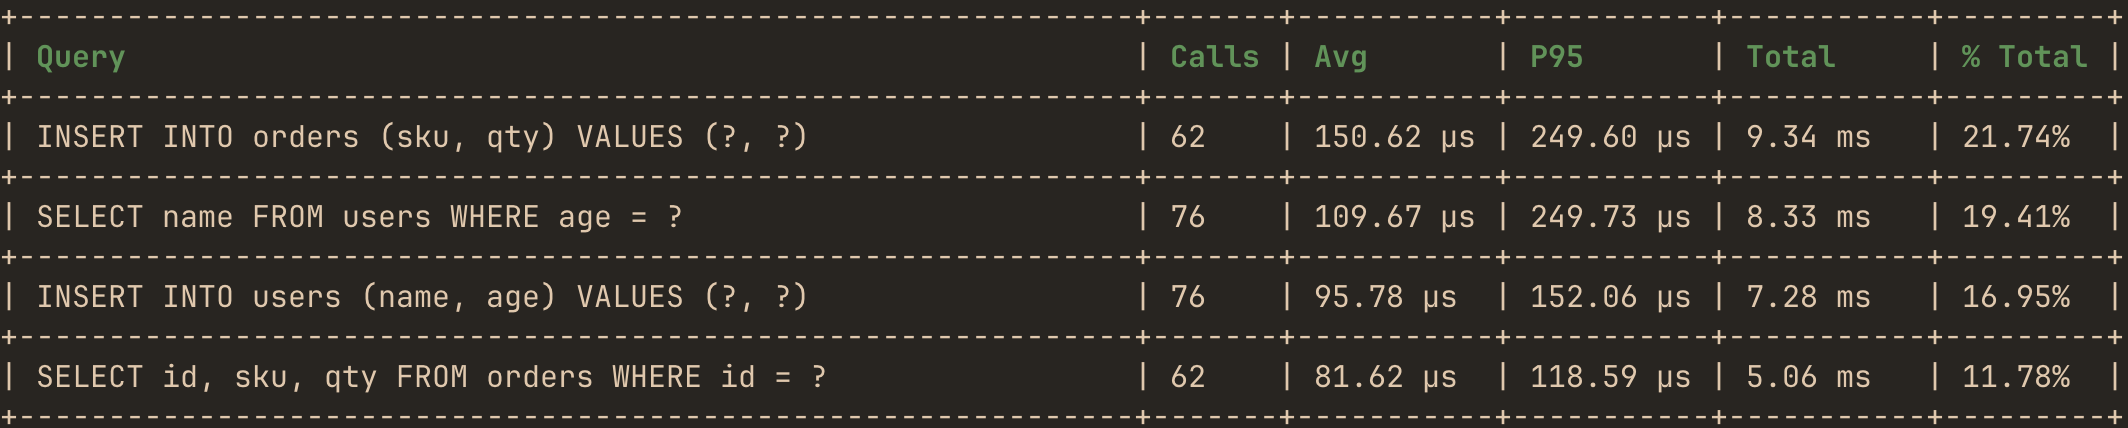
analyze SQL/HTTP calls performance with automatic source function attribution:

hotpath-rs SQL query profiling report showing per-query call counts, source function attribution, average and P95 execution time

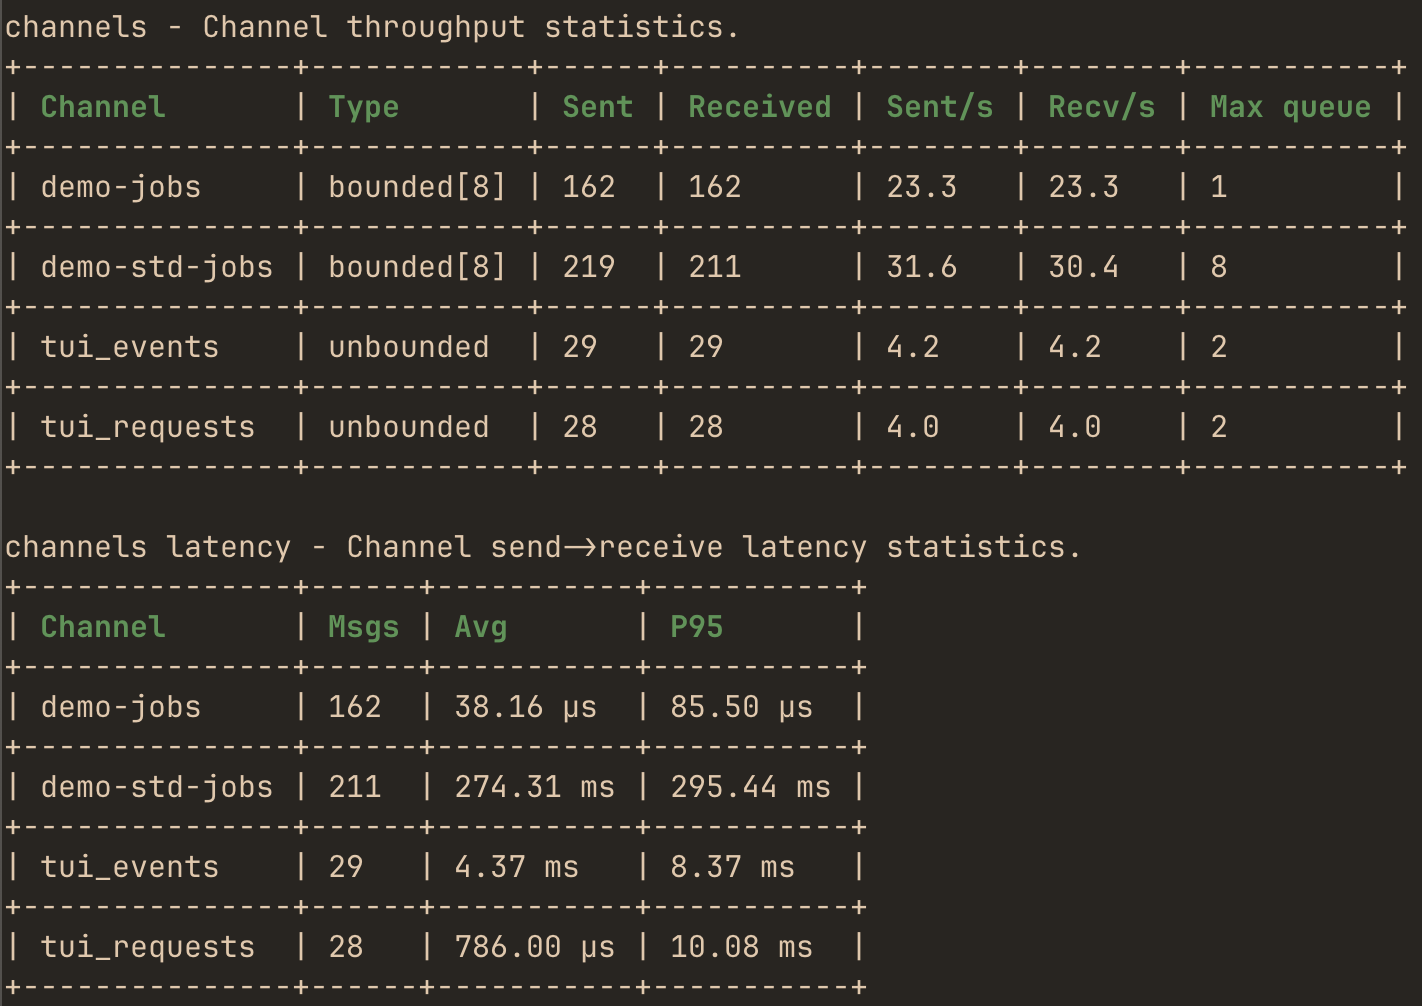
monitor throughput, performance and max queue depth of instrumented channels:

hotpath-rs channel profiling report showing throughput, send-to-receive latency and max queue depth per channel

or use the live TUI dashboard to monitor real-time performance and async data flow metrics with debug info:

https://github.com/user-attachments/assets/2e890417-2b43-4b1b-8657-a5ef3b458153

Features

Getting Started

The quickest way to set up hotpath is to let your own AI coding agent do it. Install the hotpath CLI and run init inside your project repo:

cargo install hotpath --version '^0.28'
hotpath init --agent claude # or --agent codex / --agent opencode

hotpath init downloads the hotpath_init agent skill from GitHub and starts an interactive Claude Code, Codex or OpenCode session with it as setup instructions. The agent inspects your project, adds the feature-gated dependency, instruments main and a starting set of functions, channels and locks, then verifies that everything compiles with profiling enabled and disabled. You review and approve each edit through the agent's regular permission prompts. Requires curl and the claude, codex or opencode CLI on PATH.

You can also use the skill directly, without the hotpath CLI: copy it to ~/.claude/skills/hotpath_init/SKILL.md and run /hotpath_init in a Claude Code session.

Manual installation

Add to your Cargo.toml:

[dependencies]
hotpath = "0.28"

[features]
hotpath = ["hotpath/hotpath"]
hotpath-cpu = ["hotpath/hotpath-cpu"]
hotpath-alloc = ["hotpath/hotpath-alloc"]
hotpath-prometheus = ["hotpath/hotpath-prometheus"]

This config ensures that the lib has no compile time or runtime overhead unless explicitly enabled via a hotpath feature. All the lib dependencies are optional (i.e. not compiled) and all macros are noop unless profiling is enabled.

Basic setup

You'll need only #[hotpath::main] and #[hotpath::measure] macros to get started:

#[hotpath::measure]
fn sync_function(sleep: u64) {
    std::thread::sleep(Duration::from_nanos(sleep));
    let vec1 = vec![1, 2, 3];
    std::hint::black_box(&vec1); // force mem allocation
}

#[hotpath::measure]
async fn async_function(sleep: u64) {
    tokio::time::sleep(Duration::from_nanos(sleep)).await;
}

// When using with tokio, place the #[tokio::main] first
#[tokio::main]
#[hotpath::main]
async fn main() {
    for i in 0..10000 {
        sync_function(i);
        async_function(i * 2).await;

        hotpath::measure_block!("custom_block", {
            std::thread::sleep(Duration::from_nanos(i * 3))
        });
    }
}

Now, run your program with hotpath (and optionally hotpath-alloc features):

cargo run --features='hotpath,hotpath-alloc'

On exit it will print a report with timings, memory allocations and thread usage metrics:

[hotpath] 1.20s | timing, alloc, threads

timing - Function execution time metrics.
+------------------------------+-------+----------+----------+----------+---------+
| Function                     | Calls | Avg      | P95      | Total    | % Total |
+------------------------------+-------+----------+----------+----------+---------+
| docs_example::main           | 1     | 1.20 s   | 1.20 s   | 1.20 s   | 100.00% |
+------------------------------+-------+----------+----------+----------+---------+
| docs_example::async_function | 1000  | 1.15 ms  | 1.20 ms  | 1.15 s   | 96.10%  |
+------------------------------+-------+----------+----------+----------+---------+
| custom_block                 | 1000  | 18.13 µs | 31.71 µs | 18.13 ms | 1.51%   |
+------------------------------+-------+----------+----------+----------+---------+
| docs_example::sync_function  | 1000  | 16.58 µs | 27.63 µs | 16.58 ms | 1.38%   |
+------------------------------+-------+----------+----------+----------+---------+

alloc - Cumulative allocations during each function call (including nested calls).
+------------------------------+-------+---------+---------+---------+---------+
| Function                     | Calls | Avg     | P95     | Total   | % Total |
+------------------------------+-------+---------+---------+---------+---------+
| docs_example::main           | 1     | 63.0 KB | 63.1 KB | 63.0 KB | 100.00% |
+------------------------------+-------+---------+---------+---------+---------+
| docs_example::sync_function  | 1000  | 12 B    | 12 B    | 11.7 KB | 18.58%  |
+------------------------------+-------+---------+---------+---------+---------+
| custom_block                 | 1000  | 0 B     | 0 B     | 0 B     | 0.00%   |
+------------------------------+-------+---------+---------+---------+---------+
| docs_example::async_function | 1000  | 0 B     | 0 B     | 0 B     | 0.00%   |
+------------------------------+-------+---------+---------+---------+---------+

threads - Thread CPU and memory statistics. (RSS: 7.8 MB, Alloc: 2.1 MB, Dealloc: 304.3 KB, Diff: 1.8 MB, 5/10)
+--------------+------+------+----------+----------+----------+
| Thread       | Max% | Avg% | Alloc    | Dealloc  | Diff     |
+--------------+------+------+----------+----------+----------+
| hp-functions | 1.8% | 1.2% | 1.8 MB   | 291.3 KB | 1.5 MB   |
+--------------+------+------+----------+----------+----------+
| main         | 6.3% | 5.1% | 367.8 KB | 9.9 KB   | 357.9 KB |
+--------------+------+------+----------+----------+----------+
| hp-threads   | 0.0% | 0.0% | 10.3 KB  | 3.0 KB   | 7.3 KB   |
+--------------+------+------+----------+----------+----------+
| hp-server    | 0.0% | 0.0% | 1.8 KB   | 56 B     | 1.7 KB   |
+--------------+------+------+----------+----------+----------+
| thread_5     | -    | -    | 640 B    | 24 B     | 616 B    |
+--------------+------+------+----------+----------+----------+

Full documentation

See the full docs and advanced config tutorials at hotpath.rs.

Read the complete guide to profiling Rust applications - a comprehensive overview of debugging performance issues in Rust.

hotpath Cloud

My long-term goal for hotpath-rs is to become the single place to understand all performance signals in a Rust application. From CPU and memory usage to locks, channels, and async execution, all the way up to SQL queries and HTTP/RPC calls.

I'm also building a hosted version that makes profiling reports easier to share, compare, and analyze across pull requests, deployments, and teams. Read more: https://hotpath.rs/cloud

Status

This project is under active development. Core public APIs are stable, but implementation details (JSON report formats, TUI/MCP internals, and advanced config options) may change between releases as the project evolves.

hotpath-rs (pawurb/hotpath-rs)

grafana
Searching Database…

What is this?hotpath-rs is a Rust performance profiler that shows exactly where your code spends time, burns CPU, and allocates memory, covering async execution, SQL/HTTP calls, I/O streams, and lock contention.
Is this a Rust library I add to my project, or a standalone tool?It is mainly a library: you add it as a feature-gated Cargo dependency and annotate functions with the #[hotpath::main] and #[hotpath::measure] macros. It also ships a companion hotpath CLI for setup and a live TUI dashboard, plus an MCP server for AI agents.
How do I get it running in my project?The recommended way is to install the hotpath CLI and run 'hotpath init' in your repo, which launches your AI coding agent (Claude Code, Codex or OpenCode) to add the dependency and instrument your code automatically. Alternatively, add the hotpath crate to Cargo.toml manually and apply the #[hotpath::main]/#[hotpath::measure] macros yourself.
Do I need an AI coding agent to use the automated setup?Only for the recommended AI-assisted setup, which requires curl and one of the claude, codex, or opencode CLIs on PATH. Manual installation just needs the Cargo.toml edit and the profiling macros, no agent required.
Does profiling add overhead if I leave it compiled in?No - all dependencies are optional and macros become no-ops unless a hotpath feature flag is explicitly enabled, so there's zero compile-time or runtime cost when disabled. Note the project is still under active development, so internals like JSON report formats and TUI/MCP details may change between releases.
Who is this built for?It's aimed at Rust developers (and their coding agents) who need to diagnose slow functions, memory leaks, async bottlenecks, or slow SQL/HTTP calls, rather than general app users.
Can I try hotpath without installing anything?Yes, the README offers a TUI demo accessible via SSH that requires no installation.
What does the built-in MCP server do?It exposes an MCP (Model Context Protocol) server so AI agents can query live profiling data directly, like timings, memory usage, and async metrics.
Which SQL and HTTP libraries can it profile?It profiles SQL queries for sqlx and Diesel, HTTP client calls for reqwest and ureq, and HTTP server routes for axum, with per-endpoint latency and error metrics.
Can it integrate with my existing monitoring stack?Yes, hotpath exports profiling metrics to Prometheus and lets you build Grafana dashboards to correlate all performance signals in one place.
Creator
pawurb
Size
46.9 MB
Stars
1.9K
Age
1y
Commits · 90 Days