pgbot
In-database observability for PostgreSQL.
One static binary connects read-only, reads Postgres's own statistics views,
and prints a findings-first health report — plus what changed since last time.
No agent, no external service, no write privilege anywhere in the path.





Quickstart ·
Install ·
Setup ·
Commands ·
CI ·
MCP ·
JSON contract ·
Troubleshooting ·
Provider notes
Status: beta. The --json contract is versioned (currently 1.2.0, JSON
Schema published in schema/) and breaking changes to it are
treated as breaking changes to the tool. The human-readable report is not
a stable interface — parse --json, not the terminal output.
Quickstart
curl -fsSL https://pgbot.dev/install | sh
pgbot inspect "postgres://pgbot_ro@host:5432/db"
Or set the connection once in the environment and drop the argument — handy for
CI and shells, and it keeps the password out of your history and ps:
export DATABASE_URL="postgres://pgbot_ro@host:5432/db"
pgbot inspect
pgbot reads the argument first, then $DATABASE_URL, then $PGBOT_DATABASE_URL,
then $PGSERVICE (if you keep your connections in a
connection service file,
just export PGSERVICE=mydb and drop the argument too).
(Shell note: export DATABASE_URL="…" — no $ on the left, no spaces around =.)
Everything pgbot takes from the environment fits in one block — the connection,
and (only if you want the optional ask/explain AI layer) one model key:
export DATABASE_URL="postgres://pgbot_ro:…@host:5432/db?sslmode=require"

# optional, for `pgbot ask` / `pgbot explain` — one of:
export OPENAI_API_KEY=sk-…        # → OpenAI (gpt-5.6-terra by default)
export GEMINI_API_KEY=…           # → Google Gemini (AI Studio key)
export ANTHROPIC_API_KEY=…        # → Anthropic (claude-opus-5 by default)
export XAI_API_KEY=…              # → xAI (grok-4.6 by default)
# …or any OpenAI-compatible endpoint, local ones included — see "explain — optional AI layer"
Everything else — inspect, queries, indexes, MCP, CI — is fully
deterministic and needs no key; nothing leaves your machine. Provider
pinning and model/endpoint overrides: the AI layer.
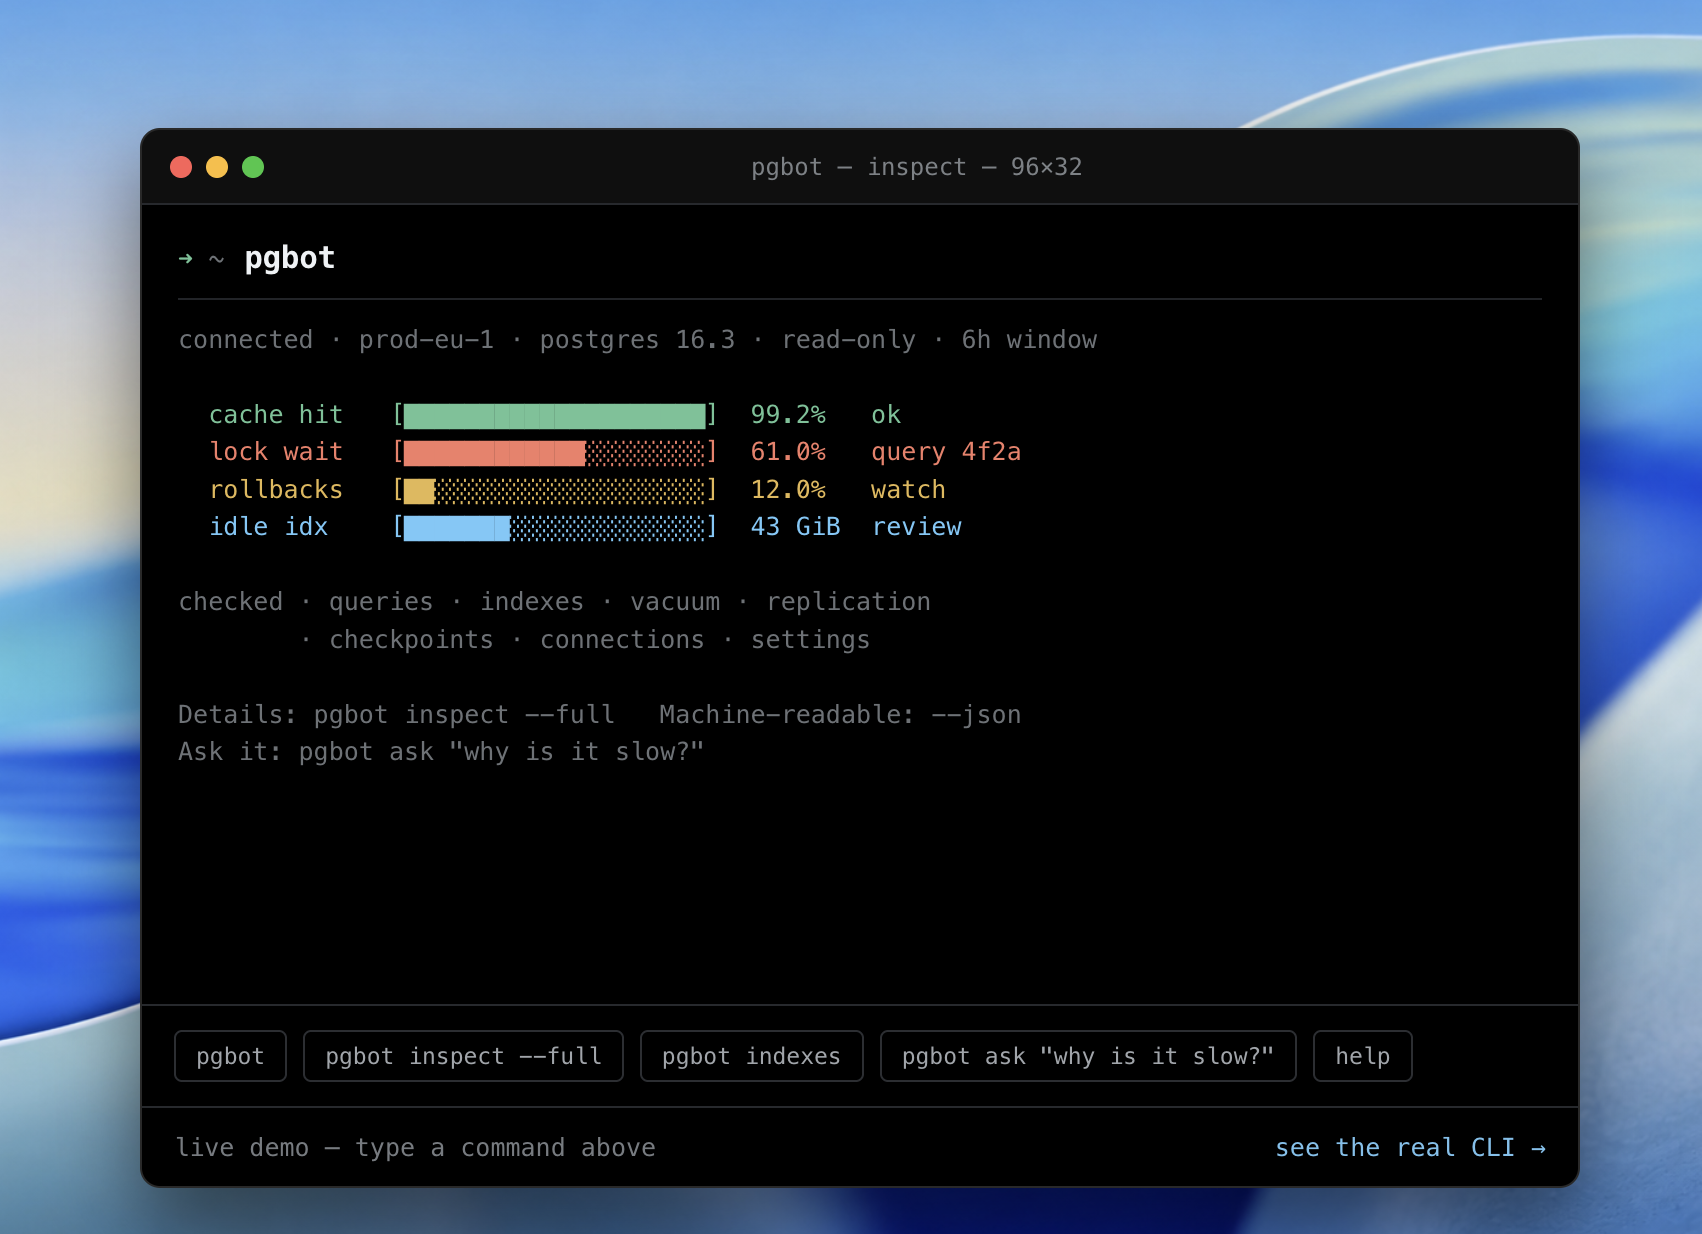
connected · db.example.com · postgres 17.4 · read-only · 6h20m window

  cache hit  [████████████████████]  99.4%     ok
  lock wait  [████████████░░░░░░░░]  61.0%     query 4f2a
  rollbacks  [██░░░░░░░░░░░░░░░░░░]  12.0%     watch
  idle idx   [██████░░░░░░░░░░░░░░]  18.0 GiB  review

checked · queries · vacuum · replication · checkpoints
        · connections · settings · deadlocks

Database health: 82/100

CRITICAL
● transaction-id age 1.8B — 84% toward wraparound

WARNING
● orders queries 3.2× slower (8 → 26 ms mean)
● 3 unused indexes consume 18 GB
● connection usage reached 87%

Details: pgbot inspect --full   ·   Machine-readable: --json
Ask it: pgbot ask "why is it slow?"
The default report is a graded read: a four-row gauge strip of vital signs
(cache hit, lock wait with the culprit query, rollbacks, idle index bytes as a
share of the database), a checked line naming the subsystems that came back
clean (a tool that names what it verified reads like a colleague who looked,
not an alarm), a health score, then findings bucketed CRITICAL / WARNING /
NOTE. pgbot inspect --full adds a subsystem status board plus
the section tables and per-finding caveats; focused commands (indexes,
queries, tables, vacuum) each drill into one signal; pgbot ask "…" and
pgbot explain put a plain-language AI reading on top of the same findings.
--json is the complete, versioned contract for agents and scripts.
$ pgbot ask "what's wrong?"

Your database is mostly healthy.

1 critical issue:
orders queries became 3.2× slower in the last 6 hours.

Likely cause:
sequential scans increased after the orders table grew 18%.

Recommended:
review an index on customer_id + created_at.
Why pgbot
|
|
| Read-only by role, not by flag |
The guarantee is a pg_monitor login role with no write grants. Session pinning (default_transaction_read_only, statement_timeout=15s, lock_timeout=2s) and BEGIN READ ONLY are defence in depth on top of it. |
| It remembers |
Every run writes a local baseline, so from the third run on it tells you what changed and why it matters — a query that got slower, a table that started sequential-scanning, an index that stopped being used. |
| Findings are deterministic |
Every finding is computed in Go from SQL. The optional AI layer explains findings; it never generates them. |
| Nothing to deploy |
One static binary. No collector, no time-series database, no service to run. |
| Built for agents |
--json is a versioned, PII-free contract; pgbot mcp exposes the same findings over the Model Context Protocol, with a skill and a Claude Code plugin on top. |
How it compares to pganalyze, PMM, pgwatch
pgbot is a point-in-time diagnostic you run, not a monitoring platform you
operate. If you want dashboards, alerting, long retention, and multi-host
rollups, run pganalyze / Percona PMM / pgwatch — pgbot doesn't replace them.
Reach for pgbot when you want an answer in ten seconds without deploying
anything, when you're triaging a database you don't own, or when an AI agent
needs structured Postgres findings it can reason over.
Requirements
- PostgreSQL 14–18 (16–18 fully supported, 14–15 best-effort); collectors
degrade rather than fail on older feature sets — see
Version support.
- A login role holding
pg_monitor — see
Setup.
pg_stat_statements for the queries section (optional; pgbot prints the
provider-specific install steps when it's missing).advise additionally needs the hypopg
extension and PostgreSQL 16+.- Linux, macOS, Windows — amd64 and arm64.
See it
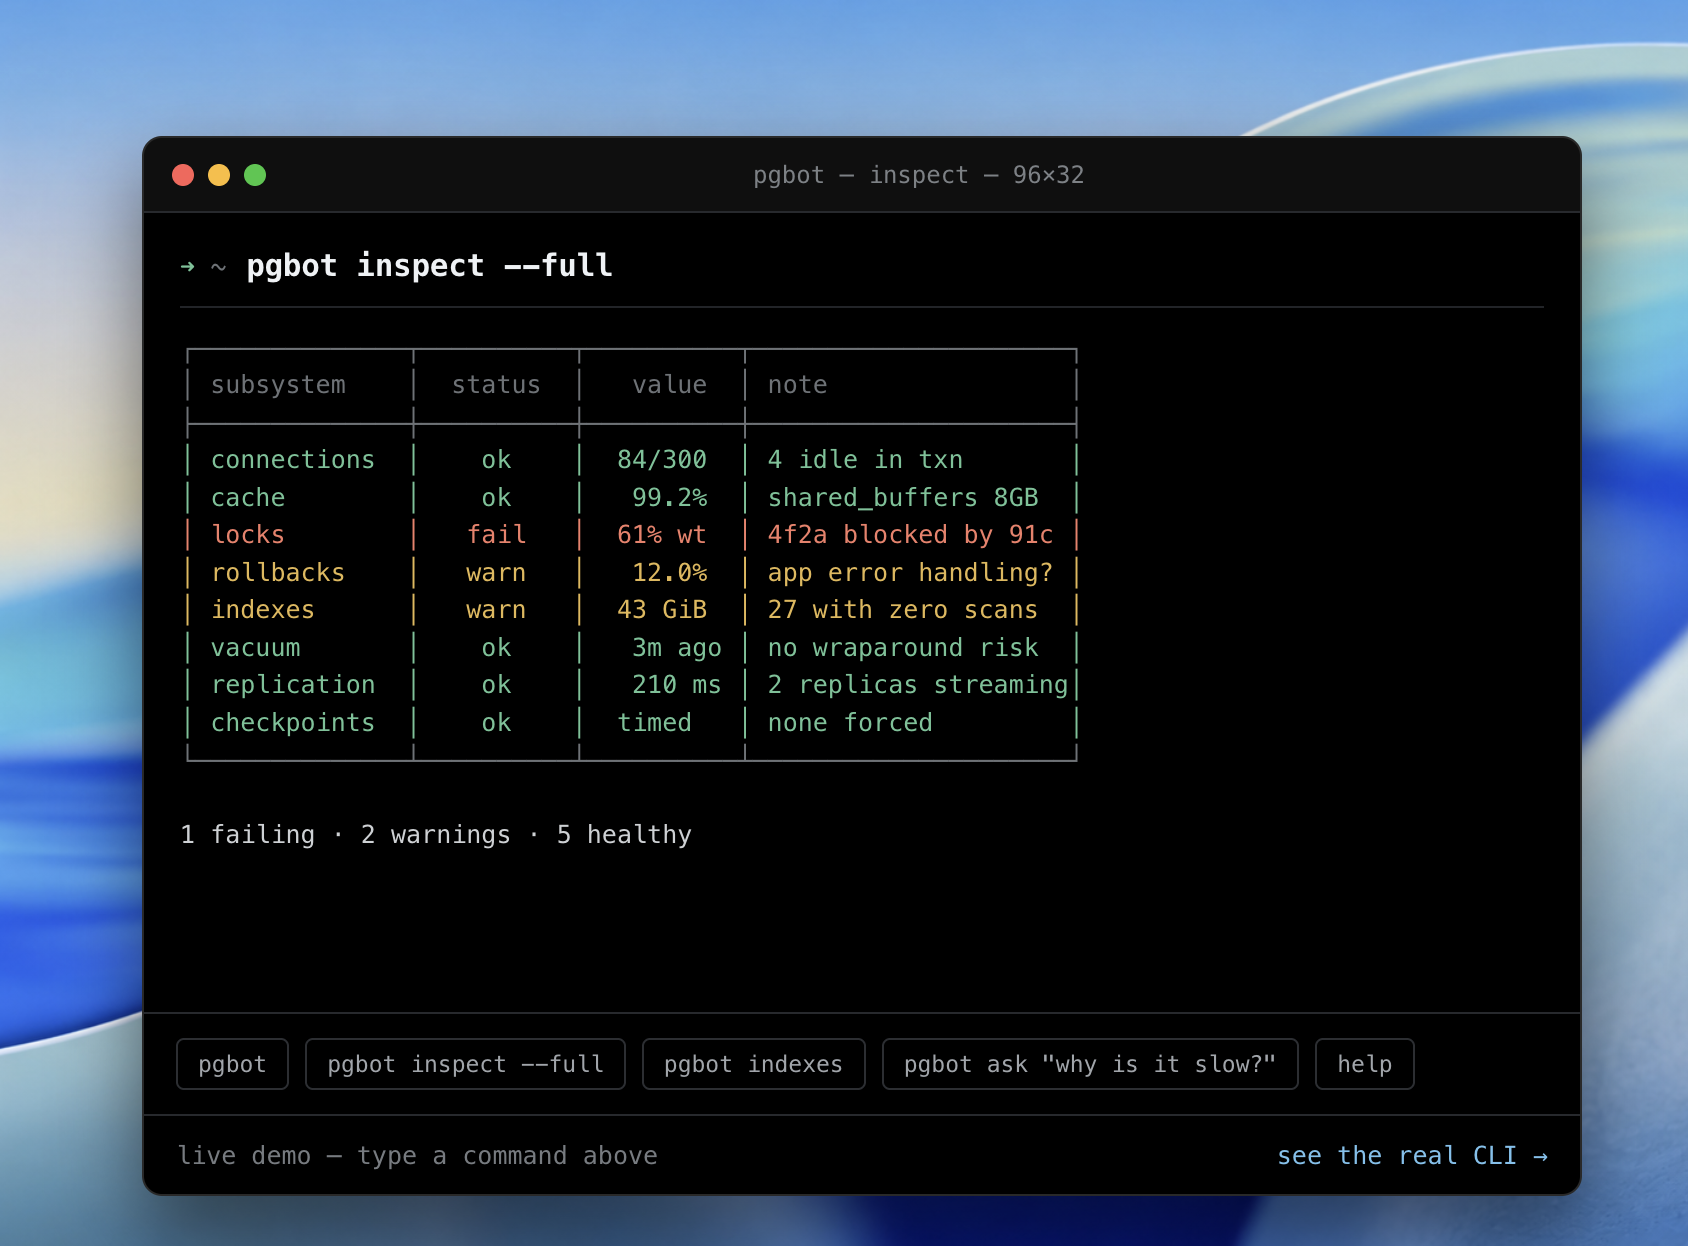
pgbot inspect --full — a subsystem status board (one row per subsystem,
colored ok / warn / fail), followed by the detailed section tables.
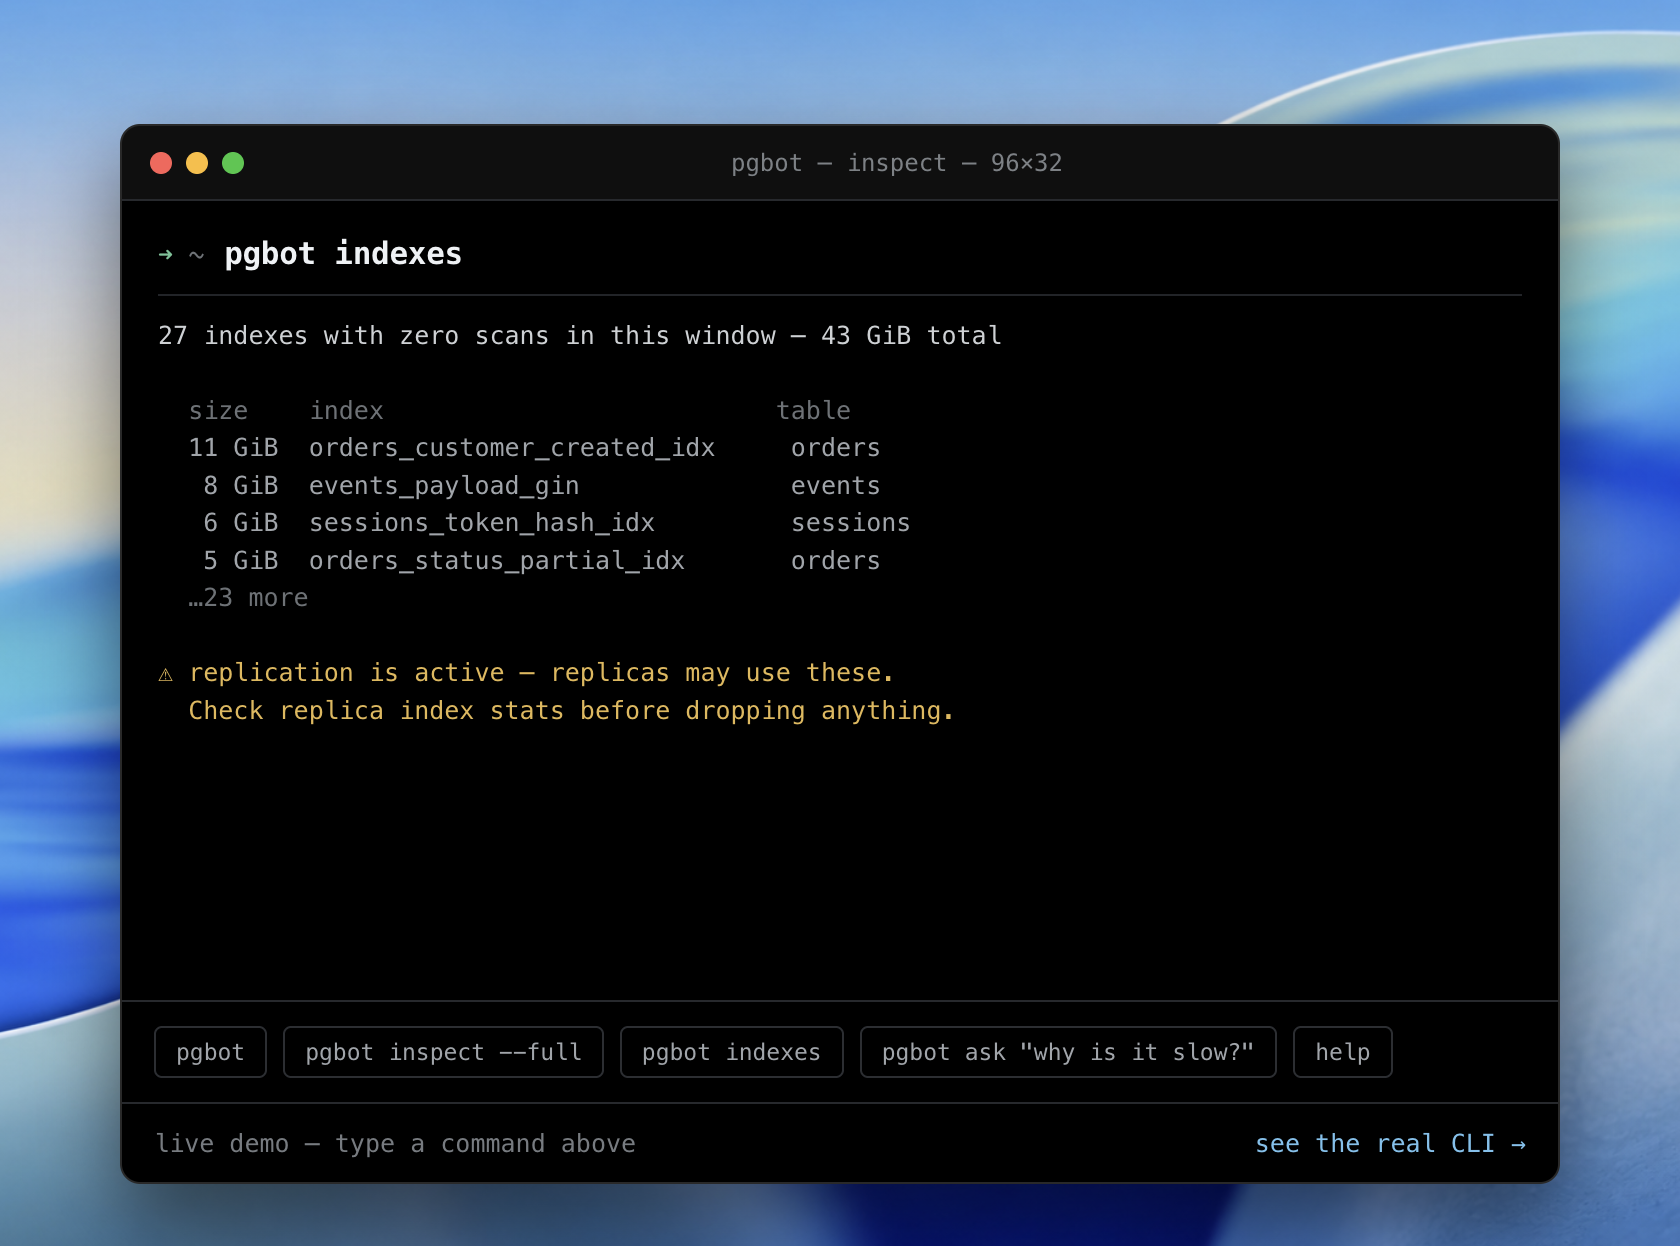
pgbot indexes — zero-scan indexes with sizes, and the caveat that matters:
on a primary those scan counts are per-node, so a replica may still be using an
index that looks unused here. It tells you what not to drop.
pgbot queries — the top statements from pg_stat_statements, ranked by
total execution time (the query quietly eating your database) with a share
column for each query's slice of total time. Add --by-calls to rank by call
count instead — a cheap query run a million times can outweigh an expensive one
run twice. Transaction-control and session-SET noise is filtered out.
$ pgbot queries "$DATABASE_URL"
  total  share  calls  mean       query
  4h11m  61.0%  812.4k 18.55 ms   SELECT * FROM orders WHERE user_id = $1 AND …
  22m3s  17.8%  1.3k   1.02 s     SELECT count(*) FROM events WHERE created_at …
  15m2s  12.0%  99.8k  9.04 ms    INSERT INTO audit_log (actor, action, …) VAL …
pgbot vacuum — autovacuum health per table: dead tuples, dead-tuple ratio,
when autovacuum last ran, and a computed due? — whether the table's dead tuples
have passed Postgres' default autovacuum trigger (50 + 20% of live rows). Rising
dead tuples with due? yes and no recent run is autovacuum falling behind, the
early signal for bloat and, eventually, wraparound risk.
$ pgbot vacuum "$DATABASE_URL"
  table               live   dead   dead%  last autovacuum  due?
  public.demo_events  42.9k  33.8k  44.1%  4m ago           yes
  public.churny       5.0k   10.0k  66.7%  never            yes
pgbot tables — the largest tables by total size (heap + indexes + TOAST),
each with row count, dead-tuple ratio, and sequential-vs-index scan counts. It's
storage accounting and a missing-index radar: a large table with heavy seq scans and few idx scans is a likely index candidate.
$ pgbot tables "$DATABASE_URL"
  size      rows   dead%  seq scans  idx scans  table
  38.7 GiB  19.7M  8.3%   1.5k       112.3M     public.performance_events
  20.0 GiB  1.3M   10.8%  2.5M       121.6M     public.events        ← 2.5M seq scans
  7.1 GiB   5.6M   0.0%   5.0k       46.6M      public.log_entries
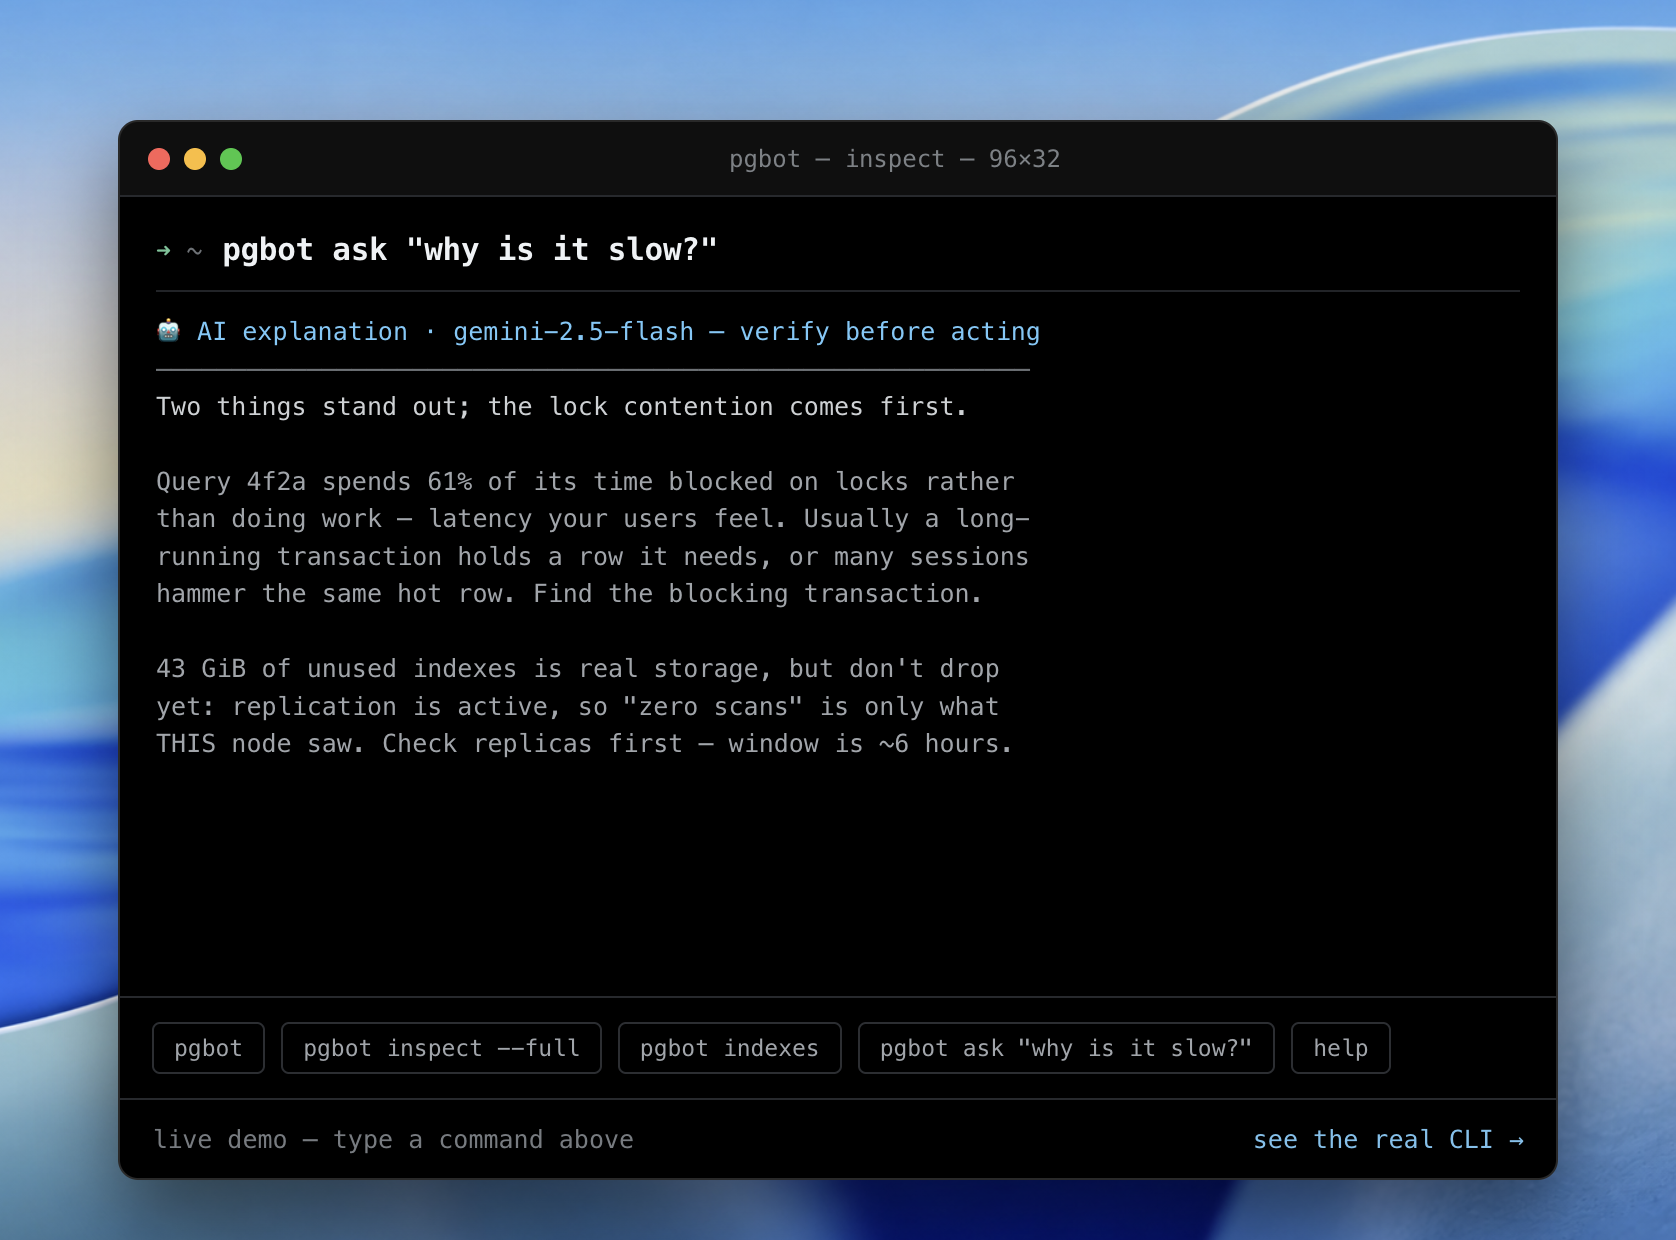
pgbot ask "why is it slow?" — a plain-language reading of the same
deterministic findings. It leads with the lock contention and refuses to
recommend dropping the indexes because replication is active — the caveat is
carried into the advice, not lost.
Commands and flags
Every command takes the connection the same way — an argument, $DATABASE_URL,
$PGBOT_DATABASE_URL, or $PGSERVICE.
| Command |
What it does |
inspect |
the full findings-first health report (--full for the section tables) |
lint |
schema-only check, safe on an empty CI database (inspect --profile=schema --no-store) |
init |
generate the read-only role setup SQL — nothing is executed (--verify checks an existing role) |
diff |
compare two baseline snapshots offline |
why |
explain a regression from baseline history: symptom ← mechanism ← antecedent, with numbers and onset times (offline; --duration 10s adds a live wait diagnosis) |
indexes · queries · tables · vacuum |
drill into one signal |
logs |
the server log over SQL — newest entries or --live follow (experimental) |
waits |
sample where database time goes — wait classes, blockers, contention (experimental) |
erd |
the schema as an ER diagram, drawn in the terminal (--mermaid for GitHub) |
activity |
live sessions right now — PIDs, ages, waits, and what each is running |
report |
the full inspection as one self-contained HTML page (pgbot report > report.html) |
advise |
planner-validated missing-index suggestions (needs hypopg) |
ask "…" · explain |
a plain-language AI reading of the same deterministic findings |
explain-finding <id> |
the catalogue page for a finding, offline |
mcp |
serve the findings to an AI agent over MCP |
config · baselines |
manage .pgbot.toml and the local baseline store |
Key inspect flags:
| Flag |
|
--json · --format=text|json|sarif|junit|prometheus |
output format; SARIF uploads to the GitHub Security tab |
--fail-on=critical|warn|info|none |
the severity that makes the exit code non-zero (the CI gate) |
--profile=full|schema |
schema runs only catalog-derived findings — safe on an empty CI database |
--fail-on-new <base.json> |
act only on findings not already in a base report (migration PRs) |
--all-databases |
inspect every database in the cluster; cluster-wide findings reported once |
--config <path> |
a .pgbot.toml for thresholds, severity remaps, and [[ignore]] rules |
Exit codes are a scriptable contract: 0 clean · 1 warn · 2 critical · 3
connection/execution failure · 64 usage error. Suppressed and pre-existing
findings never move them.
Install
| Method |
Command |
| npx (no install) |
npx @pgbot/cli inspect "$DATABASE_URL" |
| Script (cosign signature + checksum) |
curl -fsSL https://pgbot.dev/install | sh |
| Homebrew |
brew install pgrundev/tap/pgbot |
| Arch User Repository |
yay -S pgbot-bin |
| Go |
go install github.com/pgrundev/pgbot/cmd/pgbot@latest |
| Docker |
docker run --rm ghcr.io/pgrundev/pgbot inspect "$DATABASE_URL" |
| Windows / manual |
download the archive for your OS/arch from Releases (Linux/macOS .tar.gz, Windows .zip) |
npx @pgbot/cli fetches the prebuilt binary for your platform from npm (shipped as
an optionalDependency, so only the matching one installs) and runs it — nothing to
install, works with npm ci --ignore-scripts. It installs the pgbot command
(npm i -g @pgbot/cli). The package is scoped: the bare name pgbot is
blocked by npm's package-name-similarity rule (too close to got), so
npx pgbot returns E404 — use npx @pgbot/cli.
Homebrew installs from the pgrundev/homebrew-tap
tap; the formula is regenerated by every release and pins the SHA-256 of each
platform's release archive. macOS (Intel/Apple Silicon) and Linux (x86_64/arm64).
Against a remote/managed database (RDS, Neon, Supabase, …) the container needs
no special networking — it reaches the host directly. Pass the DSN by
environment, not as an argument, so the password stays out of ps and your
shell history:
export DATABASE_URL="postgres://pgbot_ro:…@yourdb.example.com:5432/db?sslmode=require"
docker run --rm -e DATABASE_URL ghcr.io/pgrundev/pgbot inspect
Use a pg_monitor role, not a superuser. (For a database in a local container,
see Postgres in Docker — the networking differs.)
What each path verifies. npm is the convenient path: the packages carry
registry integrity hashes and npm provenance, a verifiable link to the GitHub
Actions workflow that built them — that attests where the package came from, not
that the artifact was signed. install.sh is the verified path: releases ship
SHA256 checksums signed with cosign (keyless, via GitHub Actions OIDC), and the
script verifies that signature when cosign is on your PATH and always verifies
the checksum. For the strongest guarantee, require the signature:
PGBOT_REQUIRE_SIGNATURE=1 curl -fsSL https://pgbot.dev/install | sh
PGBOT_REQUIRE_SIGNATURE=1 hard-fails if cosign is missing or the check doesn't
pass. To verify a release by hand:
cosign verify-blob --bundle checksums.txt.cosign.bundle \
  --certificate-identity-regexp '^https://github.com/pgrundev/pgbot/\.github/workflows/release\.yml@' \
  --certificate-oidc-issuer https://token.actions.githubusercontent.com checksums.txt
Uninstalling
rm "$(command -v pgbot)"
rm -rf "${XDG_STATE_HOME:-$HOME/.local/state}/pgbot"   # local baseline store
pgbot writes nothing else on your machine — no daemons, no launch agents — and
nothing in the database: no extensions, no tables, no roles.
Setup — a read-only role with pg_monitor
The read-only guarantee is the role, not a flag. Create a login role that
holds pg_monitor (so it can see the full statistics views) and has no write
grants:
CREATE ROLE pgbot_ro LOGIN PASSWORD '...';
GRANT pg_monitor TO pgbot_ro;
GRANT CONNECT ON DATABASE yourdb TO pgbot_ro;
Or have pgbot init write exactly this for you — tailored to your provider and
database name, including the provider-specific pg_stat_statements step.
pgbot itself executes none of it (pgbot never writes); you review and run it:
pgbot init "postgres://admin@host:5432/db" | psql "postgres://admin@host:5432/db"
pgbot init --verify "postgres://pgbot_ro:…@host:5432/db"   # confirm the role works
Without pg_monitor, a non-superuser sees only its own sessions in
pg_stat_activity and can't read several views fully — pgbot detects this at
connect time and tells you exactly which GRANT to run rather than silently
reporting partial data.
pgbot additionally pins every session read-only (default_transaction_read_only,
statement_timeout=15s, lock_timeout=2s) and wraps each query in its own
BEGIN READ ONLY … COMMIT. It commits those read-only probes rather than
rolling them back — a read-only transaction writes nothing either way, but a
rollback would inflate the xact_rollback counter pgbot itself reports. Those
are defence in depth; the role is the boundary.
What it costs your database
A run opens one connection pool capped at 4 connections, holds no long
transactions (every probe is its own BEGIN READ ONLY … COMMIT under the
pinned statement_timeout=15s / lock_timeout=2s), and takes no locks beyond
the shared catalog access any SELECT takes. Counters are sampled twice across
the --interval gap (default 1s), so a full inspect finishes in a few
seconds of wall clock. It is safe to run against a busy primary — pgbot even
excludes its own sessions, transactions, and temp usage from what it reports,
so it never measures its own footprint as the database's. Run it against a
replica if you prefer, noting the per-node index-scan caveat in
pgbot indexes.
Point pgbot at your database
Pass the connection string as an argument — a URL or a libpq DSN:
pgbot inspect "postgres://pgbot_ro:secret@host:5432/db?sslmode=require"

# the libpq keyword/value DSN form works too:
pgbot inspect "host=host port=5432 dbname=db user=pgbot_ro sslmode=require"
Or set it once in the environment and omit the argument — convenient for a shell
session or CI, and it keeps the password out of your shell history and ps
output:
export DATABASE_URL="postgres://pgbot_ro:secret@host:5432/db?sslmode=require"

pgbot inspect
pgbot queries     # every command takes the connection the same way
pgbot diff --since 24h
pgbot resolves the connection in this order: the argument first, then
$DATABASE_URL, then $PGBOT_DATABASE_URL. Add ?sslmode=require (or stricter)
for any database reached over a network.
Reaching a private database
A database on a private network — RDS/Aurora inside a VPC, or a Postgres behind a
bastion — is reached through an SSH jump host:
pgbot inspect "postgres://[email protected]:5432/appdb?sslmode=verify-full" \
  --ssh-tunnel bastion.example.com    # or user@host:port, or a ~/.ssh/config alias
--ssh-tunnel is global — every command that opens a connection takes it — and
$PGBOT_SSH_TUNNEL sets it for a whole session.
The tunnel is a dialer, not an ssh -L forward, so **the DSN keeps naming the

 pgbot is a static binary that connects read-only to a PostgreSQL database, reads its own statistics views, and prints a findings-first health report plus what changed since the last run.