Gralobe
Open-source NPM package for beautiful 3D globe visualizations
Created as part of a submission to TechArena Finland Hackathon. This is a community contribution we're committed to maintaining and improving!
Interactive 3D globe visualization with world statistics, smooth flat map ↔ globe transitions, and country labels. Nothing like this existed before - and it's 100% useful for data visualization, dashboards, and educational projects!


Features
- Smooth morphing animation between flat (Mercator) map and 3D globe
- Built-in world statistics (Life Expectancy, GDP, CO2 Emissions, etc.)
- Country labels with multiple display styles
- NASA Blue Marble and other texture presets
- Visual effects (clouds, atmosphere, grid lines, etc.)
- Screenshot and video/GIF recording
- Height extrusion based on data values
- Fully typed TypeScript API
- Historical metric and year selection, country profiles, and comparison charts
- Country search, pinned watchlists, trend summaries, and downloadable statistic cards
Development and verification with Docker
From a clean checkout with Docker and Docker Compose installed:
docker compose --profile dev up --build dev
# Open http://localhost:5173
docker compose --profile test run --build --rm test
docker compose --profile test run --build --rm e2e
docker compose down
The test container runs unit tests, TypeScript checks, and both the library and
demo builds. The browser container runs Chromium with software WebGL and writes
reports to playwright-report/ and test-results/. Unit tests keep external
texture availability checks skipped unless explicitly enabled; browser integration
fixtures replace external textures while running the real globe and components.
Country exploration
Enable showTrend, showSearch, and showWatchlist to show the country search,
click summary, pin controls, and current values for pinned countries. showHelp
adds a manual when showToolbar is enabled. A double click opens a country profile
and zooms in; double click again to return. The toolbar chart button compares up
to eight countries using line or bar charts.
Historical data can be supplied through setTimeSeries or setTimeSeriesOptions:
await globe.ready;
globe.setTimeSeries({
  definition: {
    id: 'internetUsers', name: 'Internet use', unit: '%',
    colorScale: ['#eff3ff', '#9ecae1', '#3182bd'], domain: [0, 100],
  },
  frames: {
    '2020': { '250': 84, '578': 97 },
    '2023': { '250': 87, '578': 99 },
  },
});
globe.setTimelineStep(1);
The trend panel and watchlist follow the active metric and year. Percentage
metrics show changes in percentage points. Plain statistics may provide an
optional previousValues map for prior-period comparisons. Missing data stays
missing in profiles and charts. The demo's World Bank cache is refreshed through
a reviewed pull request rather than a direct update to the default branch.
Hosting
All project hosting must use Hetzner. Vercel deployments and managed services
require direct owner approval for the specific project, environment and service;
automatic Git deployments are disabled by vercel.json. Existing recovery
artifacts do not authorize further Vercel deployment.
The Docker runtime serves the built demo through an unprivileged Nginx process:
docker compose up --build --detach web
# http://localhost:8081 and http://localhost:8081/healthz
The runtime is stateless and exposes only a loopback port. On Hetzner, place it
behind the existing TLS reverse proxy. Deploy an immutable image or commit and
retain the previous image for rollback. No DNS or live deployment is changed by
the development and test commands above.
The production demo vendors its texture, geographic and worker assets in
public/vendor; the build verifies their committed checksums. Asset attribution
is available through the demo footer. Library builds retain their existing asset
defaults. See the Hetzner deployment runbook for
image identity, the shared proxy, public verification and rollback commands.
Live Demo
🌐 Try it live at gralobe.maptheory.org - A fully configurable version where you can explore different datasets, textures, and visual effects!
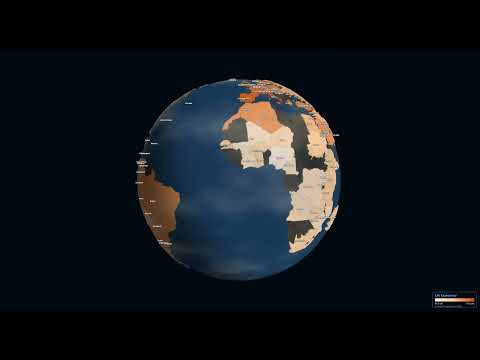
▶️ Watch the demo on YouTube
Installation
npm install gralobe three
Quick Start
import { GlobeViz } from 'gralobe';

// Create a globe with default settings
const globe = new GlobeViz('#container');
The default configuration displays:
- NASA Blue Marble satellite texture
- All country labels
- Life Expectancy statistic
- Globe view (morphed to sphere)
Configuration
import { GlobeViz } from 'gralobe';

const globe = new GlobeViz('#container', {
  // Earth texture: 'satellite' | 'natural' | 'dark' | 'light' | 'night' | 'topographic' | 'day' | 'bathymetry' | 'atlas'
  texture: 'satellite',

  // Label style: 'none' | 'minimal' | 'major' | 'all' | 'data'
  labels: 'data',

  // Initial statistic to display (built-in ID or custom StatisticData)
  statistic: 'lifeExpectancy',

  // Initial view: 'globe' or 'flat'
  initialView: 'globe',

  // Enable auto-rotation
  autoRotate: false,

  // Show control panel (lil-gui) - Now a modular Category Bar in top-right
  showControls: true,

  // Show legend
  showLegend: true,

  // Enable 3D height extrusion based on data values
  extrudeHeight: false,

  // Visual effects
  effects: {
    atmosphereIntensity: 0.5,
    clouds: true,
    cloudSpeed: 1.0,
    cloudOpacity: 0.6,
    gridLines: false,
    starTwinkle: true,
  },

  // Callbacks
  onCountryClick: (id, name, value) => {
    console.log(`Clicked: ${name} (${id}) = ${value}`);
  },
  onViewChange: (view, morph) => {
    console.log(`View: ${view}, Morph: ${morph}`);
  },
});
API
View Control
// Animate to globe view
globe.toGlobe();

// Animate to flat map view
globe.toFlat();

// Set morph value directly (0 = flat, 1 = globe)
globe.setMorph(0.5);

// Get current morph value
const morph = globe.getMorph();
Statistics
// Change to a built-in statistic
globe.setStatistic('gdpPerCapita');

// Available built-in statistics:
// - lifeExpectancy
// - humanDevIndex
// - gdpPerCapita
// - co2Emissions
// - renewableEnergy
// - internetUsers
// - urbanPopulation
// - healthExpenditure
// - forestArea
// - population
// - accessElectricity
// - educationExpenditure
Labels
// Change label style
globe.setLabels('major'); // 'none' | 'minimal' | 'major' | 'all' | 'data'
Texture
// Change earth texture
await globe.setTexture('night');
Available texture presets:
satellite, natural, daydark, light, nighttopographic, bathymetryatlas (political boundary map; pair with labels for names)
Effects
// Update visual effects
globe.setEffects({
  clouds: true,
  cloudSpeed: 1.5,
  atmosphereIntensity: 0.8,
  gridLines: true,
});
Export
// Take a screenshot
globe.screenshot({ filename: 'globe.png' });

// Record a GIF
await globe.recordGif({ duration: 5, fps: 30 });

// Record a video
await globe.recordVideo({ duration: 10 });
Urban Data (Points)
Visualize city-level or point-based data with synthetic boundaries.
globe.setUrbanData([
  { lat: 40.7128, lon: -74.0060, value: 100, name: "New York" },
  { lat: 35.6762, lon: 139.6503, value: 85, name: "Tokyo" },
]);
Other
// Enable/disable auto-rotation
globe.setAutoRotate(true);

// Resize
globe.resize(800, 600);

// Clean up
globe.destroy();
Built-in Statistics
| ID |
Name |
Unit |
lifeExpectancy |
Life Expectancy |
years |
humanDevIndex |
Human Development Index |
- |
gdpPerCapita |
GDP per Capita (PPP) |
$ |
co2Emissions |
CO2 Emissions |
t/capita |
renewableEnergy |
Renewable Energy |
% |
internetUsers |
Internet Penetration |
% |
urbanPopulation |
Urbanization |
% |
healthExpenditure |
Health Spending |
% GDP |
forestArea |
Forest Coverage |
% |
population |
Population |
millions |
accessElectricity |
Electricity Access |
% |
educationExpenditure |
Education Spending |
% GDP |
Custom Statistics
You can provide your own statistics data:
import type { StatisticData } from 'gralobe';

const customStat: StatisticData = {
  definition: {
    id: 'myStatistic',
    name: 'My Custom Statistic',
    unit: '%',
    description: 'Description of my statistic',
    colorScale: ['#feedde', '#fdbe85', '#d94701'],
    domain: [0, 100],
    format: (v) => `${v.toFixed(1)}%`,
  },
  values: {
    'US': 75.5,      // ISO alpha-2
    'Germany': 42.3, // Country name
    'CHN': 60.0,     // ISO alpha-3
    '826': 55.0,     // ISO numeric
  },
};

globe.setStatistic(customStat);
Gralobe accepts multiple country identifier formats:
| Format |
Example |
Description |
| ISO 3166-1 alpha-2 |
US, DE, TR |
2-letter country codes |
| ISO 3166-1 alpha-3 |
USA, DEU, TUR |
3-letter country codes |
| ISO 3166-1 numeric |
840, 276, 792 |
3-digit numeric codes |
| Country name |
Germany, Turkey |
Common English names |
All formats are automatically normalized internally.
TypeScript Types
import type {
  GlobeVizConfig,
  GlobeVizAPI,
  StatisticDefinition,
  StatisticData,
  CountryData,
  TexturePreset,
  LabelStyle,
  EffectsConfig,
  ExportOptions,
} from 'gralobe';
Development
# Install dependencies
npm install

# Run development server
npm run dev

# Build library
npm run build:lib

# Build demo app
npm run build
Browser Support
Gralobe requires WebGL support. It works in all modern browsers:
- Chrome 80+
- Firefox 75+
- Safari 14+
- Edge 80+
Dependencies
License
MIT

 Gralobe 是一个开源的 npm 包,用于构建可交互的 3D 地球仪可视化效果,支持在平面地图和地球仪之间平滑变形,并内置世界统计数据和国家标签。