 English |






这是什么?
 G2 是一个可视化语法库,用于构建图表、仪表盘、数据探索和数据叙事,灵感来源于 Leland Wilkinson 的著作《The Grammar of Graphics》。
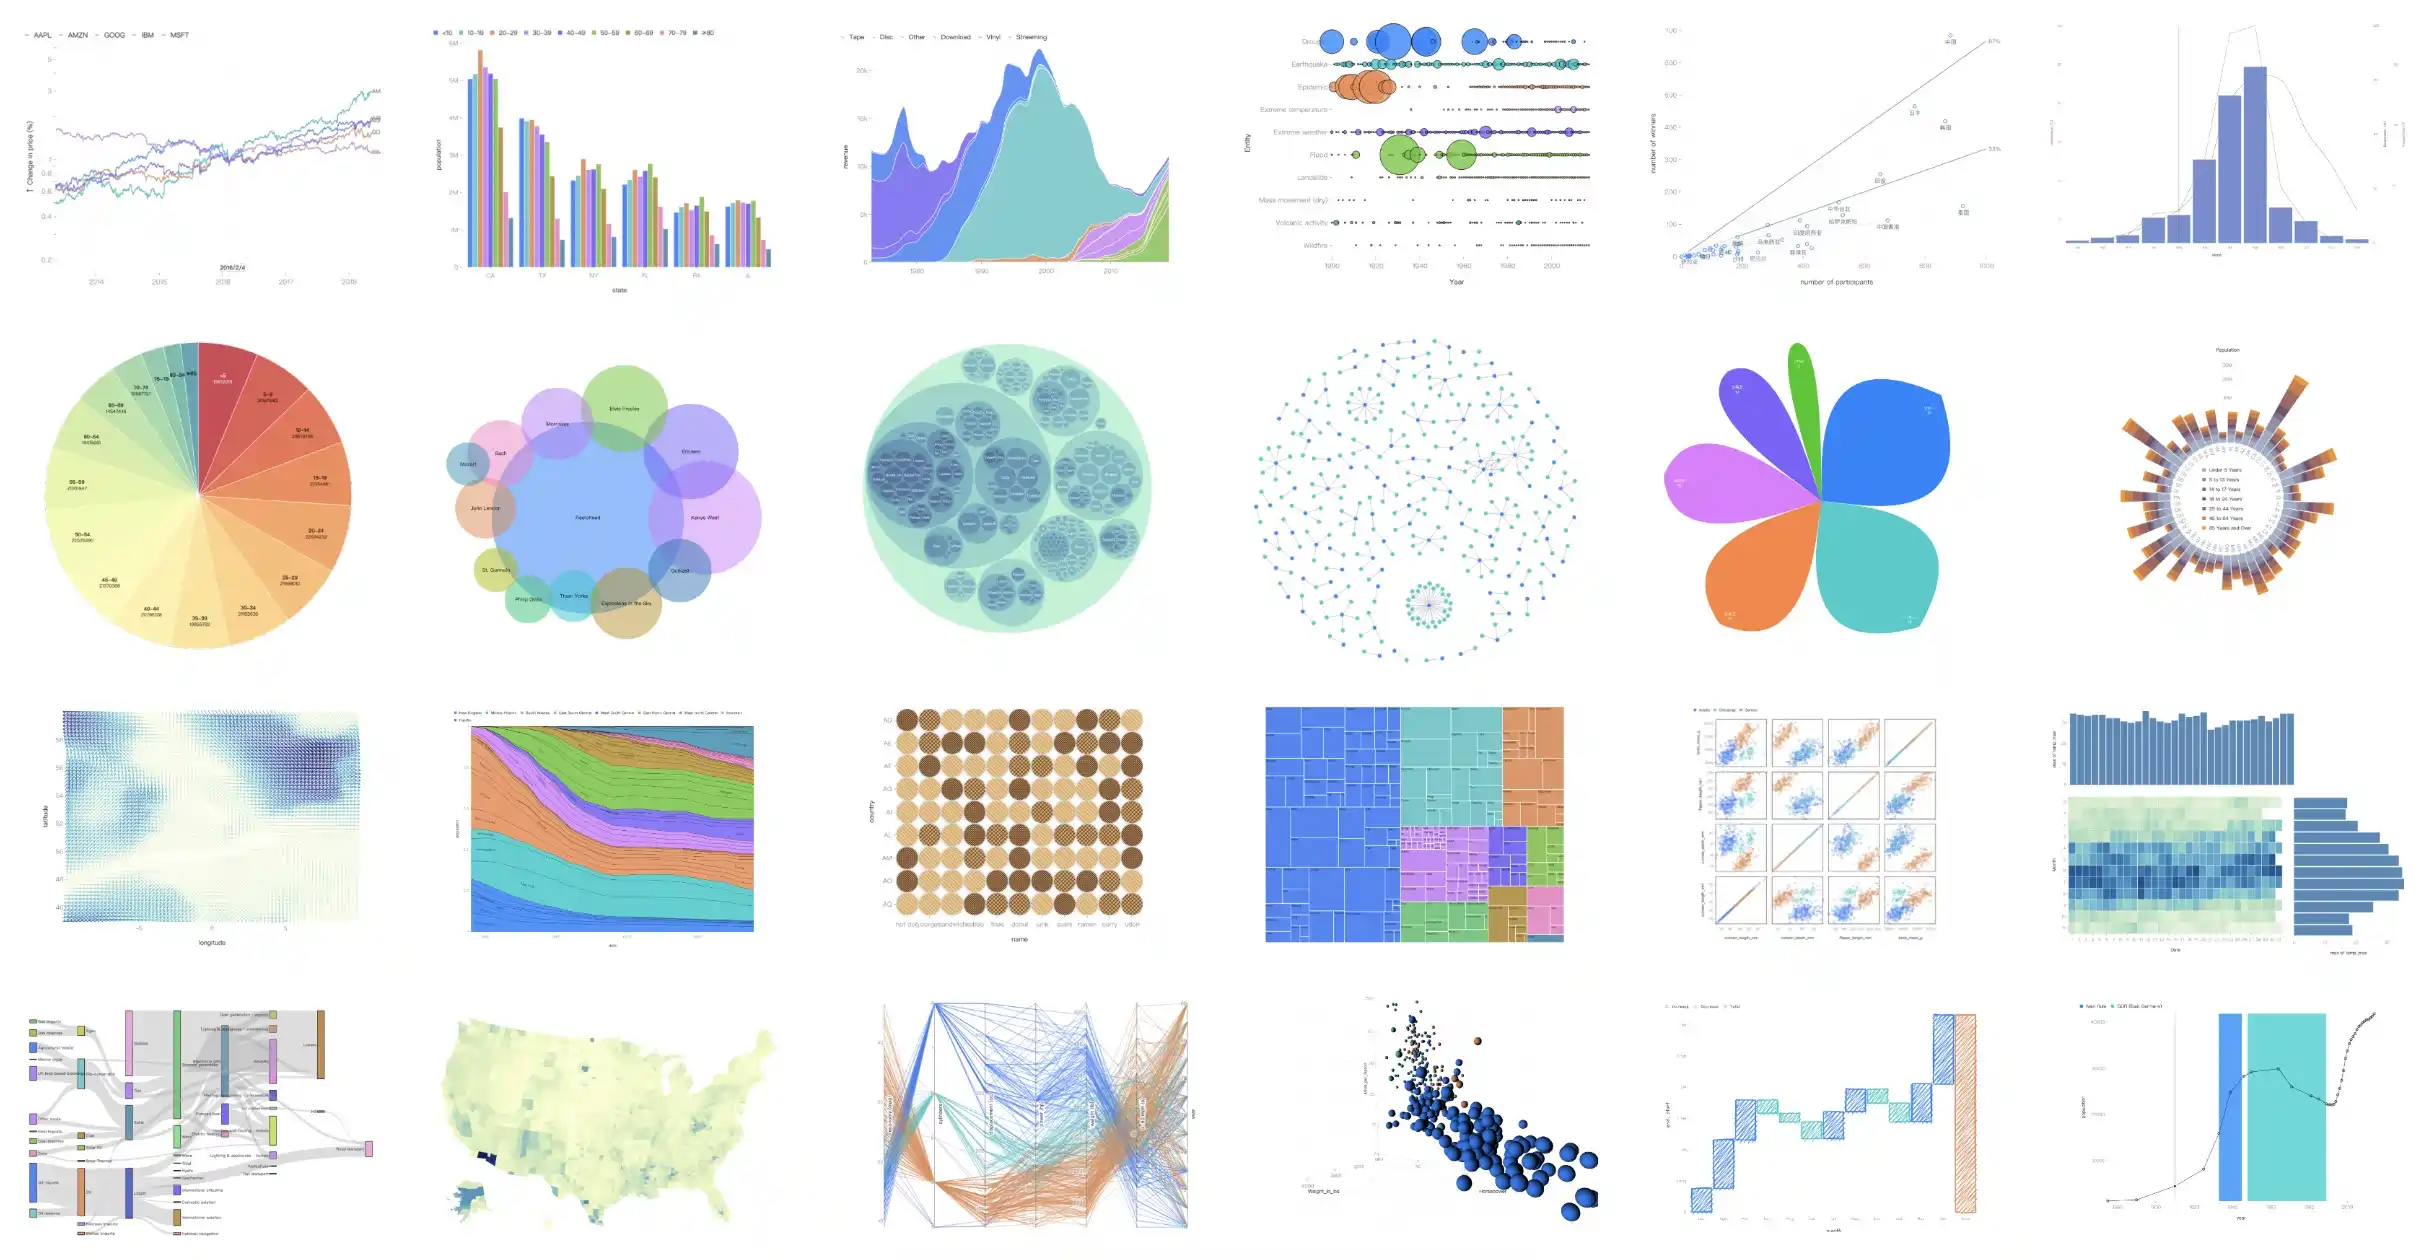
G2 是一个可视化语法库,用于构建图表、仪表盘、数据探索和数据叙事,灵感来源于 Leland Wilkinson 的著作《The Grammar of Graphics》。这是固定图表类型的图表库,还是更灵活的工具?它基于语法而非类型:你无需从预设的图表类型中选择,而是组合标记、数据变换、比例尺、坐标系和组合方式,来构建任意可视化,包括由数据驱动的动画和交互。
它基于语法而非类型:你无需从预设的图表类型中选择,而是组合标记、数据变换、比例尺、坐标系和组合方式,来构建任意可视化,包括由数据驱动的动画和交互。如何将它添加到项目中?使用 npm 或 Yarn 安装,然后从 G2 中导入 Chart 对象,开始声明你的可视化。
使用 npm 或 Yarn 安装,然后从 G2 中导入 Chart 对象,开始声明你的可视化。使用它除了 npm 还需要其他东西吗?除了 Node.js 和用于安装的包管理器之外,不需要任何特殊运行环境;它完全在浏览器中运行,通过 Canvas、SVG 或 WebGL 进行渲染。
除了 Node.js 和用于安装的包管理器之外,不需要任何特殊运行环境;它完全在浏览器中运行,通过 Canvas、SVG 或 WebGL 进行渲染。图表变复杂时,它还能保持简单吗?基础图表可以用简洁的声明快速构建,因为 G2 会自动推断其余设置;但要实现高级定制,就需要学习它更完整的语法,包括标记、数据变换、比例尺和坐标系。
基础图表可以用简洁的声明快速构建,因为 G2 会自动推断其余设置;但要实现高级定制,就需要学习它更完整的语法,包括标记、数据变换、比例尺和坐标系。G2 和常见的图表库有什么不同?G2 不提供固定的图表类型集合,而是使用可组合的语法,包括标记、比例尺、数据变换和坐标系,让你能构建自定义可视化,并实现数据驱动的动画和交互,而不是从预设中挑选。
G2 不提供固定的图表类型集合,而是使用可组合的语法,包括标记、比例尺、数据变换和坐标系,让你能构建自定义可视化,并实现数据驱动的动画和交互,而不是从预设中挑选。G2 底层的渲染器支持哪些功能?G2 的渲染器名为 G,可以绘制到 Canvas、SVG 或 WebGL,并支持插件实现手绘图等风格,同时与 D3 生态兼容。
G2 的渲染器名为 G,可以绘制到 Canvas、SVG 或 WebGL,并支持插件实现手绘图等风格,同时与 D3 生态兼容。G2 有 React 封装吗?有。'g2-react' 为 G2 提供了轻量的 React 组件;'ant-design-charts' 基于 G2 构建了 React 图表库,并与 G6、X6 和 L7Plot 配套使用。
有。'g2-react' 为 G2 提供了轻量的 React 组件;'ant-design-charts' 基于 G2 构建了 React 图表库,并与 G6、X6 和 L7Plot 配套使用。G2 这个名字从哪来?G2 的名字源自 Leland Wilkinson 的著作《The Grammar of Graphics》,该书从一开始就深刻启发了这个库。
G2 的名字源自 Leland Wilkinson 的著作《The Grammar of Graphics》,该书从一开始就深刻启发了这个库。Which topics is it in?interaction, grammar, d3, charting-library, chart, declarative, canvas, webgl, svg, visualization, graphics, data-visualization
interaction, grammar, d3, charting-library, chart, declarative, canvas, webgl, svg, visualization, graphics, data-visualization