



What is this?
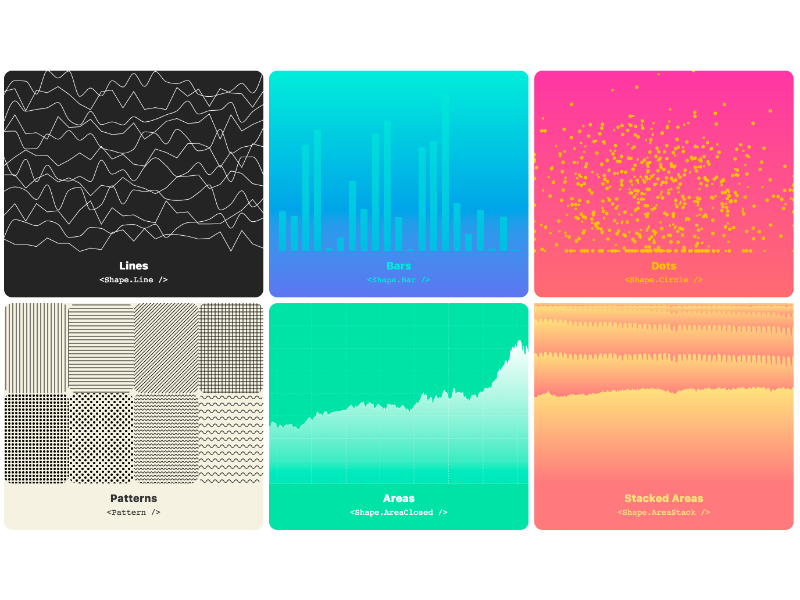
 visx is a collection of reusable low-level visualization components for React: d3 does the calculations and math, while React renders and updates the DOM. You compose charts from components instead of writing d3 selection code.
visx is a collection of reusable low-level visualization components for React: d3 does the calculations and math, while React renders and updates the DOM. You compose charts from components instead of writing d3 selection code.How is it different from just using d3 directly?visx uses d3 under the hood for the math but exposes everything as React components, so there are no selections or enter()/exit()/update() to learn. You can even wrap it in your own component API that hides d3 entirely.
visx uses d3 under the hood for the math but exposes everything as React components, so there are no selections or enter()/exit()/update() to learn. You can even wrap it in your own component API that hides d3 entirely.How do I add it to a project?Install only the @visx packages you need — visx is split into small modules so bundle sizes stay down — and compose them in your React app. The README walks through a bar graph, and the gallery has many more examples.
Install only the @visx packages you need — visx is split into small modules so bundle sizes stay down — and compose them in your React app. The README walks through a bar graph, and the gallery has many more examples.Which React version does it need?visx v4, the current stable release, requires React 18 or 19. Preact also works if you alias react and react-dom to preact/compat and satisfy the React 18/19 peer dependency range.
visx v4, the current stable release, requires React 18 or 19. Preact also works if you alias react and react-dom to preact/compat and satisfy the React 18/19 peer dependency range.Is animation baked in?No — that was a conscious choice. Because visx is plain React, it already works with any React animation library, so an app that already bundles something like react-motion does not pay for a duplicate animation package.
No — that was a conscious choice. Because visx is plain React, it already works with any React animation library, so an app that already bundles something like react-motion does not pay for a duplicate animation package.Are these ready-made charts or building blocks for my own chart library?Both. The goal is components you can use for your own reusable chart library or a slick custom one-off chart, and visx is largely unopinionated and meant to be built upon — wrapping it for your team is explicitly encouraged.
Both. The goal is components you can use for your own reusable chart library or a slick custom one-off chart, and visx is largely unopinionated and meant to be built upon — wrapping it for your team is explicitly encouraged.What does the name visx stand for?It stands for visualization components — the name is literally an abbreviation of what the library is.
It stands for visualization components — the name is literally an abbreviation of what the library is.Is the project still actively developed?Yes — v4 is the current stable release with an official v3-to-v4 migration guide, and the repo runs CI workflows on pushes and pull requests.
Yes — v4 is the current stable release with an official v3-to-v4 migration guide, and the repo runs CI workflows on pushes and pull requests.Is it a good fit for TypeScript projects?Yes — the codebase itself is written in TypeScript and the packages are compiled from .ts and .tsx sources, so you work with typed code throughout.
Yes — the codebase itself is written in TypeScript and the packages are compiled from .ts and .tsx sources, so you work with typed code throughout.What are similar projects?victory, G2, recharts, apexcharts.js, blobatar, vue-echarts, d3, vega
victory, G2, recharts, apexcharts.js, blobatar, vue-echarts, d3, vegaWhich topics is it in?preact, d3, chart, svg, visualization, monorepo, component-library, data-visualization, ui-components, ui, web-development, react
preact, d3, chart, svg, visualization, monorepo, component-library, data-visualization, ui-components, ui, web-development, react