 English |






Что это такое?
 G2 — это библиотека визуализации на основе грамматики для создания диаграмм, дашбордов, исследования данных и сторителлинга. Она вдохновлена книгой Лиланда Уилкинсона «The Grammar of Graphics».
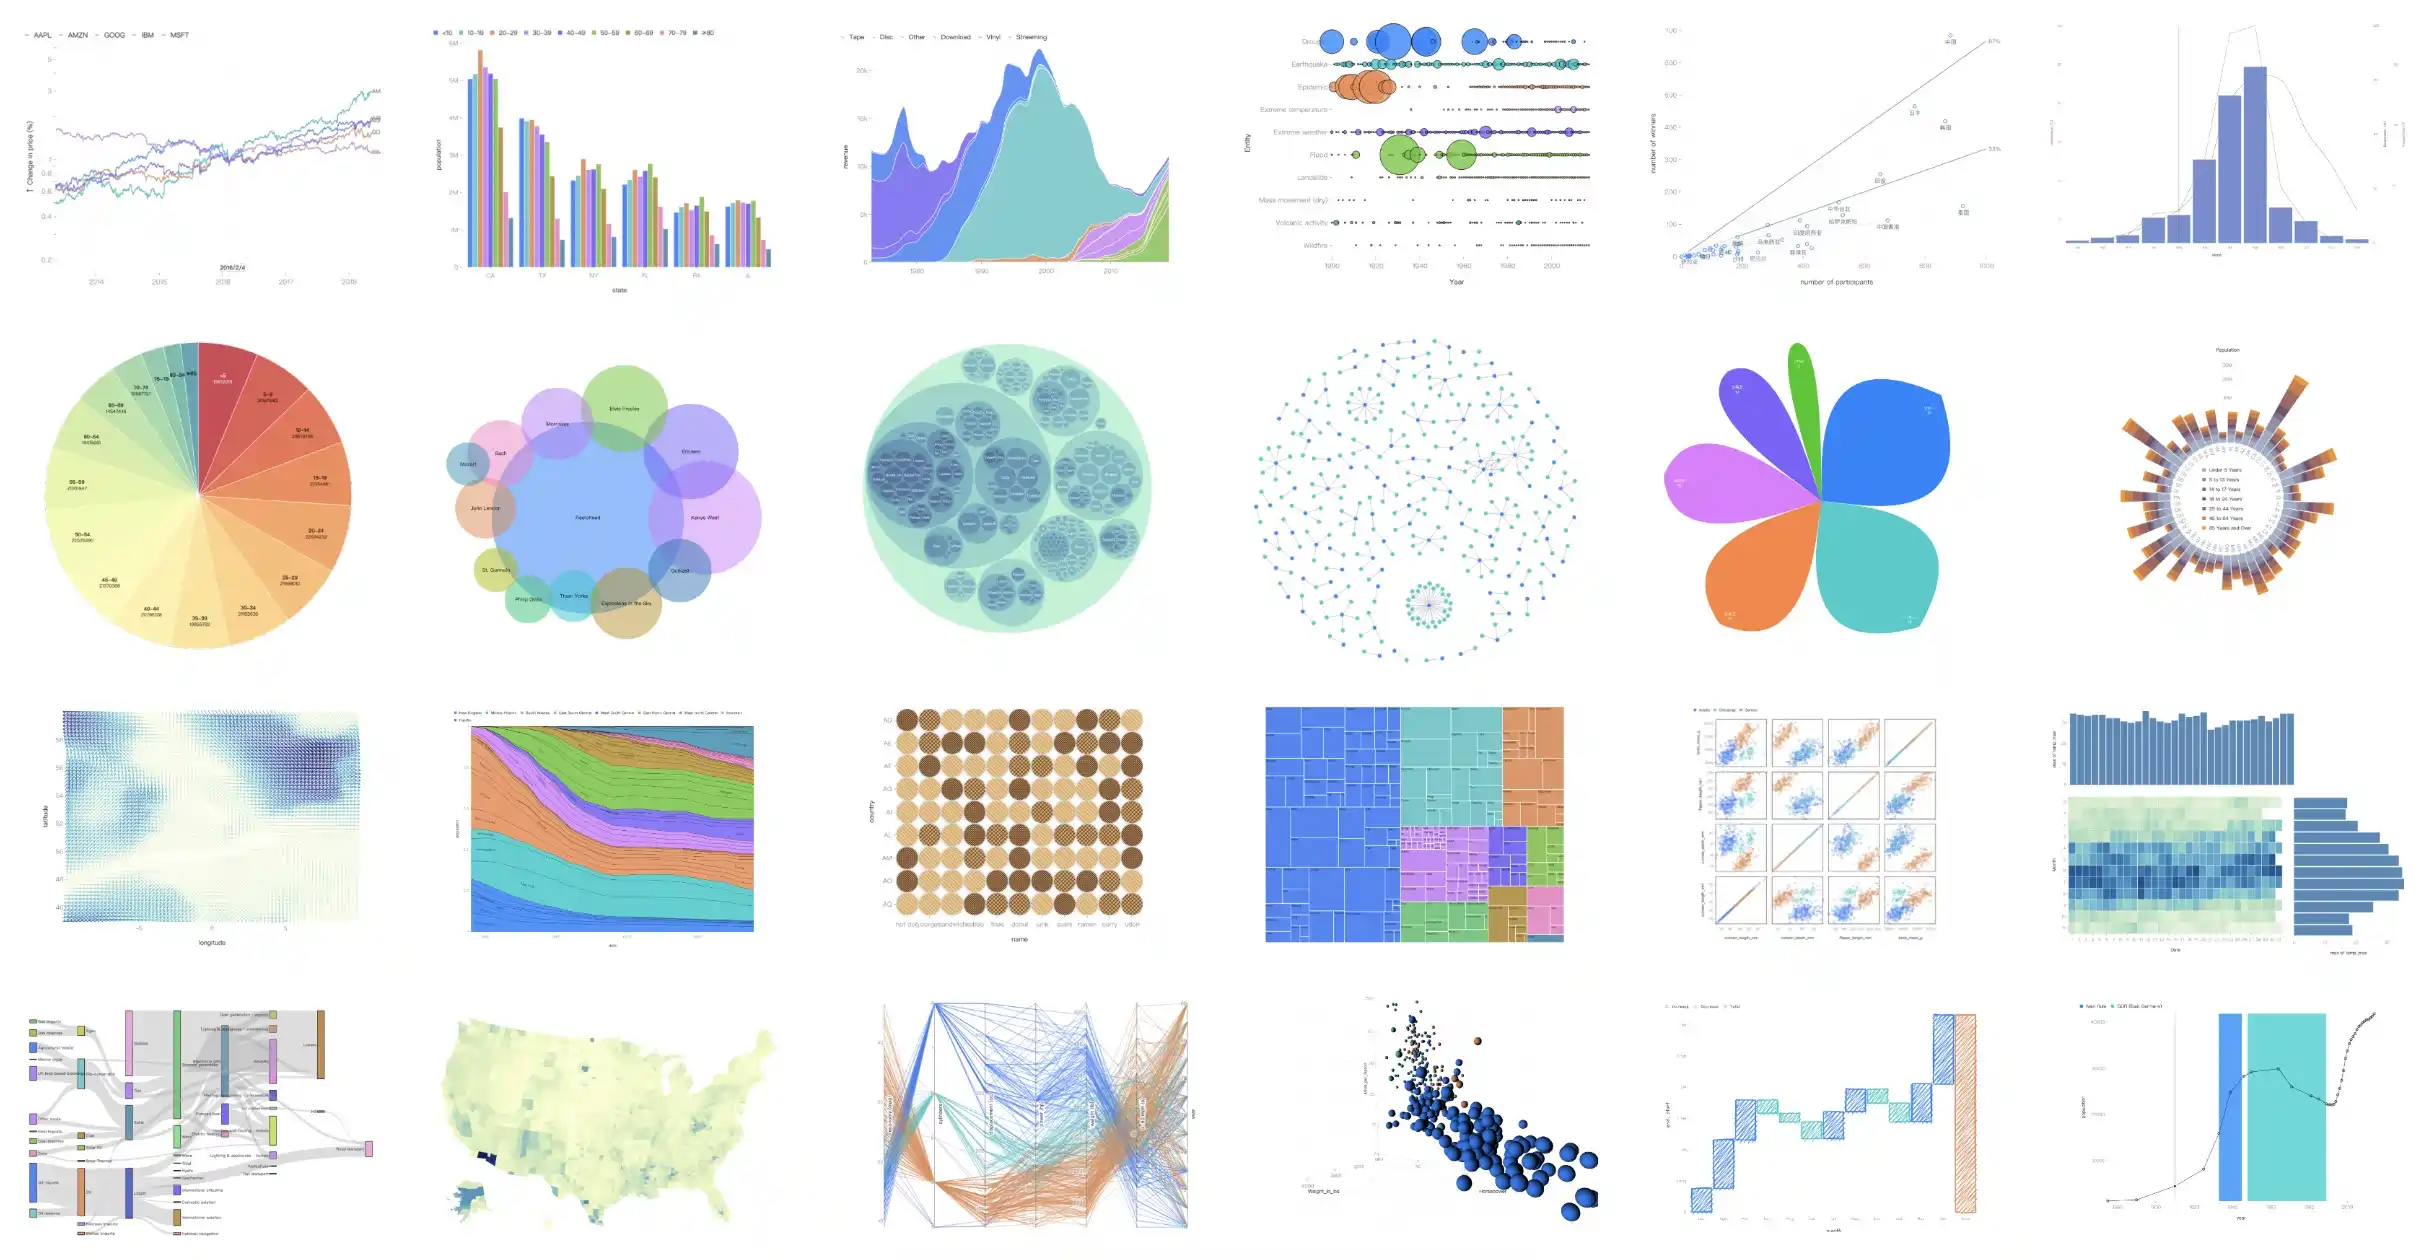
G2 — это библиотека визуализации на основе грамматики для создания диаграмм, дашбордов, исследования данных и сторителлинга. Она вдохновлена книгой Лиланда Уилкинсона «The Grammar of Graphics».Это библиотека диаграмм с фиксированными типами или что-то более гибкое?Она основана на грамматике, а не на типах: вместо выбора готовых типов диаграмм вы комбинируете метки, преобразования, шкалы, системы координат и композиции, чтобы построить любую визуализацию, включая анимации и интерактивность, управляемые данными.
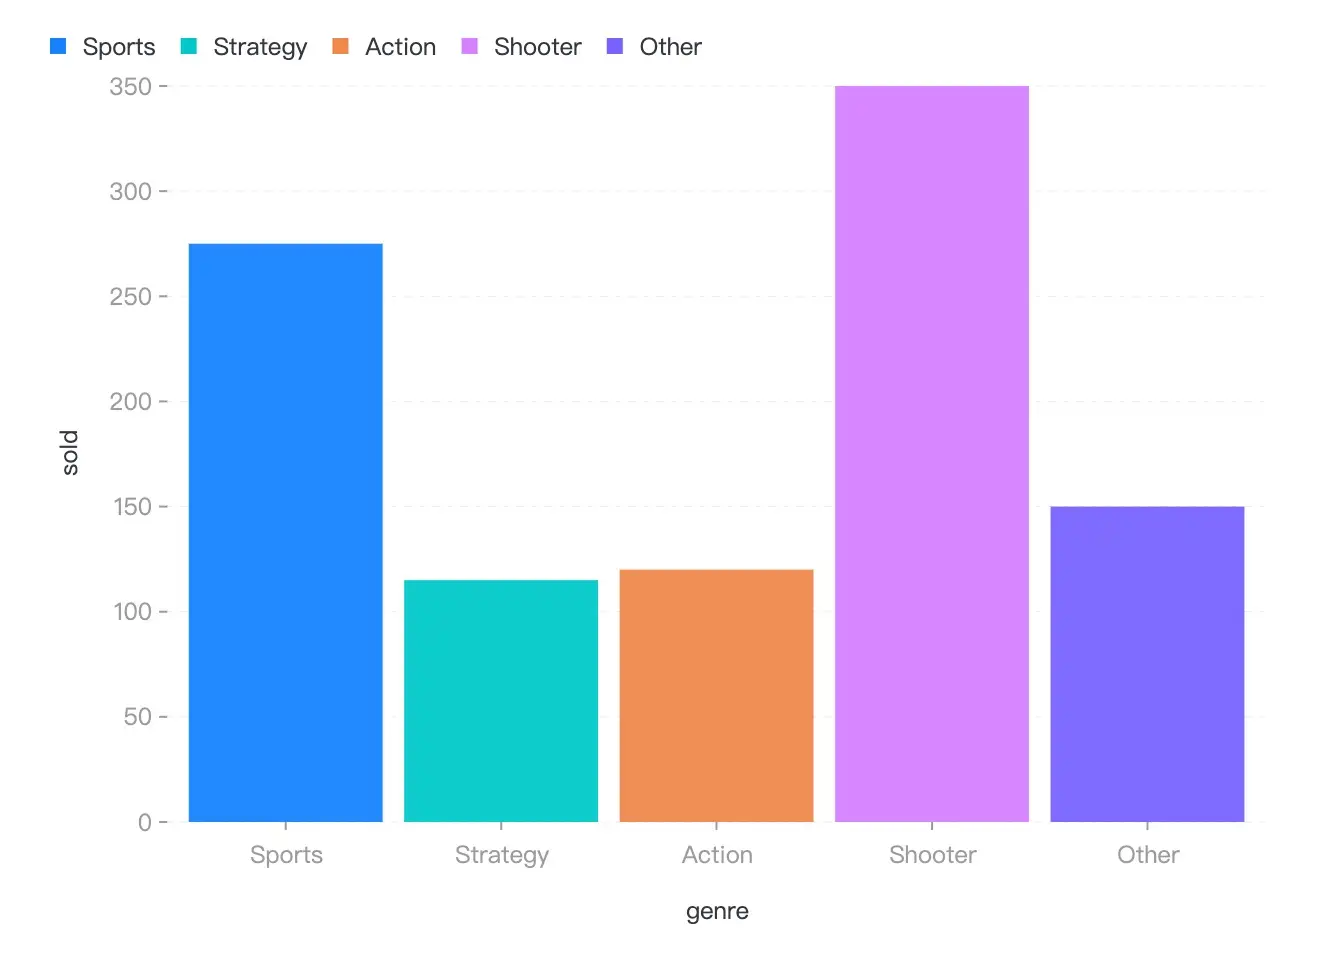
Она основана на грамматике, а не на типах: вместо выбора готовых типов диаграмм вы комбинируете метки, преобразования, шкалы, системы координат и композиции, чтобы построить любую визуализацию, включая анимации и интерактивность, управляемые данными.Как добавить её в проект?Установите через npm или Yarn, затем импортируйте объект Chart из G2, чтобы начать описывать свою визуализацию.
Установите через npm или Yarn, затем импортируйте объект Chart из G2, чтобы начать описывать свою визуализацию.Нужно ли что-то кроме npm, чтобы её использовать?Никакой особой среды выполнения не требуется, кроме Node.js и менеджера пакетов для установки; библиотека работает полностью в браузере и выводит графику через Canvas, SVG или WebGL.
Никакой особой среды выполнения не требуется, кроме Node.js и менеджера пакетов для установки; библиотека работает полностью в браузере и выводит графику через Canvas, SVG или WebGL.Остаётся ли она простой, когда диаграммы усложняются?Базовые диаграммы создаются быстро благодаря лаконичным описаниям, так как G2 сама выводит недостающие детали. Но для расширенной настройки нужно освоить её полную грамматику меток, преобразований, шкал и координат.
Базовые диаграммы создаются быстро благодаря лаконичным описаниям, так как G2 сама выводит недостающие детали. Но для расширенной настройки нужно освоить её полную грамматику меток, преобразований, шкал и координат.Чем G2 отличается от обычных библиотек диаграмм?Вместо фиксированного набора типов диаграмм G2 использует составляемую грамматику меток, шкал, преобразований и координат. Это позволяет создавать собственные визуализации с анимациями и интерактивностью, управляемыми данными, а не выбирать из готовых шаблонов.
Вместо фиксированного набора типов диаграмм G2 использует составляемую грамматику меток, шкал, преобразований и координат. Это позволяет создавать собственные визуализации с анимациями и интерактивностью, управляемыми данными, а не выбирать из готовых шаблонов.Что умеет рендерер, лежащий в основе G2?Рендерер G2, который называется G, выводит графику через Canvas, SVG или WebGL и поддерживает плагины для стилей, например рукописных диаграмм, а также работает с экосистемой D3.
Рендерер G2, который называется G, выводит графику через Canvas, SVG или WebGL и поддерживает плагины для стилей, например рукописных диаграмм, а также работает с экосистемой D3.Есть ли обёртка G2 для React?Да, «g2-react» предоставляет лёгкий компонент React для G2, а «ant-design-charts» строит библиотеку диаграмм для React на основе G2 вместе с G6, X6 и L7Plot.
Да, «g2-react» предоставляет лёгкий компонент React для G2, а «ant-design-charts» строит библиотеку диаграмм для React на основе G2 вместе с G6, X6 и L7Plot.Откуда взялось название G2?G2 назвали в честь книги Лиланда Уилкинсона «The Grammar of Graphics», которая с самого начала глубоко повлияла на библиотеку.
G2 назвали в честь книги Лиланда Уилкинсона «The Grammar of Graphics», которая с самого начала глубоко повлияла на библиотеку.Which topics is it in?interaction, grammar, d3, charting-library, chart, declarative, canvas, webgl, svg, visualization, graphics, data-visualization
interaction, grammar, d3, charting-library, chart, declarative, canvas, webgl, svg, visualization, graphics, data-visualization