 English |






What is this?
 G2 is a visualization grammar library for building charts, dashboards, data exploration, and storytelling, inspired by Leland Wilkinson's book 'The Grammar of Graphics'.
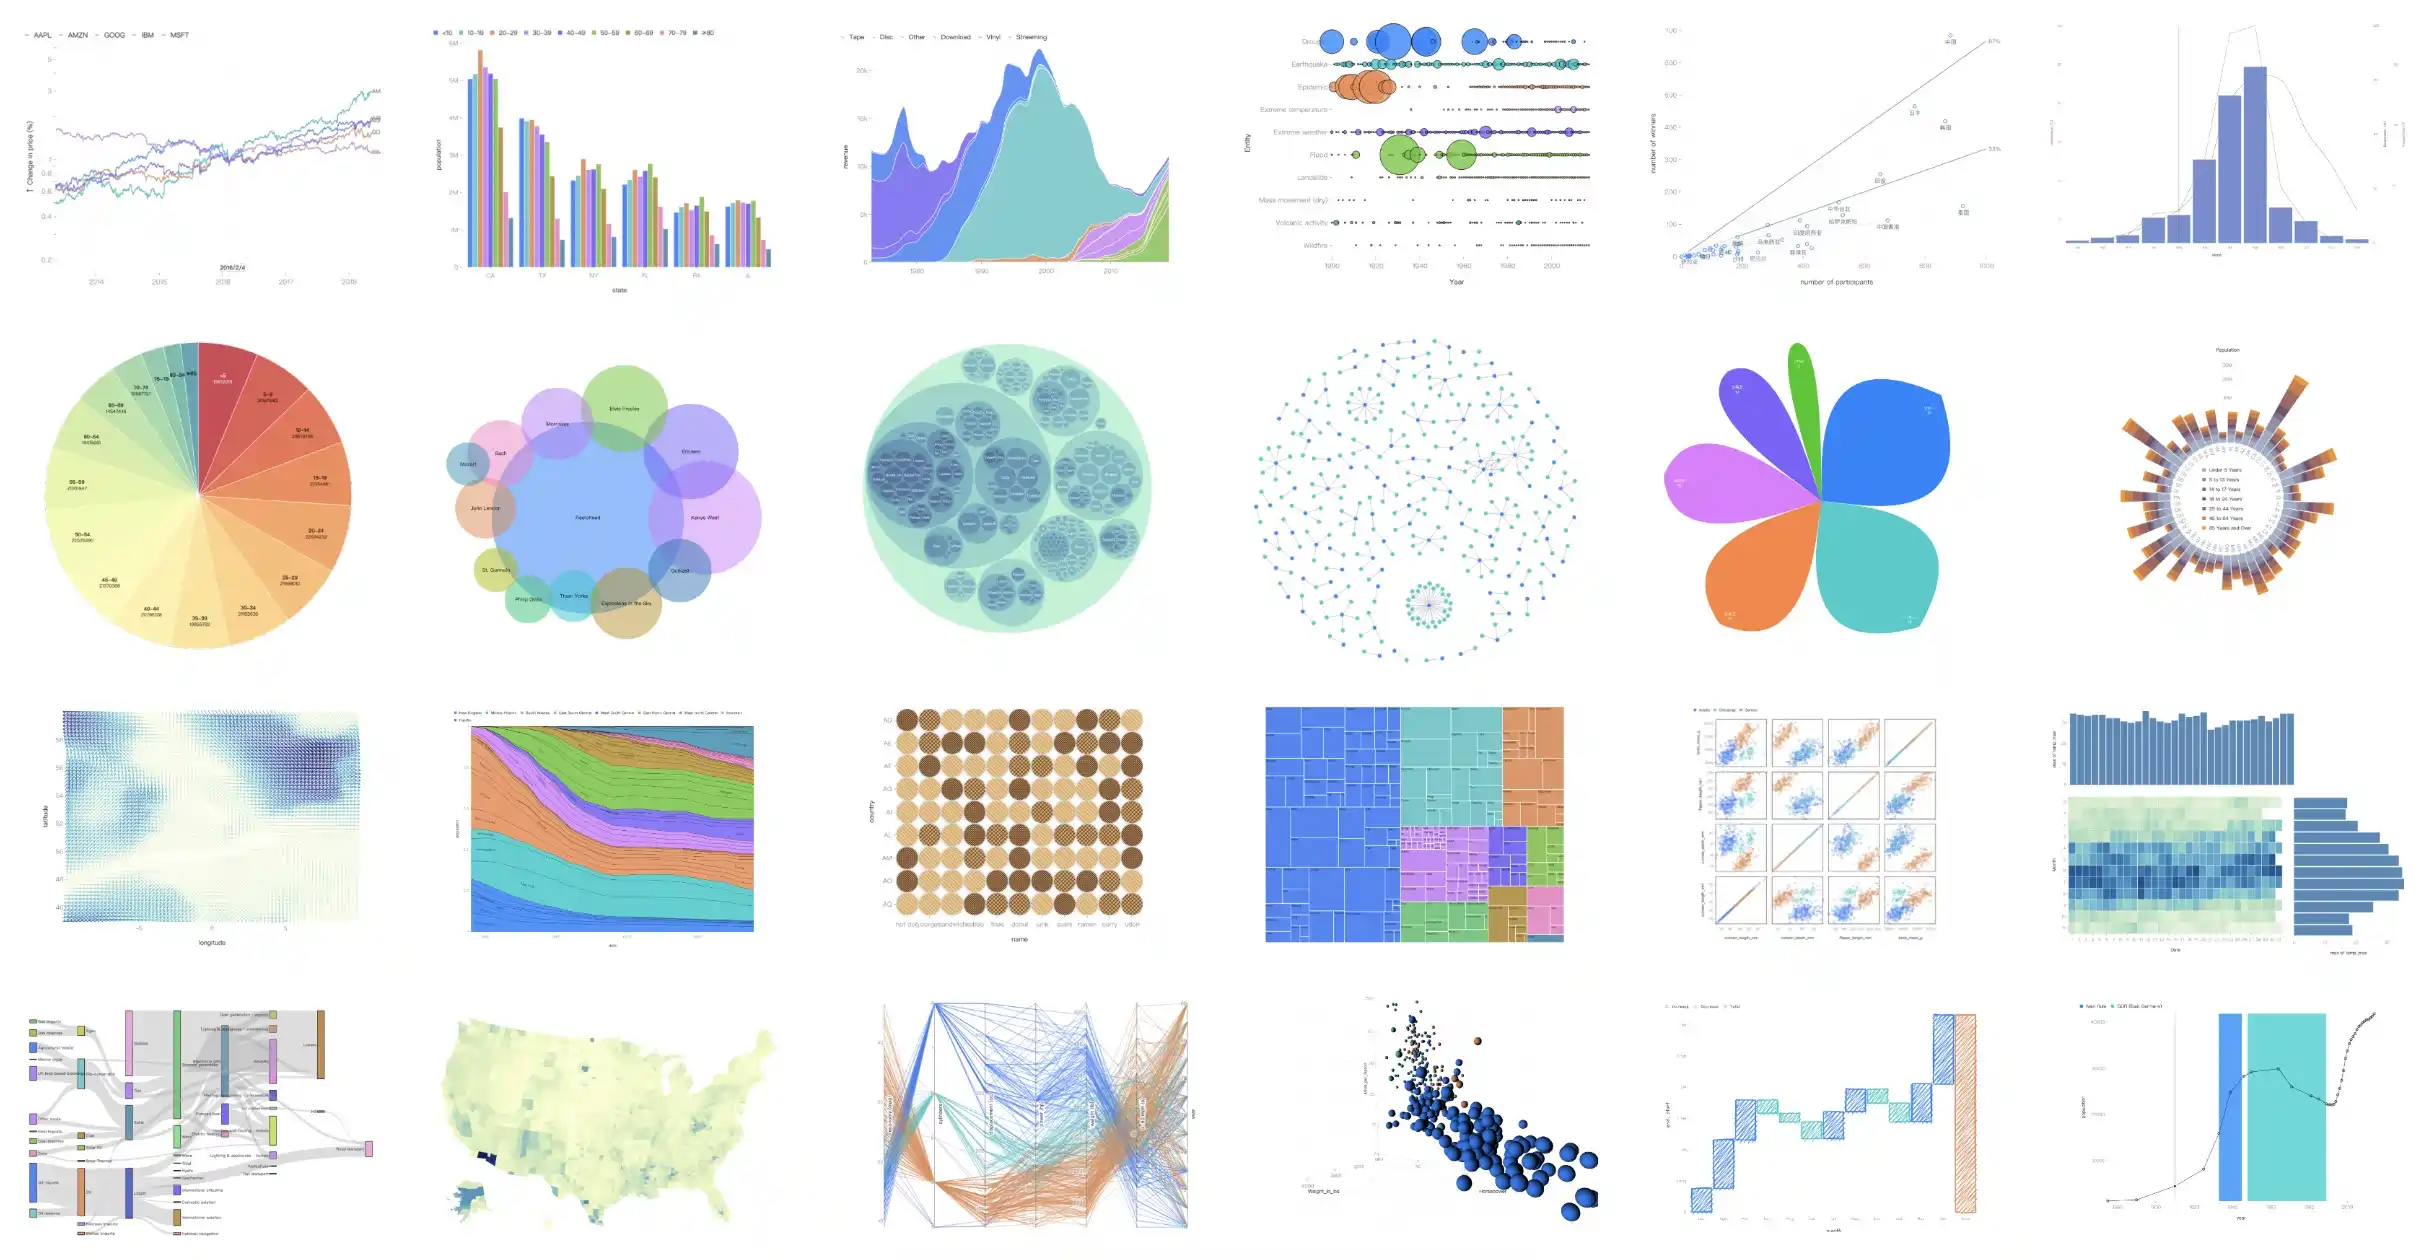
G2 is a visualization grammar library for building charts, dashboards, data exploration, and storytelling, inspired by Leland Wilkinson's book 'The Grammar of Graphics'.Is this a chart library with fixed chart types, or something more flexible?It is grammar-based rather than type-based: instead of picking from preset chart types, you compose marks, transforms, scales, coordinates, and compositions to build any visualization, including data-driven animations and interactions.
It is grammar-based rather than type-based: instead of picking from preset chart types, you compose marks, transforms, scales, coordinates, and compositions to build any visualization, including data-driven animations and interactions.How do I add it to a project?Install it with npm or Yarn, then import the Chart object from G2 to start declaring your visualization.
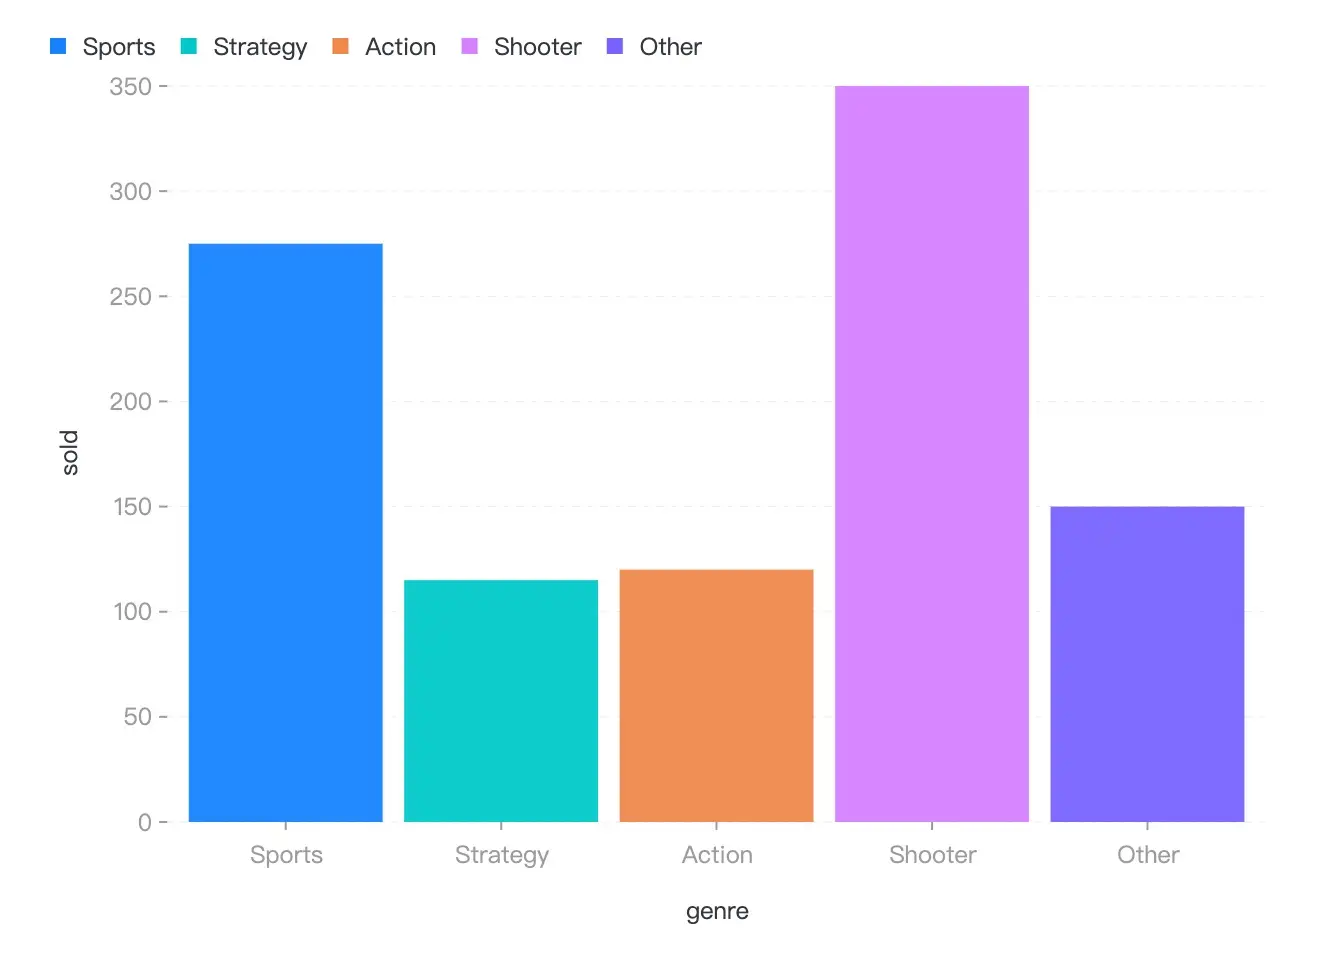
Install it with npm or Yarn, then import the Chart object from G2 to start declaring your visualization.Do I need anything beyond npm to use it?No special runtime is required beyond Node.js and a package manager to install it; it runs purely in the browser, rendering through Canvas, SVG, or WebGL.
No special runtime is required beyond Node.js and a package manager to install it; it runs purely in the browser, rendering through Canvas, SVG, or WebGL.Does it stay simple as charts get more complex?Basic charts are quick to build with concise declarations since G2 infers the rest, but unlocking advanced customization means learning its fuller grammar of marks, transforms, scales, and coordinates.
Basic charts are quick to build with concise declarations since G2 infers the rest, but unlocking advanced customization means learning its fuller grammar of marks, transforms, scales, and coordinates.How is G2 different from typical charting libraries?Instead of a fixed set of chart types, G2 uses a composable grammar of marks, scales, transforms, and coordinates, letting you build custom visualizations with data-driven animations and interactions rather than picking from presets.
Instead of a fixed set of chart types, G2 uses a composable grammar of marks, scales, transforms, and coordinates, letting you build custom visualizations with data-driven animations and interactions rather than picking from presets.What does G2's underlying renderer support?G2's renderer, called G, draws to Canvas, SVG, or WebGL and supports plugins for styles like hand-drawn charts, embracing the D3 ecosystem.
G2's renderer, called G, draws to Canvas, SVG, or WebGL and supports plugins for styles like hand-drawn charts, embracing the D3 ecosystem.Is there a React wrapper for G2?Yes, 'g2-react' provides a lightweight React component for G2, and 'ant-design-charts' builds a React chart library on top of G2 alongside G6, X6, and L7Plot.
Yes, 'g2-react' provides a lightweight React component for G2, and 'ant-design-charts' builds a React chart library on top of G2 alongside G6, X6, and L7Plot.Where does the name G2 come from?G2 is named after Leland Wilkinson's book 'The Grammar of Graphics', which profoundly inspired the library from the very beginning.
G2 is named after Leland Wilkinson's book 'The Grammar of Graphics', which profoundly inspired the library from the very beginning.Which topics is it in?interaction, grammar, d3, charting-library, chart, declarative, canvas, webgl, svg, visualization, graphics, data-visualization
interaction, grammar, d3, charting-library, chart, declarative, canvas, webgl, svg, visualization, graphics, data-visualization