



signoz README

The project's README from github.com/SigNoz/signoz. As one markdown file: README.md.

SigNoz - Observability on Your Terms, Powered by Open Standards.

中文 · Deutsch · Português

GitHub issues GitHub release Slack community LinkedIn Tweet

SigNoz is an open-source observability platform built on OpenTelemetry. We’re building an enterprise-grade alternative to fragmented monitoring stacks, with logs, metrics, traces, alerts, and dashboards in one place.

Choose how to run SigNoz

Fully managed SigNoz with a 30-day free trial, no credit card required, usage-based pricing that starts at $49, and regional data hosting.

Start free →

Enterprise

Enterprise Cloud, BYOC, or Enterprise Self-Hosted with compliance, support, custom retention, RBAC, ingestion controls, data residency, and region selection.

Explore Enterprise →

Community

Free open-source SigNoz that runs in your own infrastructure. Deploy with Docker, Kubernetes, or Linux and keep full control of your data plane.

Install SigNoz →

What can you monitor?

SigNoz helps teams debug production issues faster by connecting logs, metrics, traces, alerts, dashboards, exceptions, and agent-native workflows in one place.

APM Overview

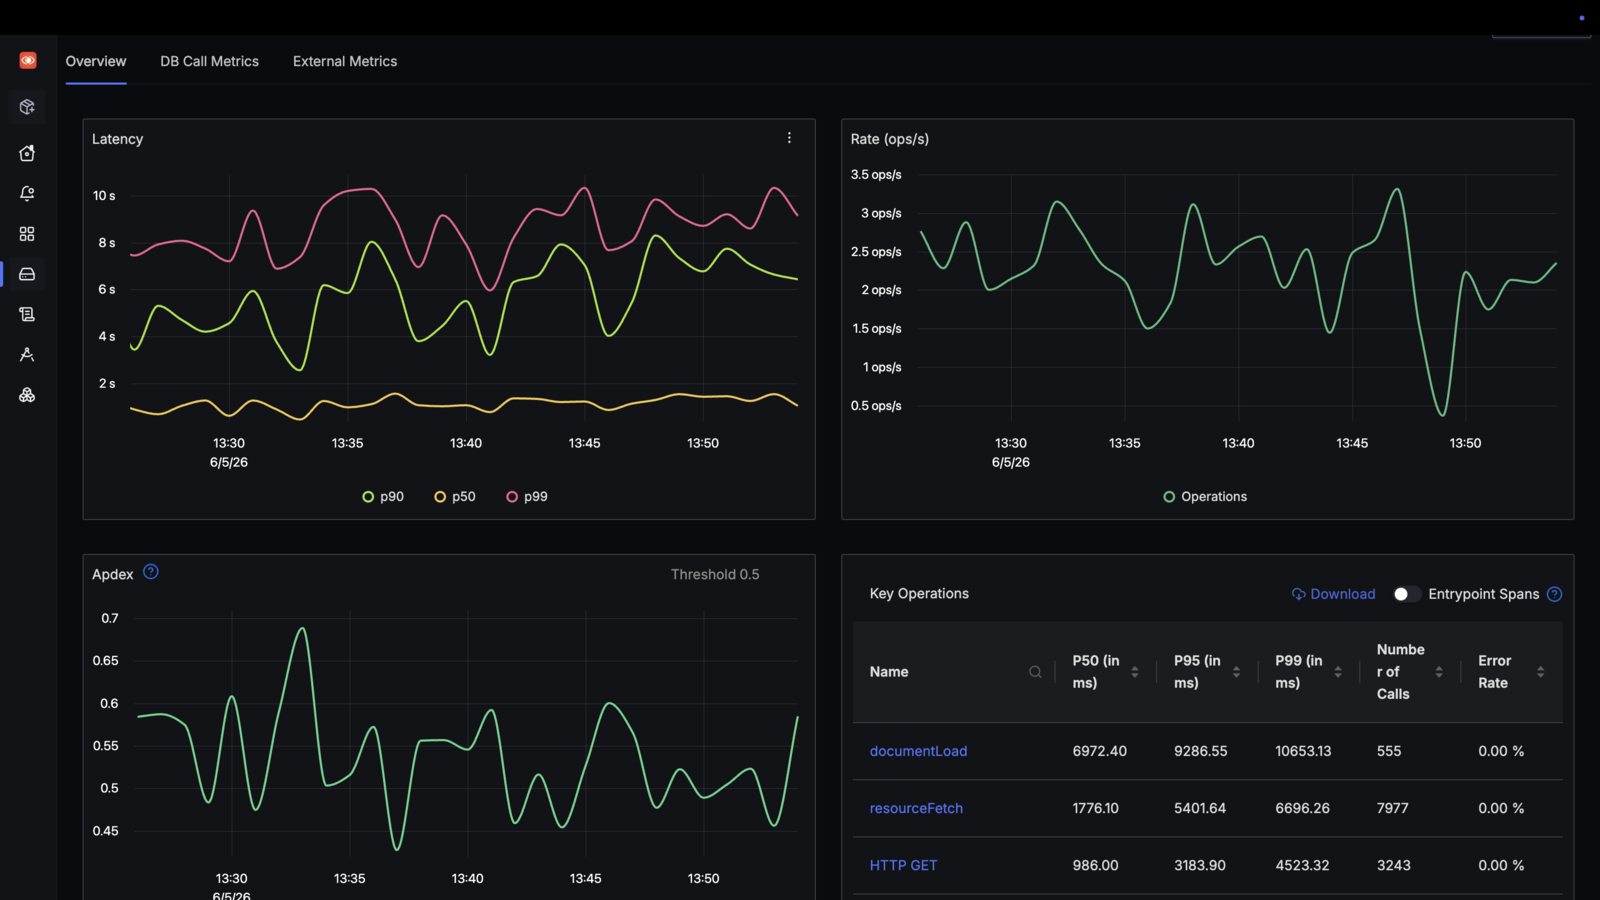
Monitor service latency, error rate, throughput, Apdex, top endpoints, database calls, and external calls.

SigNoz APM dashboard showing latency, throughput, Apdex, and key operations

Learn more: APM documentation

Log Management

Ingest, search, aggregate, and correlate logs with traces and metrics using a visual query builder.

SigNoz logs explorer with filters, frequency chart, and log lines

Learn more: Log management documentation

Metrics and Dashboards

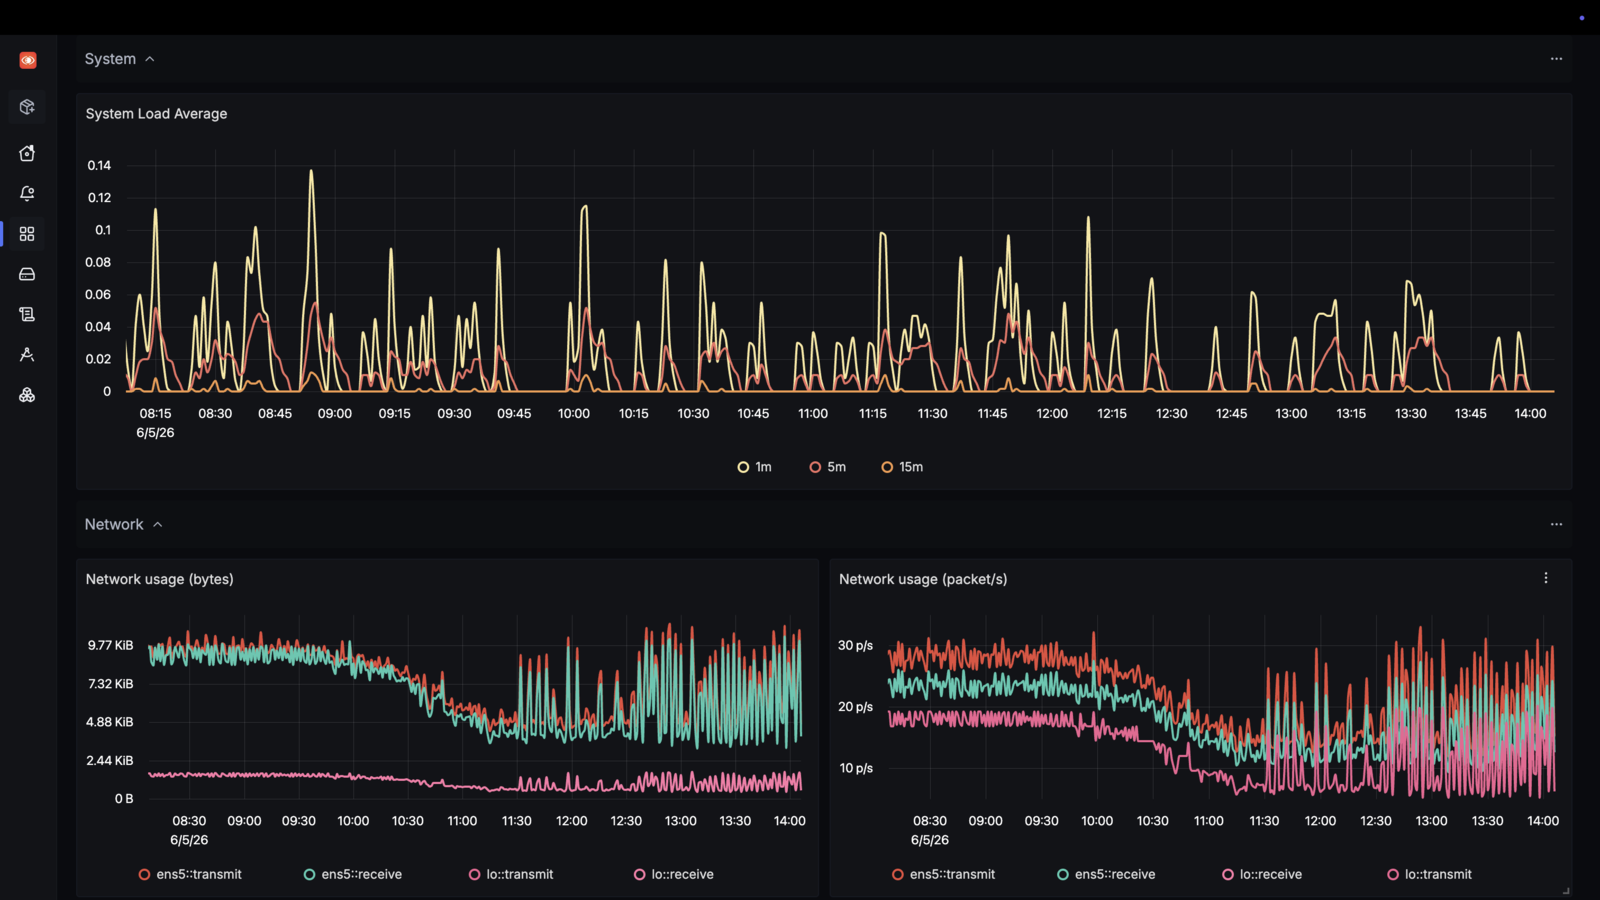
Build dashboards for application, infrastructure, and custom metrics using Query Builder, PromQL, or ClickHouse SQL.

SigNoz host metrics dashboard with system load and network charts

Learn more: Metrics documentation

Infrastructure Monitoring

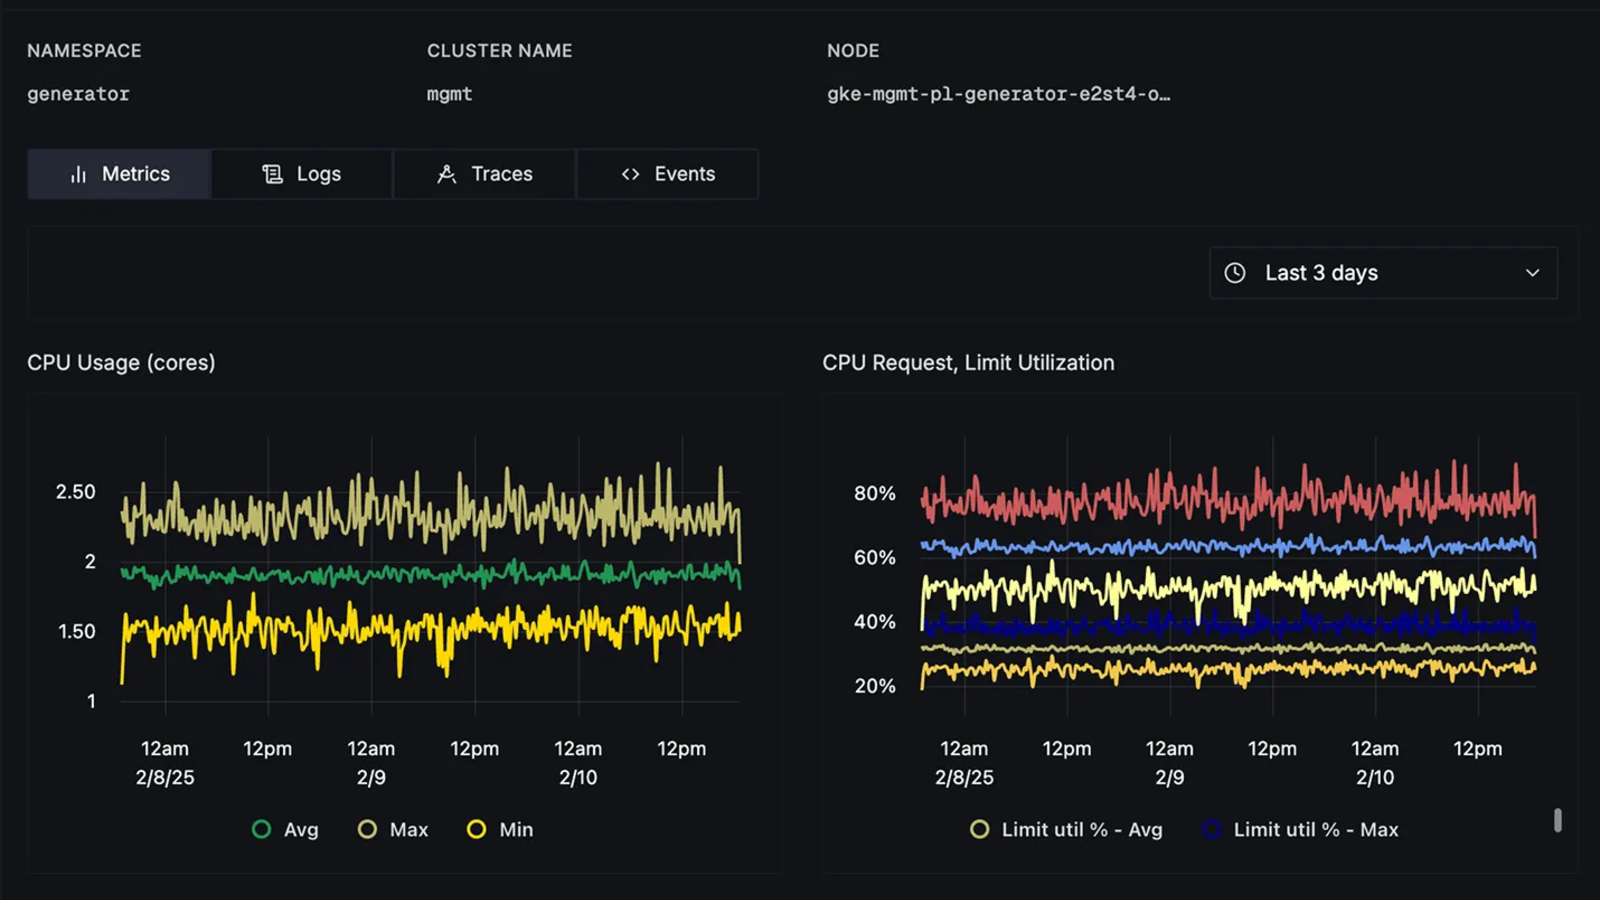
Monitor Kubernetes clusters, pods, nodes, workloads, and host-level CPU, memory, disk, network, logs, and traces.

SigNoz Kubernetes infrastructure dashboard with pod and node metrics

Learn more: Infrastructure monitoring documentation

LLM and AI Observability

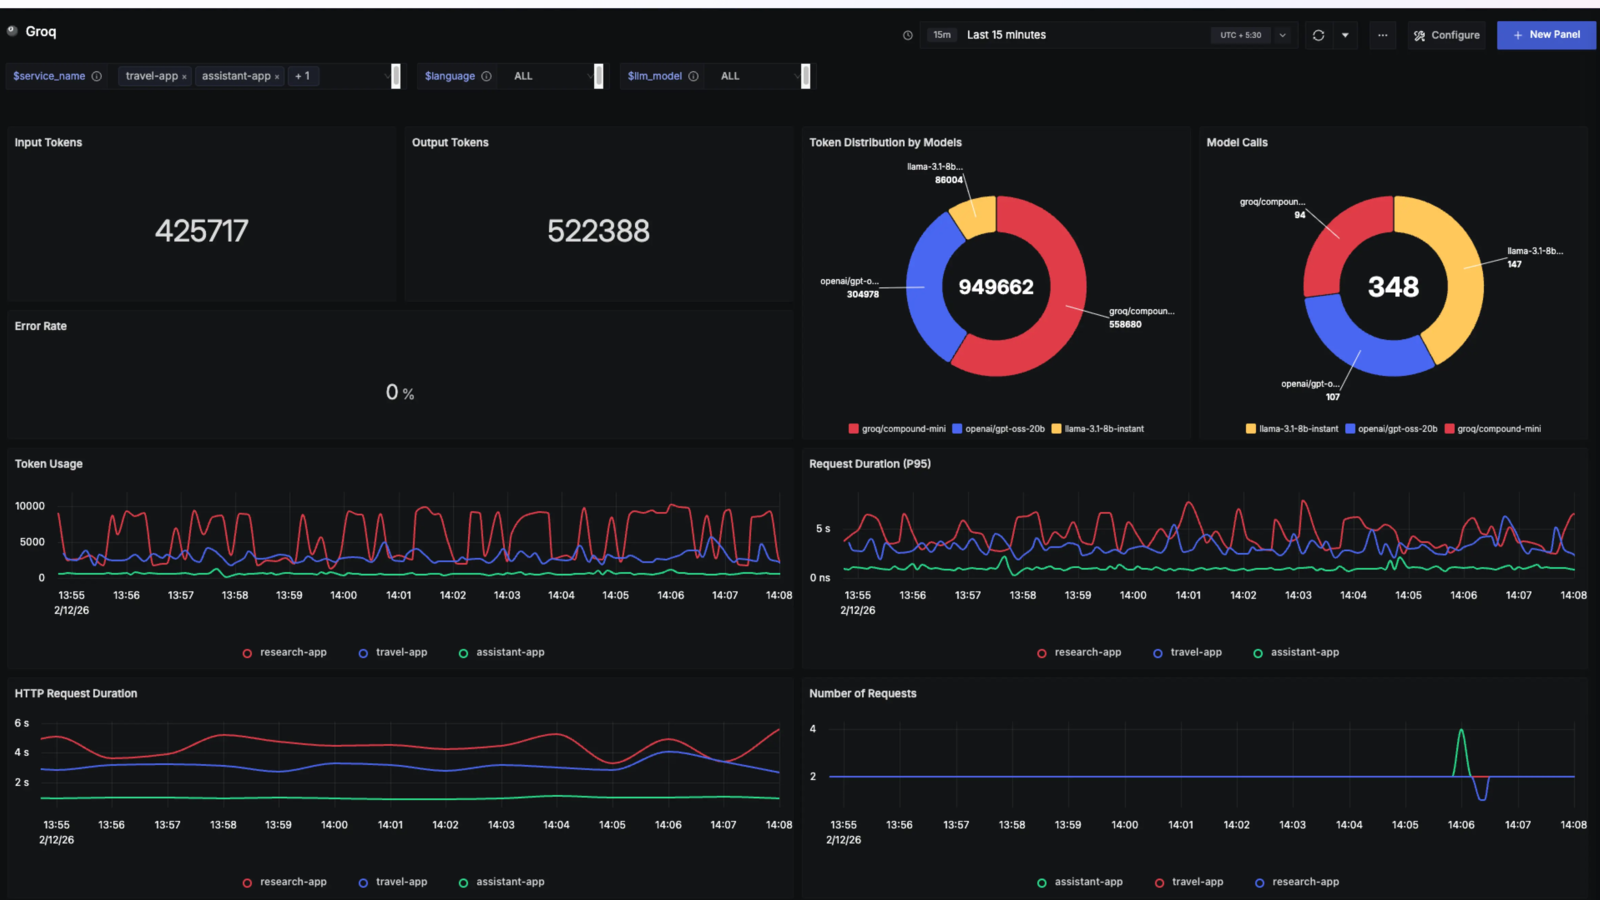
Trace LLM apps, RAG pipelines, prompts, tool calls, tokens, latency, and costs alongside application and infrastructure telemetry.

SigNoz LLM observability dashboard for traces, token usage, latency, and costs

Learn more: LLM observability documentation

Agent-Native Observability and MCP

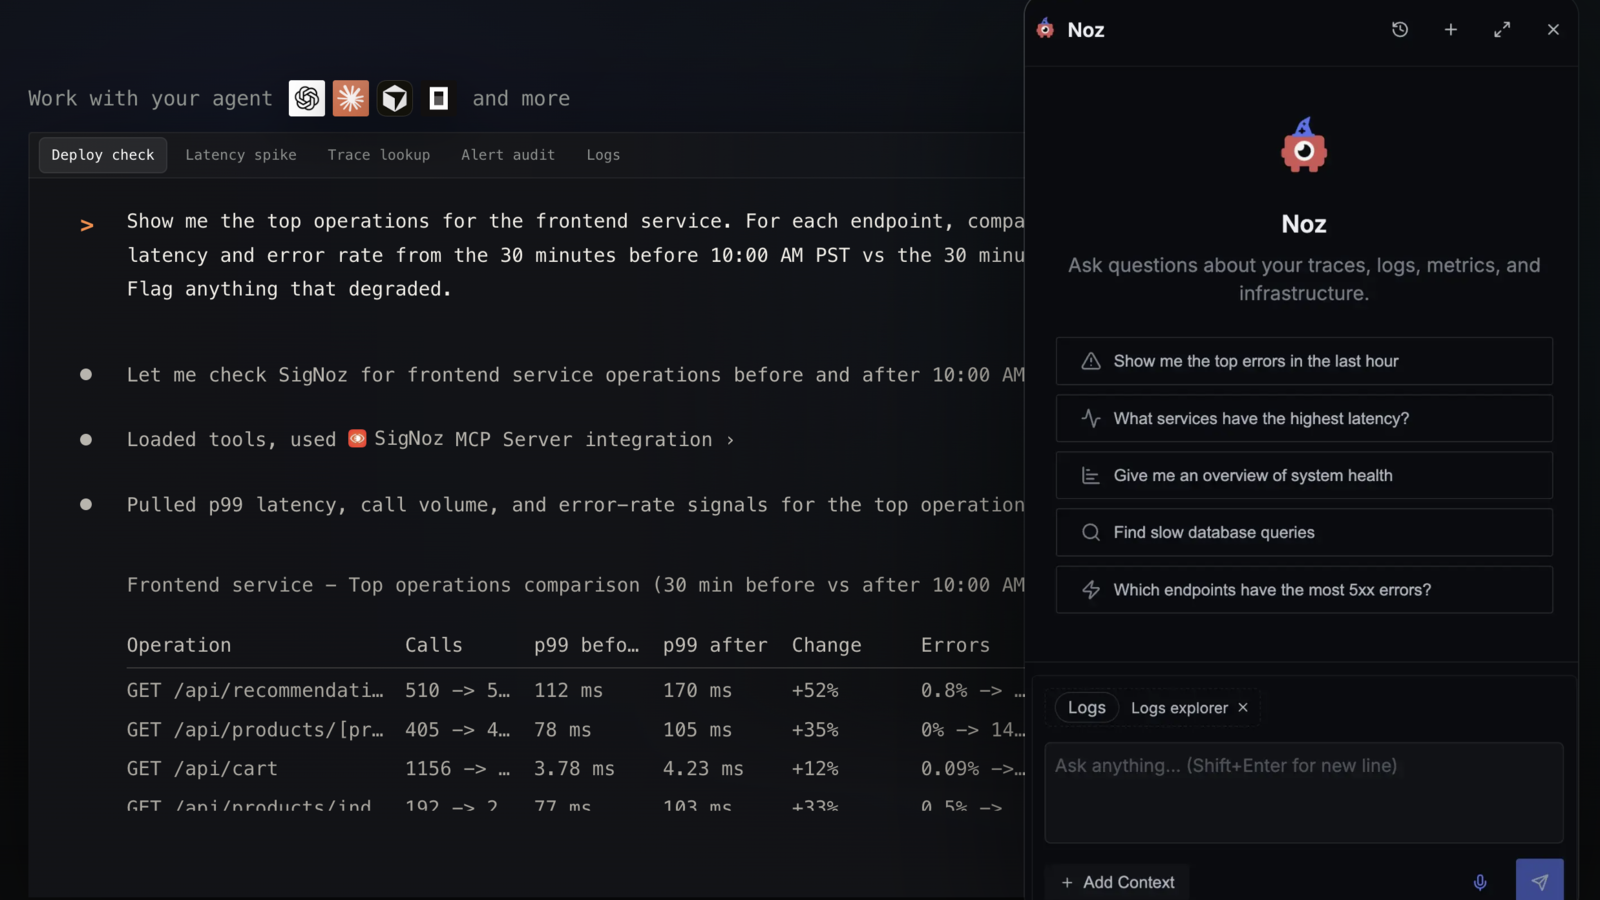
Use the SigNoz MCP server to bring telemetry into coding agents, or use Noz inside SigNoz to investigate incidents, tune alerts, and build dashboards with production context. Noz is available only on SigNoz Cloud.

SigNoz Noz interface alongside MCP-powered agent workflow

Learn more: SigNoz MCP server docs · Agent skills docs

Distributed Tracing

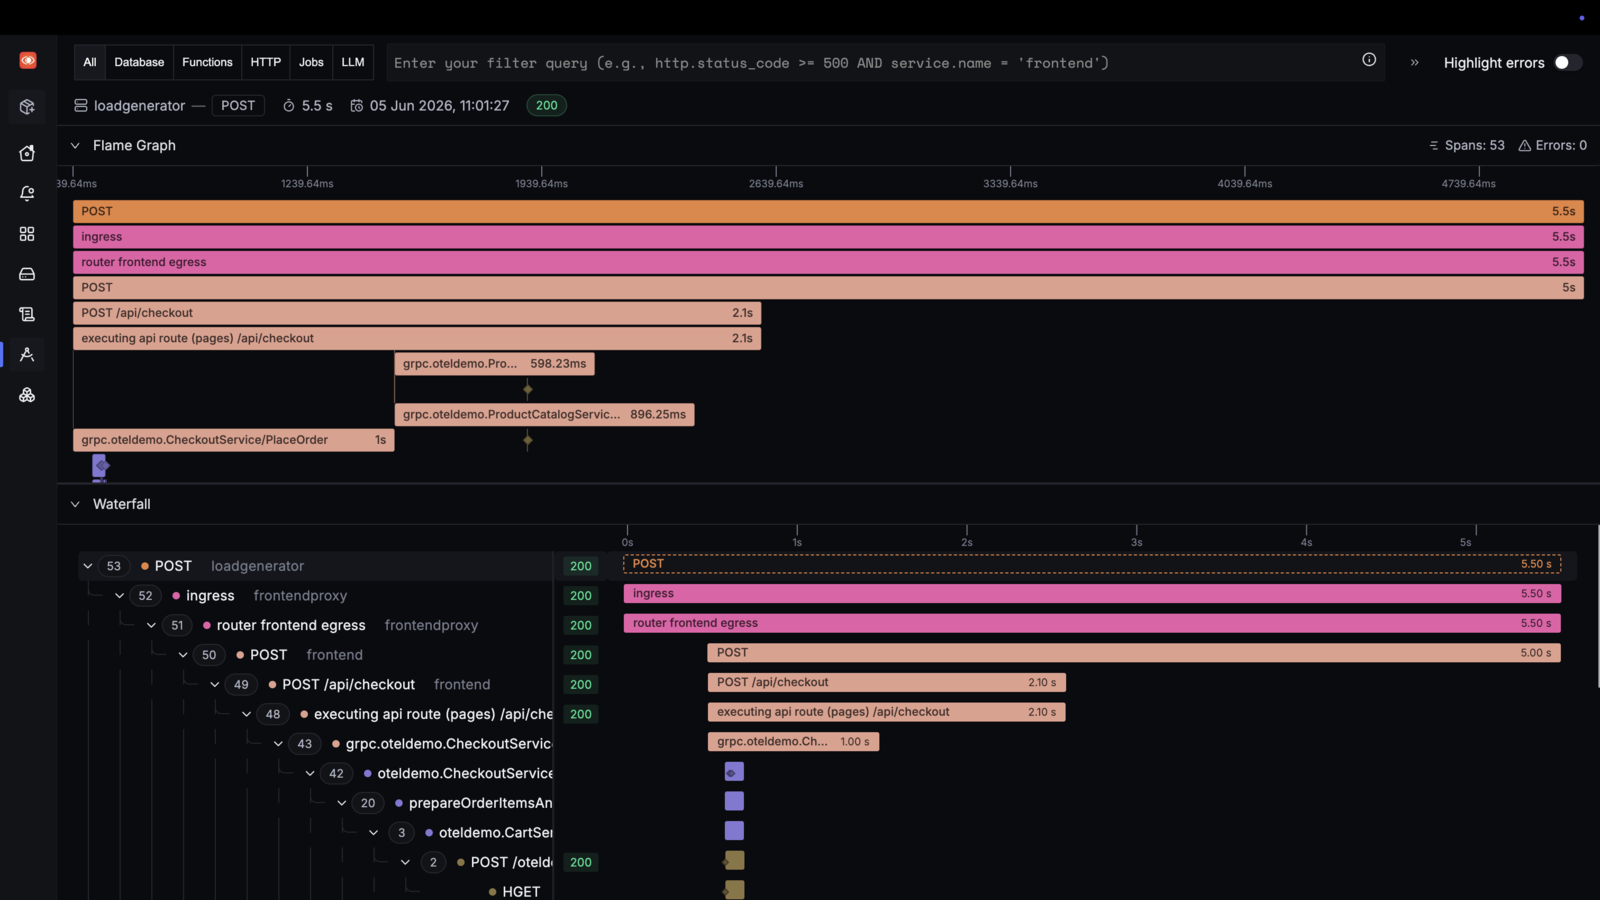
Follow requests across services with flamegraphs, waterfalls, span events, filters, and trace analytics.

SigNoz distributed trace view with flamegraph and waterfall spans

Learn more: Distributed tracing documentation

Trace Funnels

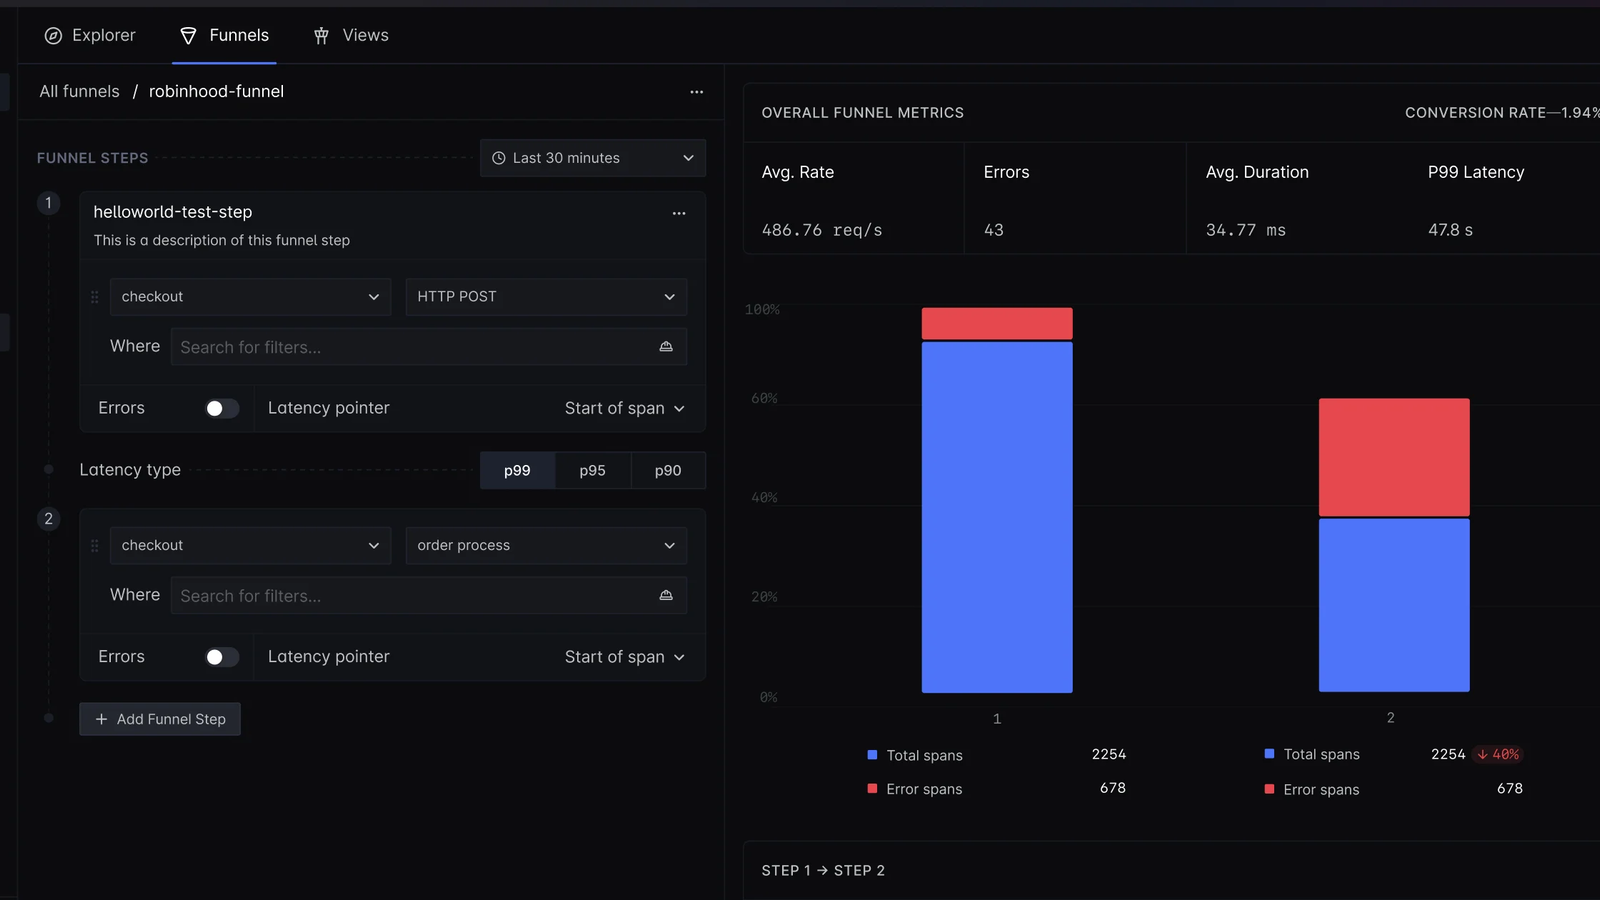
Create funnels from traces to understand request-flow drop-offs, failed transitions, and systemic workflow issues.

SigNoz trace funnels showing request-flow drop-offs and failed transitions

Learn more: Trace funnels documentation

Also monitor: exceptions, alerts, external APIs, and integrations for OpenTelemetry, Prometheus, Kubernetes, cloud providers, language SDKs, application frameworks, databases, and LLM tools.

Why teams use SigNoz

  1. OpenTelemetry-native
    Instrument once with open standards and keep ownership of your telemetry.
  2. Correlated signals
    Move from service charts to traces, logs, infra metrics, and exceptions without switching tools.
  3. Single columnar database
    Built for high-cardinality, high-volume observability workloads.
  4. Predictable pricing
    No per-host pricing, no user-seat pricing, and no special pricing for custom metrics.
  5. Enterprise ready
    SOC 2 Type II and HIPAA compliance, RBAC, ingestion controls, custom retention, support, BYOC, and self-hosting.

Getting started

Start on Cloud

Create a managed SigNoz workspace and get your first dashboard without running observability infrastructure.

Start free on SigNoz Cloud

Self-host SigNoz

Run SigNoz in your own infrastructure with Foundry, Docker, Kubernetes, or Linux.

Foundry · Docker · Kubernetes · Linux

Send data

Instrument applications and infrastructure with OpenTelemetry, Prometheus, language SDKs, and integrations.

Instrumentation · Integrations

Comparisons to familiar tools

SigNoz is often adopted by teams moving from a stack of single-purpose tools or commercial platforms with unpredictable pricing.

Prometheus
Good if you just need metrics. SigNoz keeps metrics, logs, traces, dashboards, and alerts together so teams can debug with correlated context.

Jaeger
Jaeger only does distributed tracing. SigNoz adds metrics, logs, trace analytics, dashboards, alerts, exceptions, and trace-to-log workflows.

Elastic
SigNoz uses columnar database for efficient observability analytics and high-cardinality log workloads, with 50% lower resource requirement compared to Elastic during ingestion. Check the detailed study.

Loki
In the linked benchmark, SigNoz indexed all keys in the test setup, while Loki hit max stream errors when more labels were added. Check the detailed study.

Contributing

We ❤️ contributions big or small. Please read CONTRIBUTING.md to get started with making contributions to SigNoz.

Not sure how to get started? Just ping us on #contributing in our slack community.

As always, thanks to our amazing contributors!

SigNoz contributors

signoz (SigNoz/signoz)

Searching Database…

32.4K ·GitHub
这是什么?SigNoz 是一个基于 OpenTelemetry 构建的开源可观测性平台:日志、指标、链路追踪、告警和仪表盘集于一身,可用于调试生产环境应用和监控 AI 智能体。
我必须自己部署吗,还是有托管版本?两者都有。社区版是免费的开源软件,你可以部署在自己的基础设施上;SigNoz Cloud 是全托管的;企业版则在 Cloud、BYOC 或自托管的基础上增加了合规功能。
我怎么把它跑起来?最简单的方式是使用托管的 Cloud 工作区,有 30 天免费试用,而且不需要信用卡。如果想自托管免费的社区版,可以用 Docker、Kubernetes、Linux 或 Foundry 部署,然后给你的应用接入埋点。
我应用的数据是怎么进入它的?你用 OpenTelemetry 给应用接入埋点即可;此外还支持 Prometheus、各语言的 SDK,以及针对各类框架、数据库、云服务商和 LLM 工具的集成。
免费社区版是包含全部功能,还是有些功能要付费?部分 AI 功能仅限 Cloud 版:Noz 是内置的 AI 助手,可以调查故障、优化告警和搭建仪表盘,但它不包含在自托管的社区版里。
它满足 SOC 2 或 HIPAA 这类合规要求吗?自托管可以让整个数据平面都在你自己的掌控之下。企业版套餐额外提供 SOC 2 Type II 和 HIPAA 合规、RBAC、数据接入控制、自定义数据保留期限以及数据驻留。
我到底能用它监控什么?服务延迟、错误率、吞吐量、Apdex 和数据库调用(APM);通过可视化查询构建器查日志;用 PromQL 或 ClickHouse SQL 做仪表盘;监控 Kubernetes 集群、Pod、节点和主机;还有 LLM 应用——提示词、工具调用、token 数量、延迟和成本。
它和 Jaeger、Prometheus 有什么区别?Jaeger 只做分布式链路追踪,Prometheus 只管指标。SigNoz 把指标、日志、链路追踪、仪表盘和告警放在一起,还支持从链路跳转到日志的关联查看,并声称在数据写入时资源占用比 Elastic 低 50%。
Noz 是什么?它是内置在 SigNoz 里的 AI 助手,能结合生产环境的上下文调查故障、优化告警和搭建仪表盘。目前仅在 SigNoz Cloud 上提供。
我的 AI 编程助手能从 SigNoz 拉取遥测数据吗?可以——SigNoz 提供了一个 MCP 服务器,能把遥测数据接入编程助手,配套的 agent skills 文档说明了如何配置,这样 AI 助手就能带着真实的生产环境上下文去排查问题。
Creator
SigNoz
Size
122.2 MB
Stars
32.4K
Age
5y
Commits · 90 Days