






Что это такое?
 SigNoz — open-source платформа наблюдаемости на базе OpenTelemetry: логи, метрики, трейсы, оповещения и дашборды в одном инструменте для отладки приложений в продакшене и мониторинга AI-агентов.
Мне нужно разворачивать её самому или есть хостинг-версия?И то, и другое. Community-версия — бесплатный open-source софт, который вы разворачиваете на своей инфраструктуре; SigNoz Cloud полностью управляется провайдером; Enterprise добавляет Cloud, BYOC или self-hosted с функциями для соответствия требованиям.
И то, и другое. Community-версия — бесплатный open-source софт, который вы разворачиваете на своей инфраструктуре; SigNoz Cloud полностью управляется провайдером; Enterprise добавляет Cloud, BYOC или self-hosted с функциями для соответствия требованиям.Как её запустить?Проще всего — управляемое рабочее пространство в Cloud с 30-дневным бесплатным пробным периодом и без банковской карты. Чтобы развернуть бесплатную Community-версию у себя, установите её через Docker, Kubernetes, Linux или Foundry, а затем подключите свои приложения.
Проще всего — управляемое рабочее пространство в Cloud с 30-дневным бесплатным пробным периодом и без банковской карты. Чтобы развернуть бесплатную Community-версию у себя, установите её через Docker, Kubernetes, Linux или Foundry, а затем подключите свои приложения.Как данные из моего приложения попадают в неё?Вы инструментируете приложения через OpenTelemetry; также поддерживаются Prometheus, SDK для разных языков и интеграции с фреймворками, базами данных, облачными провайдерами и LLM-инструментами.
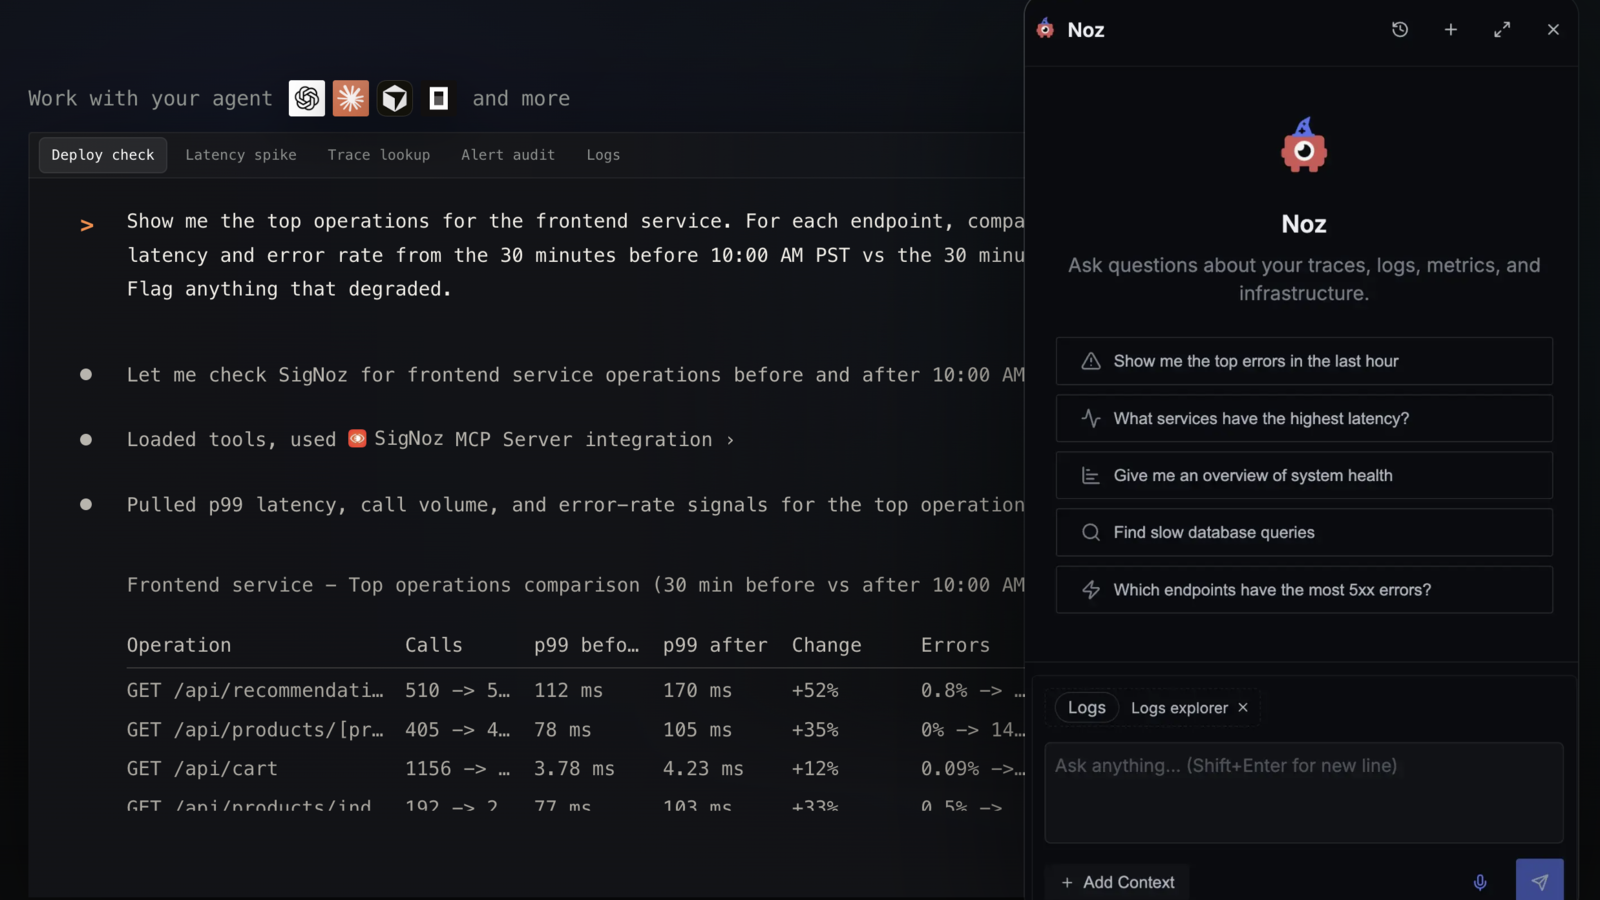
Вы инструментируете приложения через OpenTelemetry; также поддерживаются Prometheus, SDK для разных языков и интеграции с фреймворками, базами данных, облачными провайдерами и LLM-инструментами.Всё есть в бесплатной Community-версии или некоторые функции только платные?Некоторые AI-функции доступны только в Cloud: Noz — встроенный AI-помощник, который разбирает инциденты, настраивает оповещения и создаёт дашборды, — не входит в self-hosted Community-версию.
Некоторые AI-функции доступны только в Cloud: Noz — встроенный AI-помощник, который разбирает инциденты, настраивает оповещения и создаёт дашборды, — не входит в self-hosted Community-версию.Подходит ли она для требований вроде SOC 2 или HIPAA?Self-hosted развёртывание держит весь ваш контур данных под вашим контролем. Тарифы Enterprise добавляют соответствие SOC 2 Type II и HIPAA, RBAC, контроль приёма данных, собственные сроки хранения и размещение данных в выбранной юрисдикции.
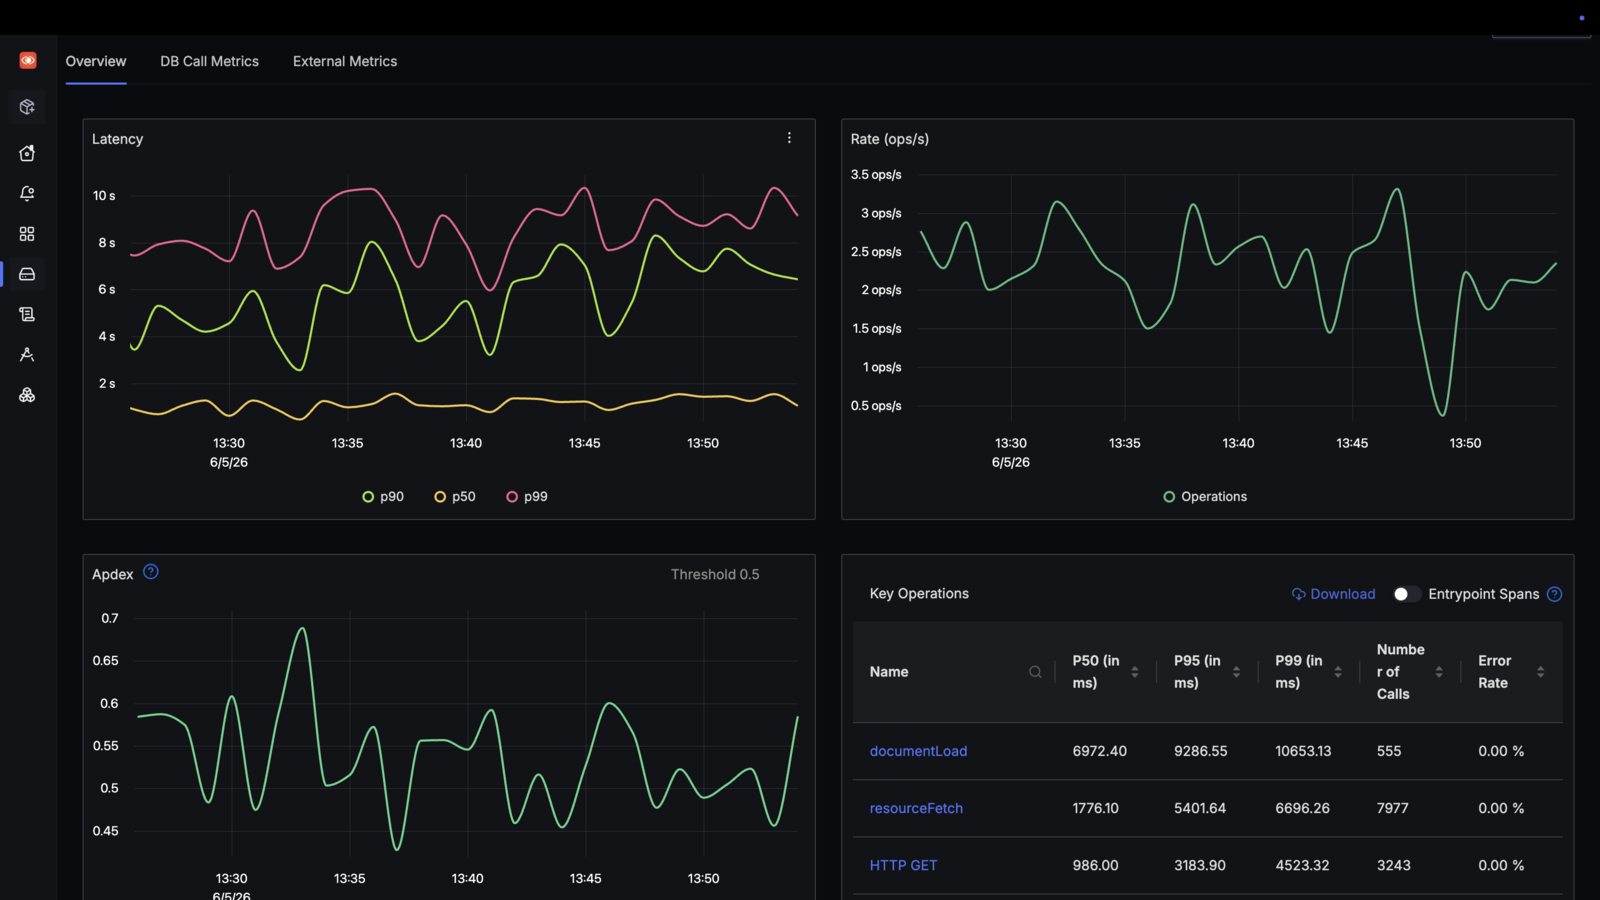
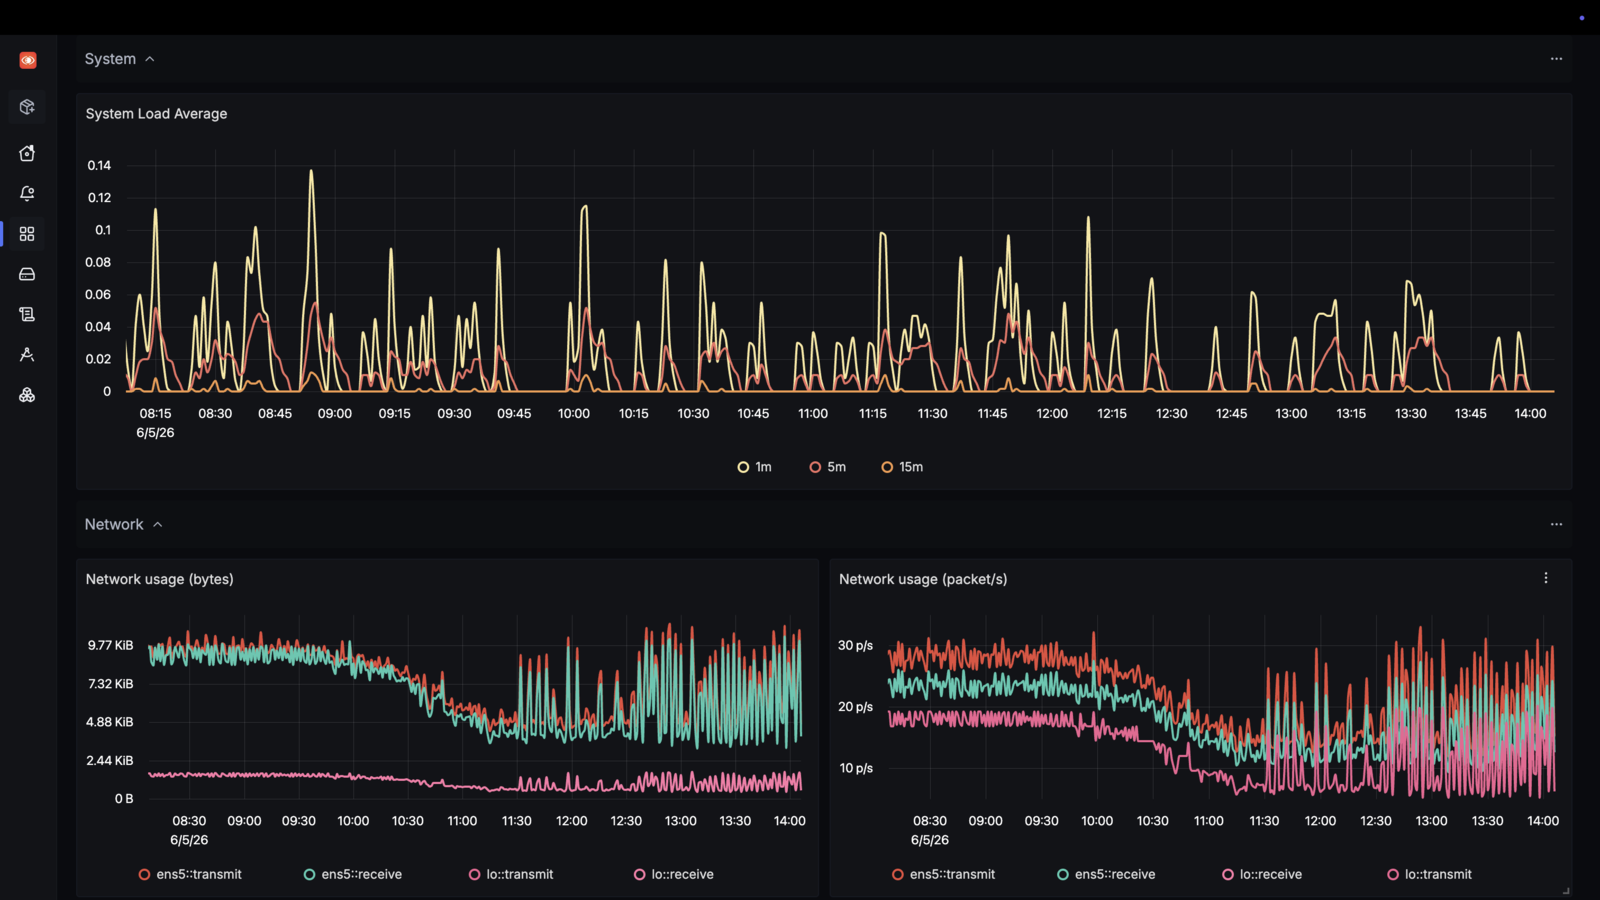
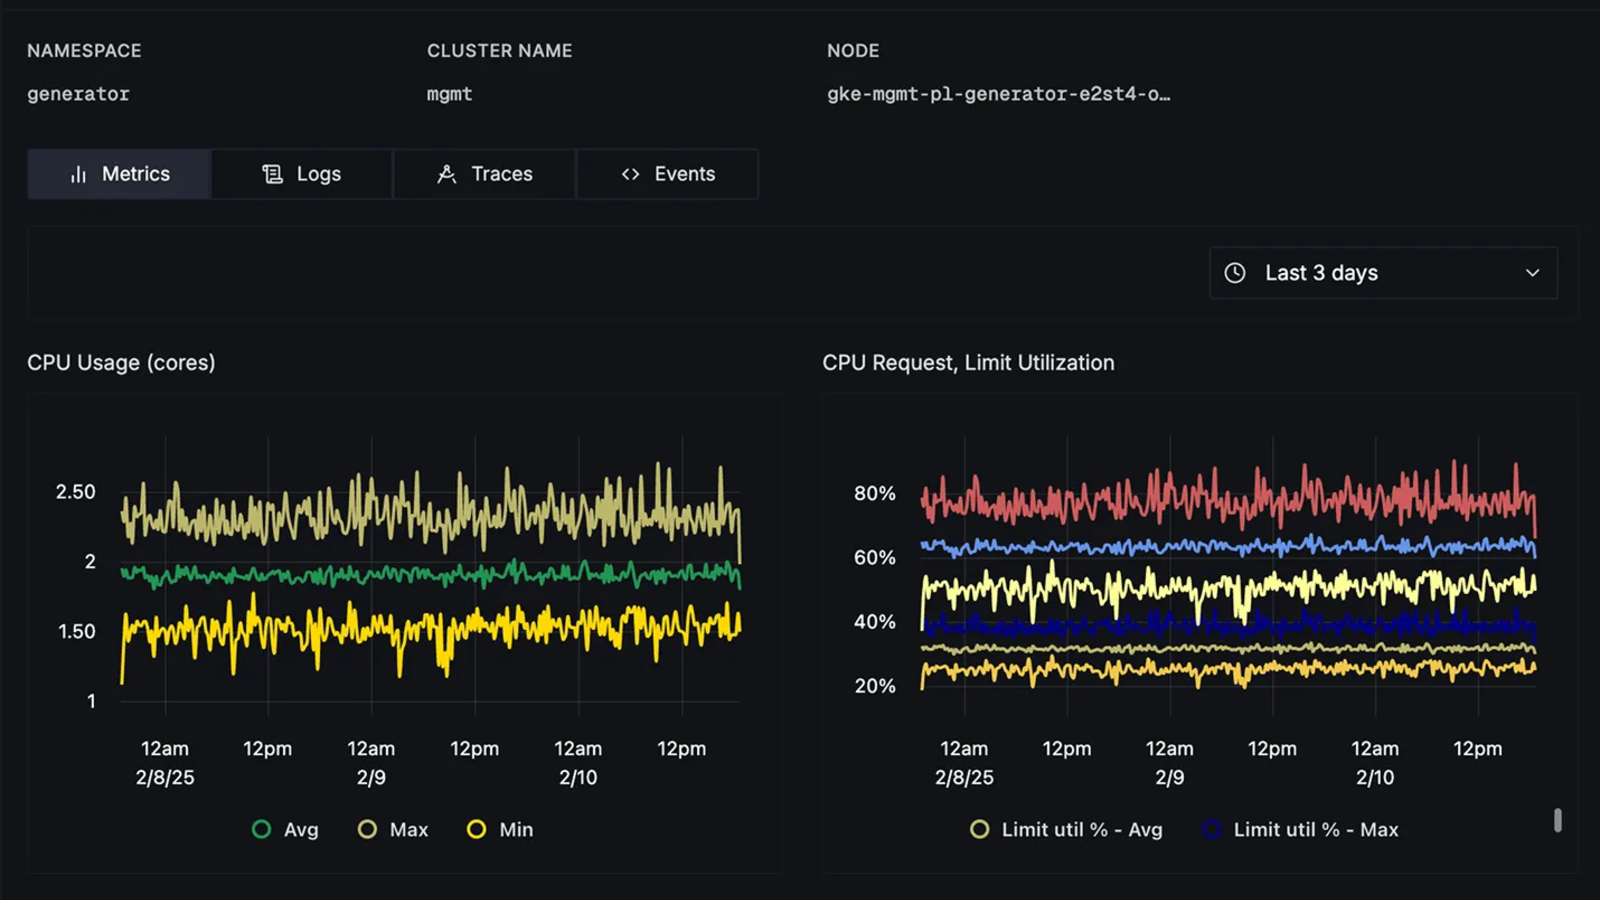
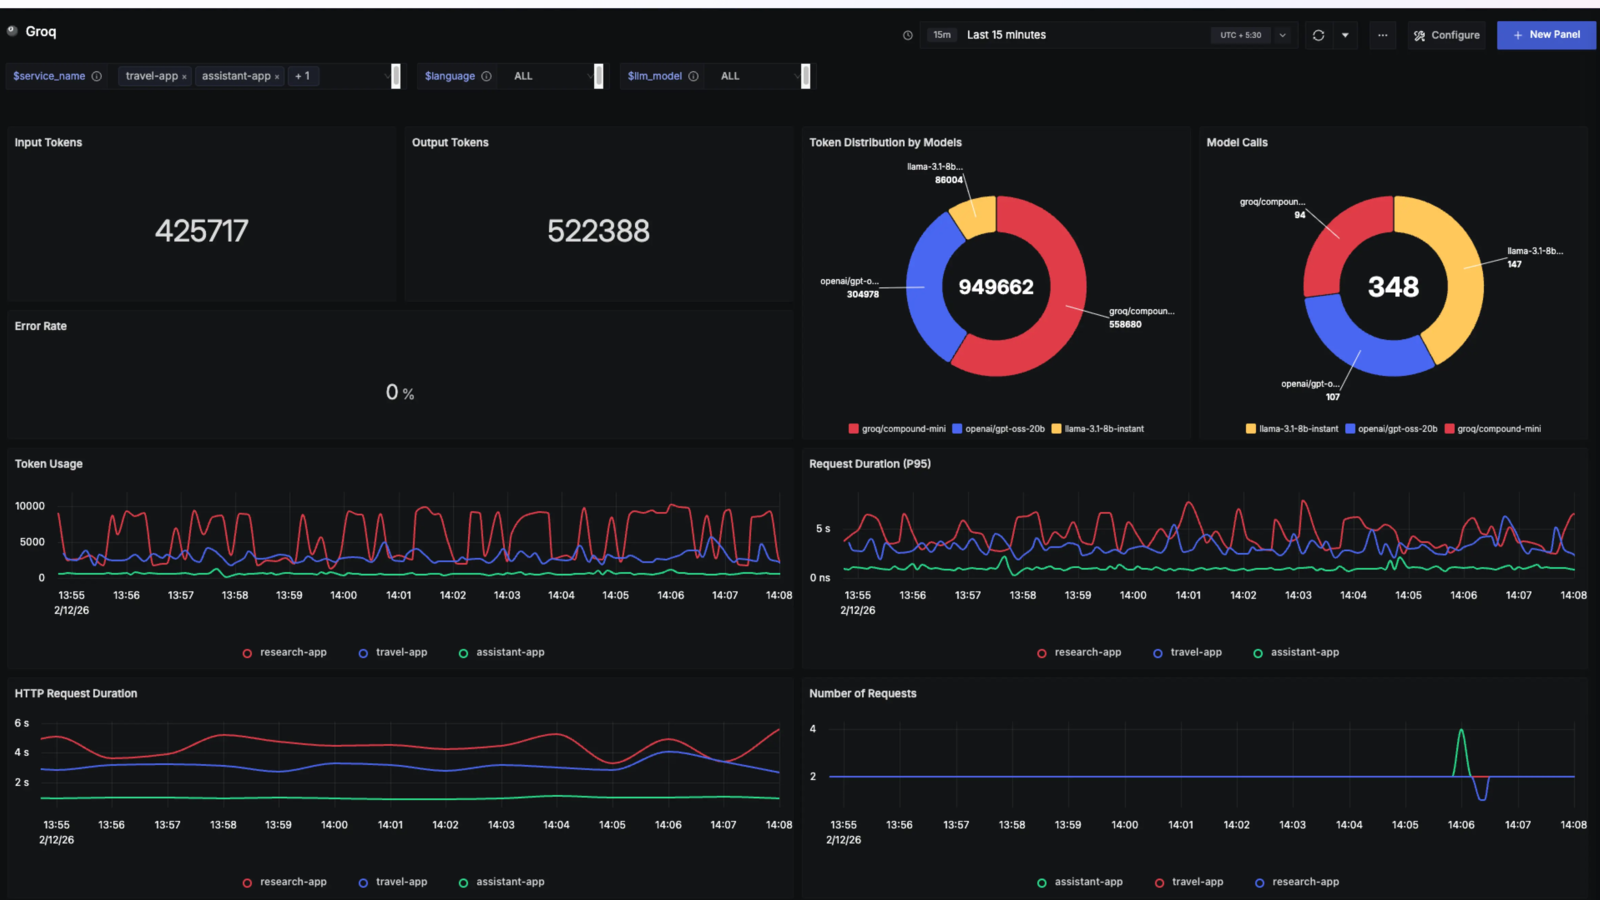
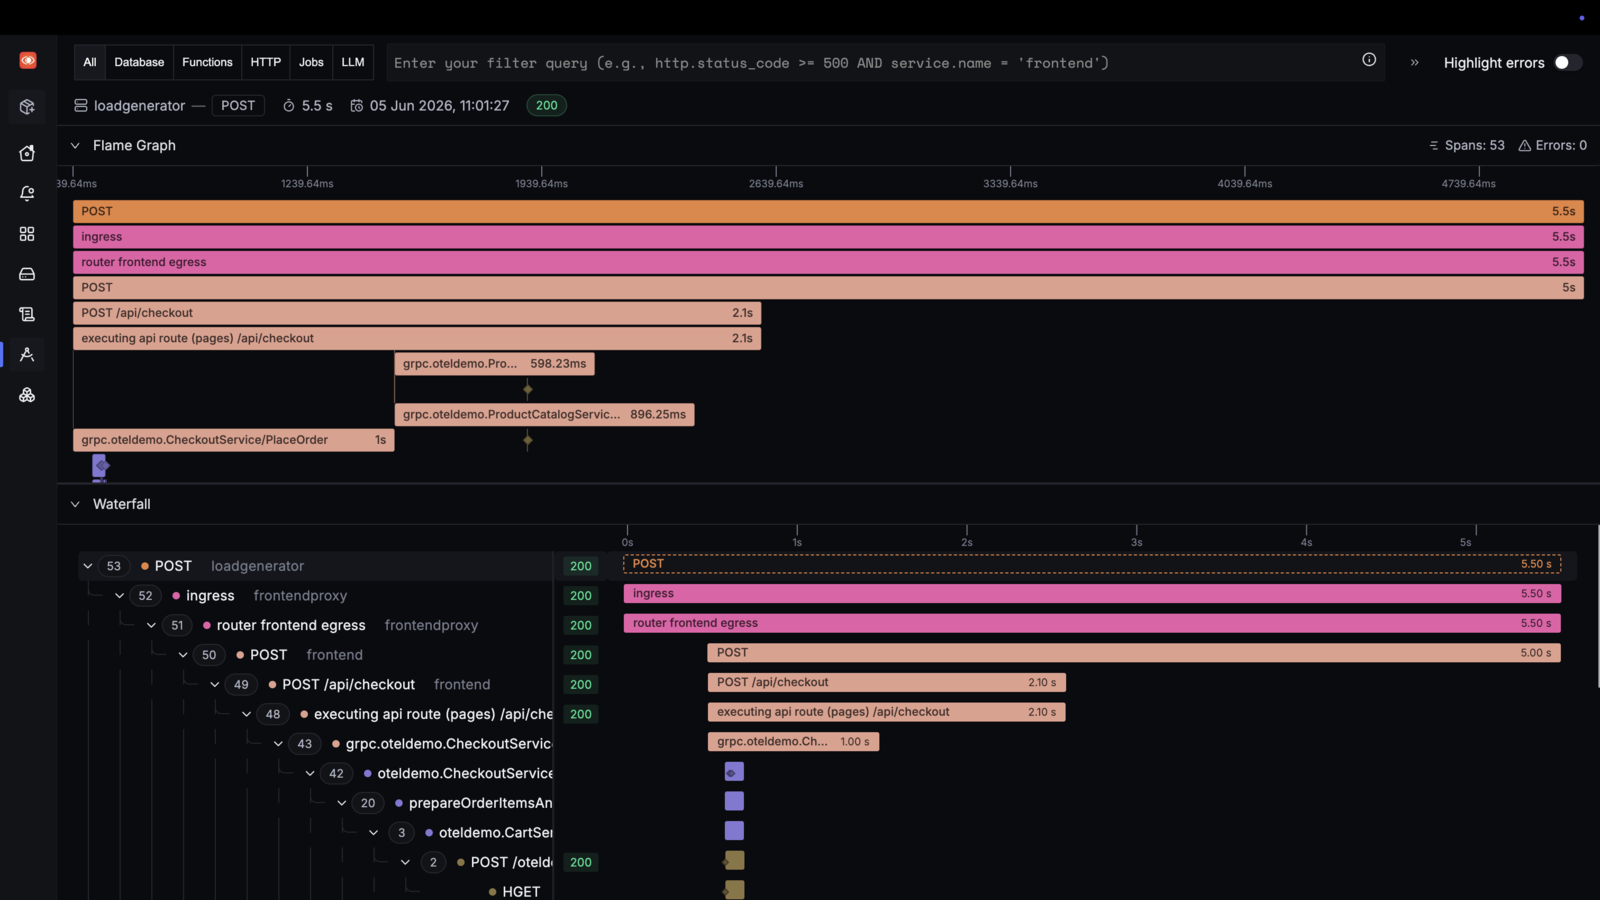
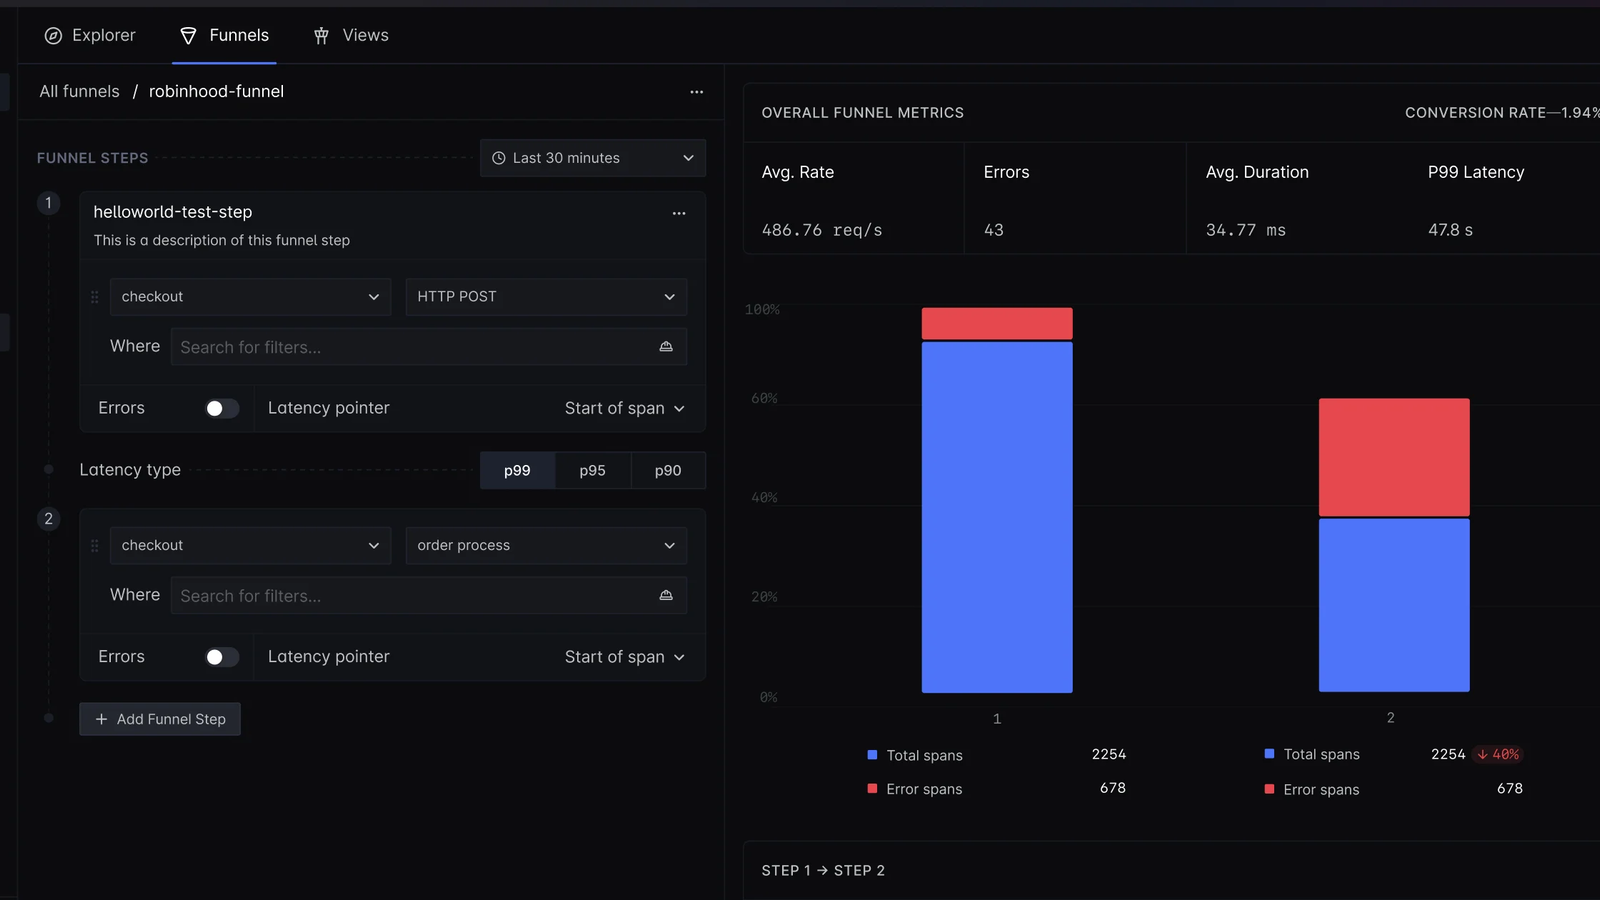
Self-hosted развёртывание держит весь ваш контур данных под вашим контролем. Тарифы Enterprise добавляют соответствие SOC 2 Type II и HIPAA, RBAC, контроль приёма данных, собственные сроки хранения и размещение данных в выбранной юрисдикции.Что конкретно в ней можно мониторить?Задержки сервисов, долю ошибок, пропускную способность, Apdex и обращения к базам данных (APM); логи через визуальный конструктор запросов; дашборды с PromQL или ClickHouse SQL; кластеры, поды и ноды Kubernetes и хосты; плюс LLM-приложения — промпты, вызовы инструментов, токены, задержки и расходы.
Задержки сервисов, долю ошибок, пропускную способность, Apdex и обращения к базам данных (APM); логи через визуальный конструктор запросов; дашборды с PromQL или ClickHouse SQL; кластеры, поды и ноды Kubernetes и хосты; плюс LLM-приложения — промпты, вызовы инструментов, токены, задержки и расходы.Чем она отличается от Jaeger или Prometheus?Jaeger умеет только распределённую трассировку, а Prometheus — только метрики. SigNoz хранит метрики, логи, трейсы, дашборды и оповещения вместе, со связыванием трейсов с логами, и заявляет на 50% меньшие требования к ресурсам, чем Elastic, при приёме данных.
Jaeger умеет только распределённую трассировку, а Prometheus — только метрики. SigNoz хранит метрики, логи, трейсы, дашборды и оповещения вместе, со связыванием трейсов с логами, и заявляет на 50% меньшие требования к ресурсам, чем Elastic, при приёме данных.Что такое Noz?Встроенный в SigNoz AI-помощник, который разбирает инциденты, настраивает оповещения и создаёт дашборды с учётом контекста продакшена. Доступен только в SigNoz Cloud.
Встроенный в SigNoz AI-помощник, который разбирает инциденты, настраивает оповещения и создаёт дашборды с учётом контекста продакшена. Доступен только в SigNoz Cloud.Может ли мой AI-агент для кодинга получать телеметрию из SigNoz?Да — MCP-сервер SigNoz передаёт телеметрию в кодинг-агентов, а документация по навыкам агентов показывает, как это настроить, чтобы агенты разбирали проблемы с реальным продакшен-контекстом.
Да — MCP-сервер SigNoz передаёт телеметрию в кодинг-агентов, а документация по навыкам агентов показывает, как это настроить, чтобы агенты разбирали проблемы с реальным продакшен-контекстом.What are similar projects?openobserve, jaeger, grafana, nightingale, VictoriaMetrics, serve, Tracely-ai, lago
openobserve, jaeger, grafana, nightingale, VictoriaMetrics, serve, Tracely-ai, lagoWhich topics is it in?distributed-tracing, logs, apm, log, dashboards, llm-observability, good-first-issue, alerting, tracing, telemetry, opentelemetry, clickhouse
distributed-tracing, logs, apm, log, dashboards, llm-observability, good-first-issue, alerting, tracing, telemetry, opentelemetry, clickhouse