English | Español | Français | Deutsch | 中文 | Türkçe | 日本語 | 한국어 | Русский
[!NOTE]
The English README is the source of truth for the API reference, installation, and development instructions. Translated READMEs are community-maintained and may lag behind this file.

PyGWalker: A Python Library for Exploratory Data Analysis with Visualization








PyGWalker can simplify your Jupyter Notebook data analysis and data visualization workflow, by turning your pandas dataframe into an interactive user interface for visual exploration.
PyGWalker (pronounced like "Pig Walker", just for fun) is named as an abbreviation of "Python binding of Graphic Walker". It integrates Jupyter Notebook with Graphic Walker, an open-source alternative to Tableau. It allows data scientists to visualize / clean / annotates the data with simple drag-and-drop operations and even natural language queries.
https://github.com/Kanaries/pygwalker/assets/22167673/2b940e11-cf8b-4cde-b7f6-190fb10ee44b
[!TIP]
If you want more AI features, we also build runcell, an AI Code Agent in Jupyter that understands your code/data/cells and generate code, execute cells and take actions for you. It can be used in jupyter lab with pip install runcell
https://github.com/user-attachments/assets/9ec64252-864d-4bd1-8755-83f9b0396d38
Visit Google Colab, Kaggle Code or Graphic Walker Online Demo to test it out!
If you prefer using R, check GWalkR, the R wrapper of Graphic Walker.
If you prefer a Desktop App that can be used offline and without any coding, check out PyGWalker Desktop.
Features
PyGWalker is a Python library that simplifies data analysis and visualization workflows by turning pandas, polars, and pyarrow table data into interactive visual interfaces.
It offers a variety of features that make it a powerful tool for data exploration:
Interactive Data Exploration:
- Drag-and-drop interface for easy visualization creation.
- Real-time updates as you make changes to the visualization.
- Ability to zoom, pan, and filter the data.
-
- Visual data cleaning tools to identify and remove outliers or inconsistencies.
- Ability to create new variables and features based on existing data.
Advanced Visualization Capabilities:
- Support for various chart types (bar charts, line charts, scatter plots, etc.).
- Customization options for colors, labels, and other visual elements.
- Interactive features like tooltips and drill-down capabilities.
Integration with Jupyter Notebooks:
- Seamless integration with Jupyter Notebooks for a smooth workflow.
Open-Source and Free:
- Available for free and allows for customization and extension.
Getting Started
Check our video tutorial about using pygwalker, pygwalker + streamlit and pygwalker + snowflake, How to explore data with PyGWalker in Python
Setup pygwalker
Before using pygwalker, make sure to install the packages through the command line using pip or conda.
pip
pip install pygwalker
Note
For an early trial, you can install with pip install pygwalker --upgrade to keep your version up to date with the latest release or even pip install pygwalker --upgrade --pre to obtain latest features and bug-fixes.
Conda-forge
conda install -c conda-forge pygwalker
or
mamba install -c conda-forge pygwalker
See conda-forge feedstock for more help.
Use pygwalker in Jupyter Notebook
Quick Start
Import pygwalker and pandas to your Jupyter Notebook to get started.
import pandas as pd
import pygwalker as pyg
You can use pygwalker without breaking your existing workflow. For example, you can call up PyGWalker with the dataframe loaded in this way:
df = pd.read_csv('./bike_sharing_dc.csv')
walker = pyg.walk(df)
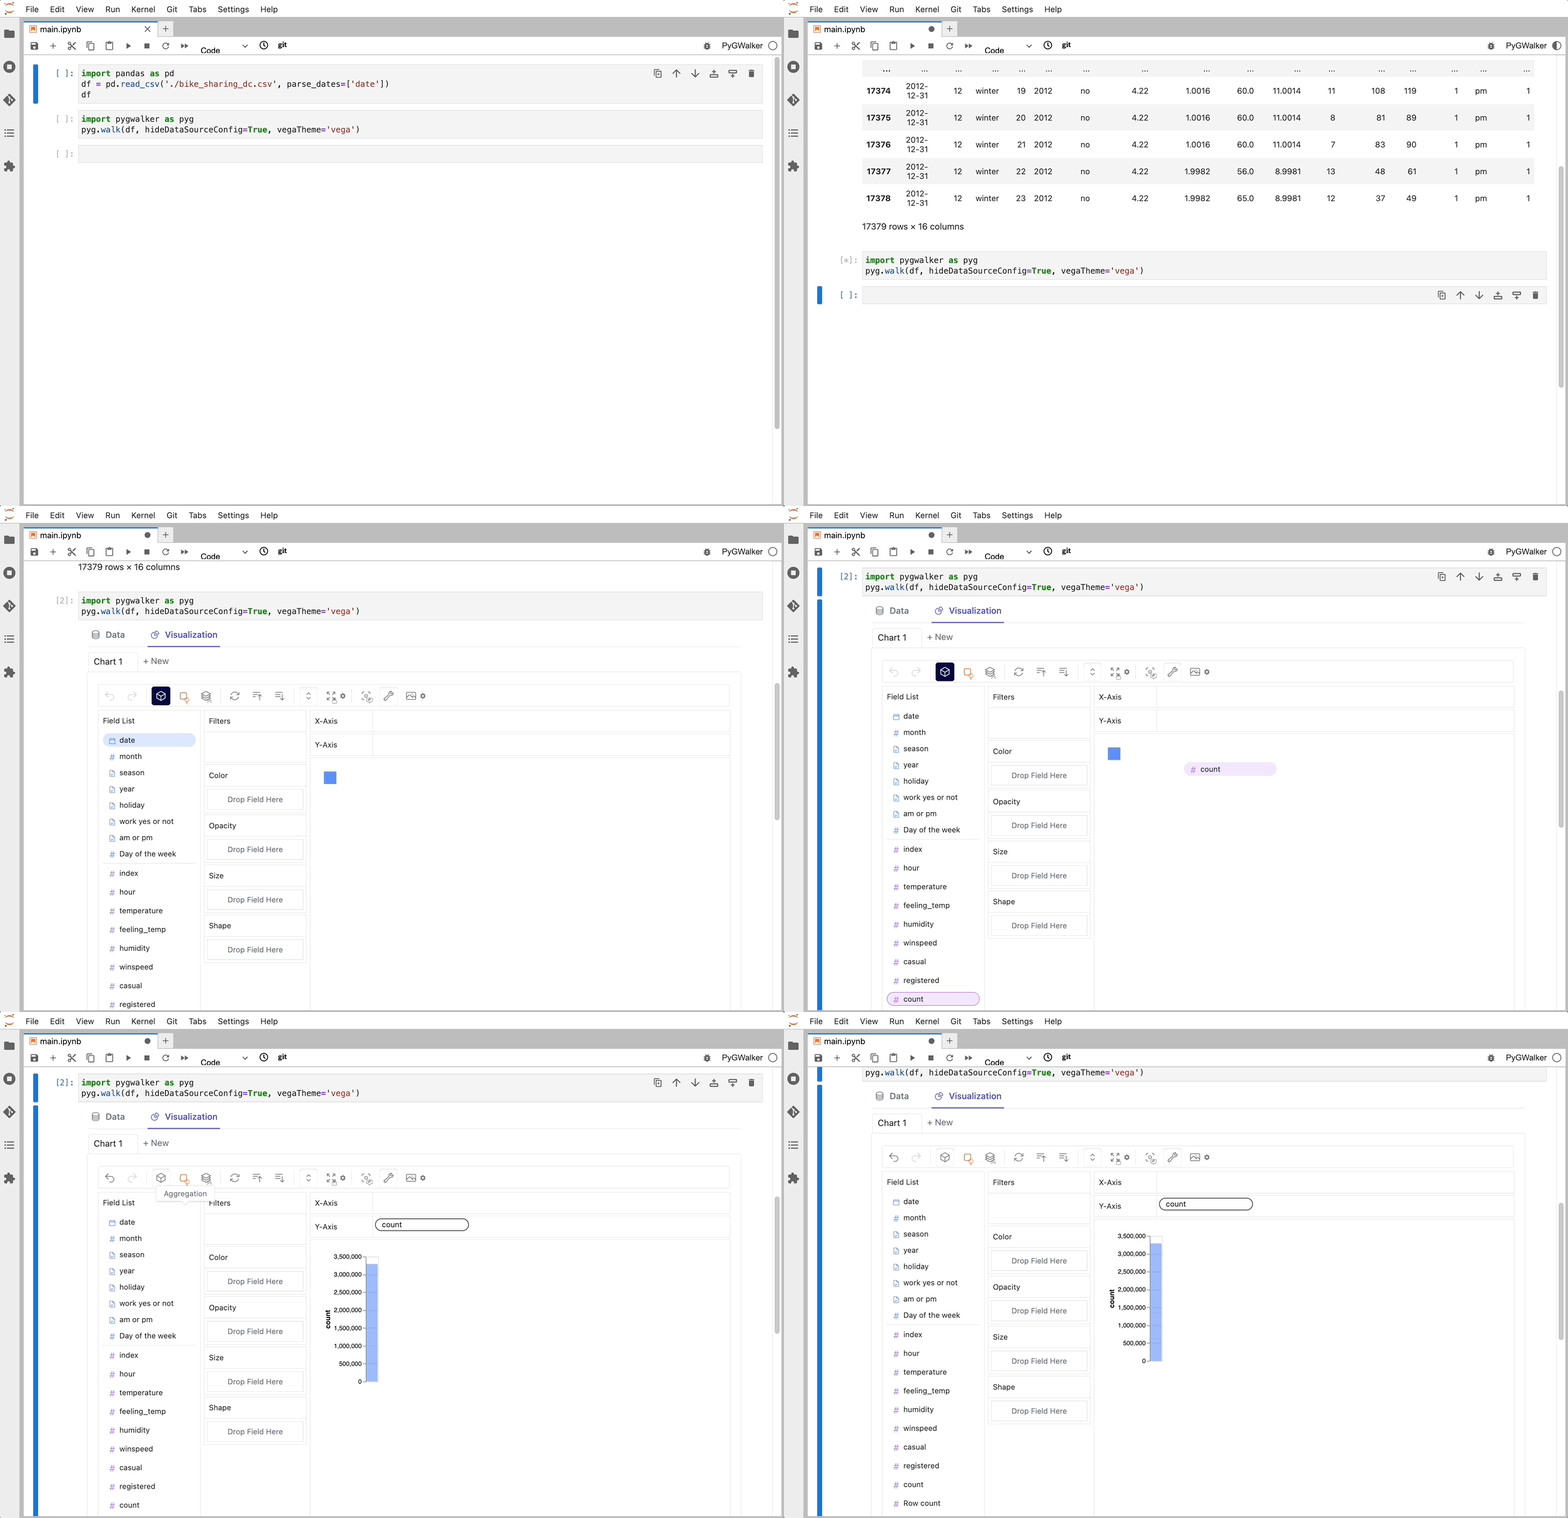
That's it. Now you have an interactive UI to analyze and visualize data with simple drag-and-drop operations.
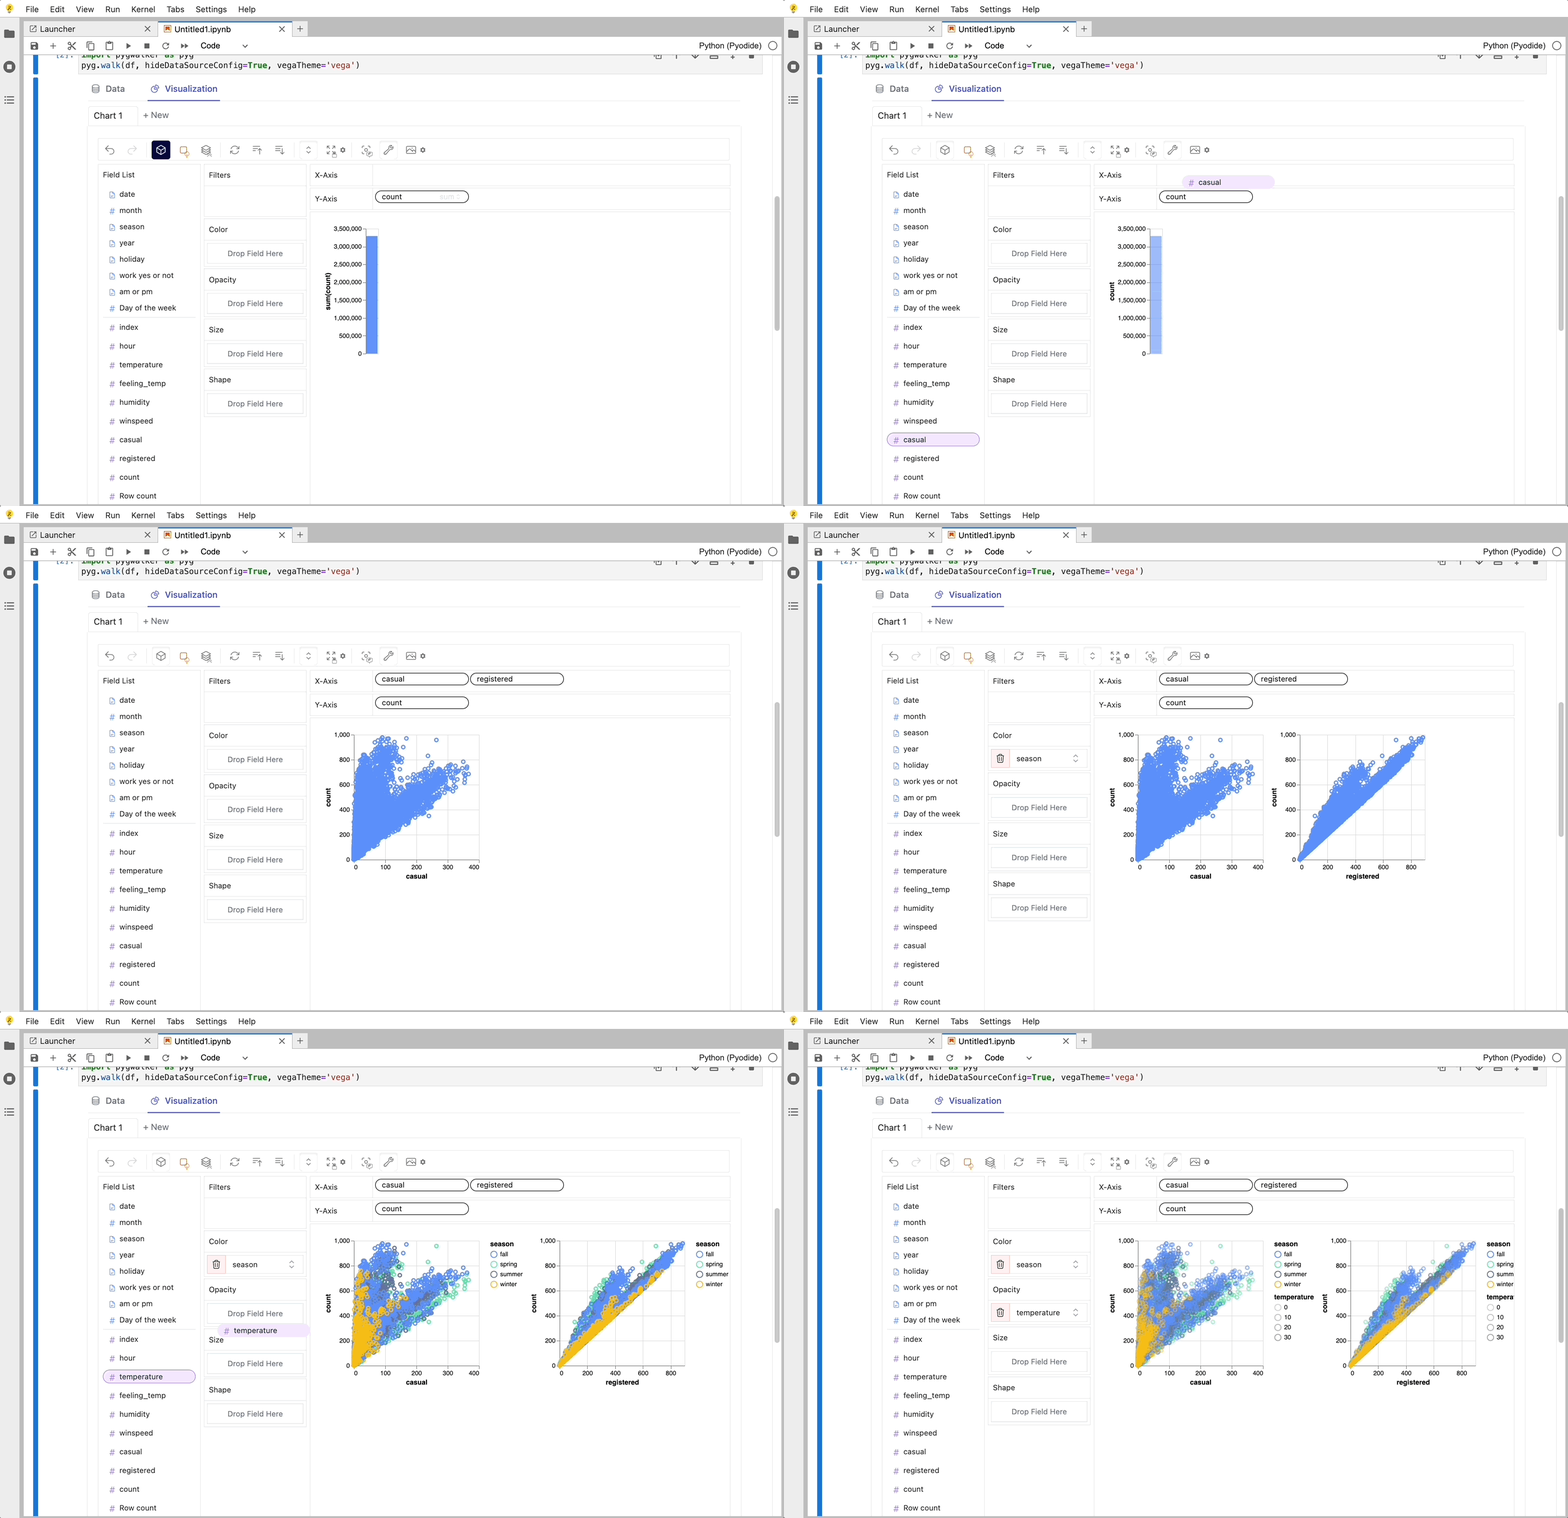
Cool things you can do with PyGwalker:
You can change the mark type into others to make different charts, for example, a line chart:

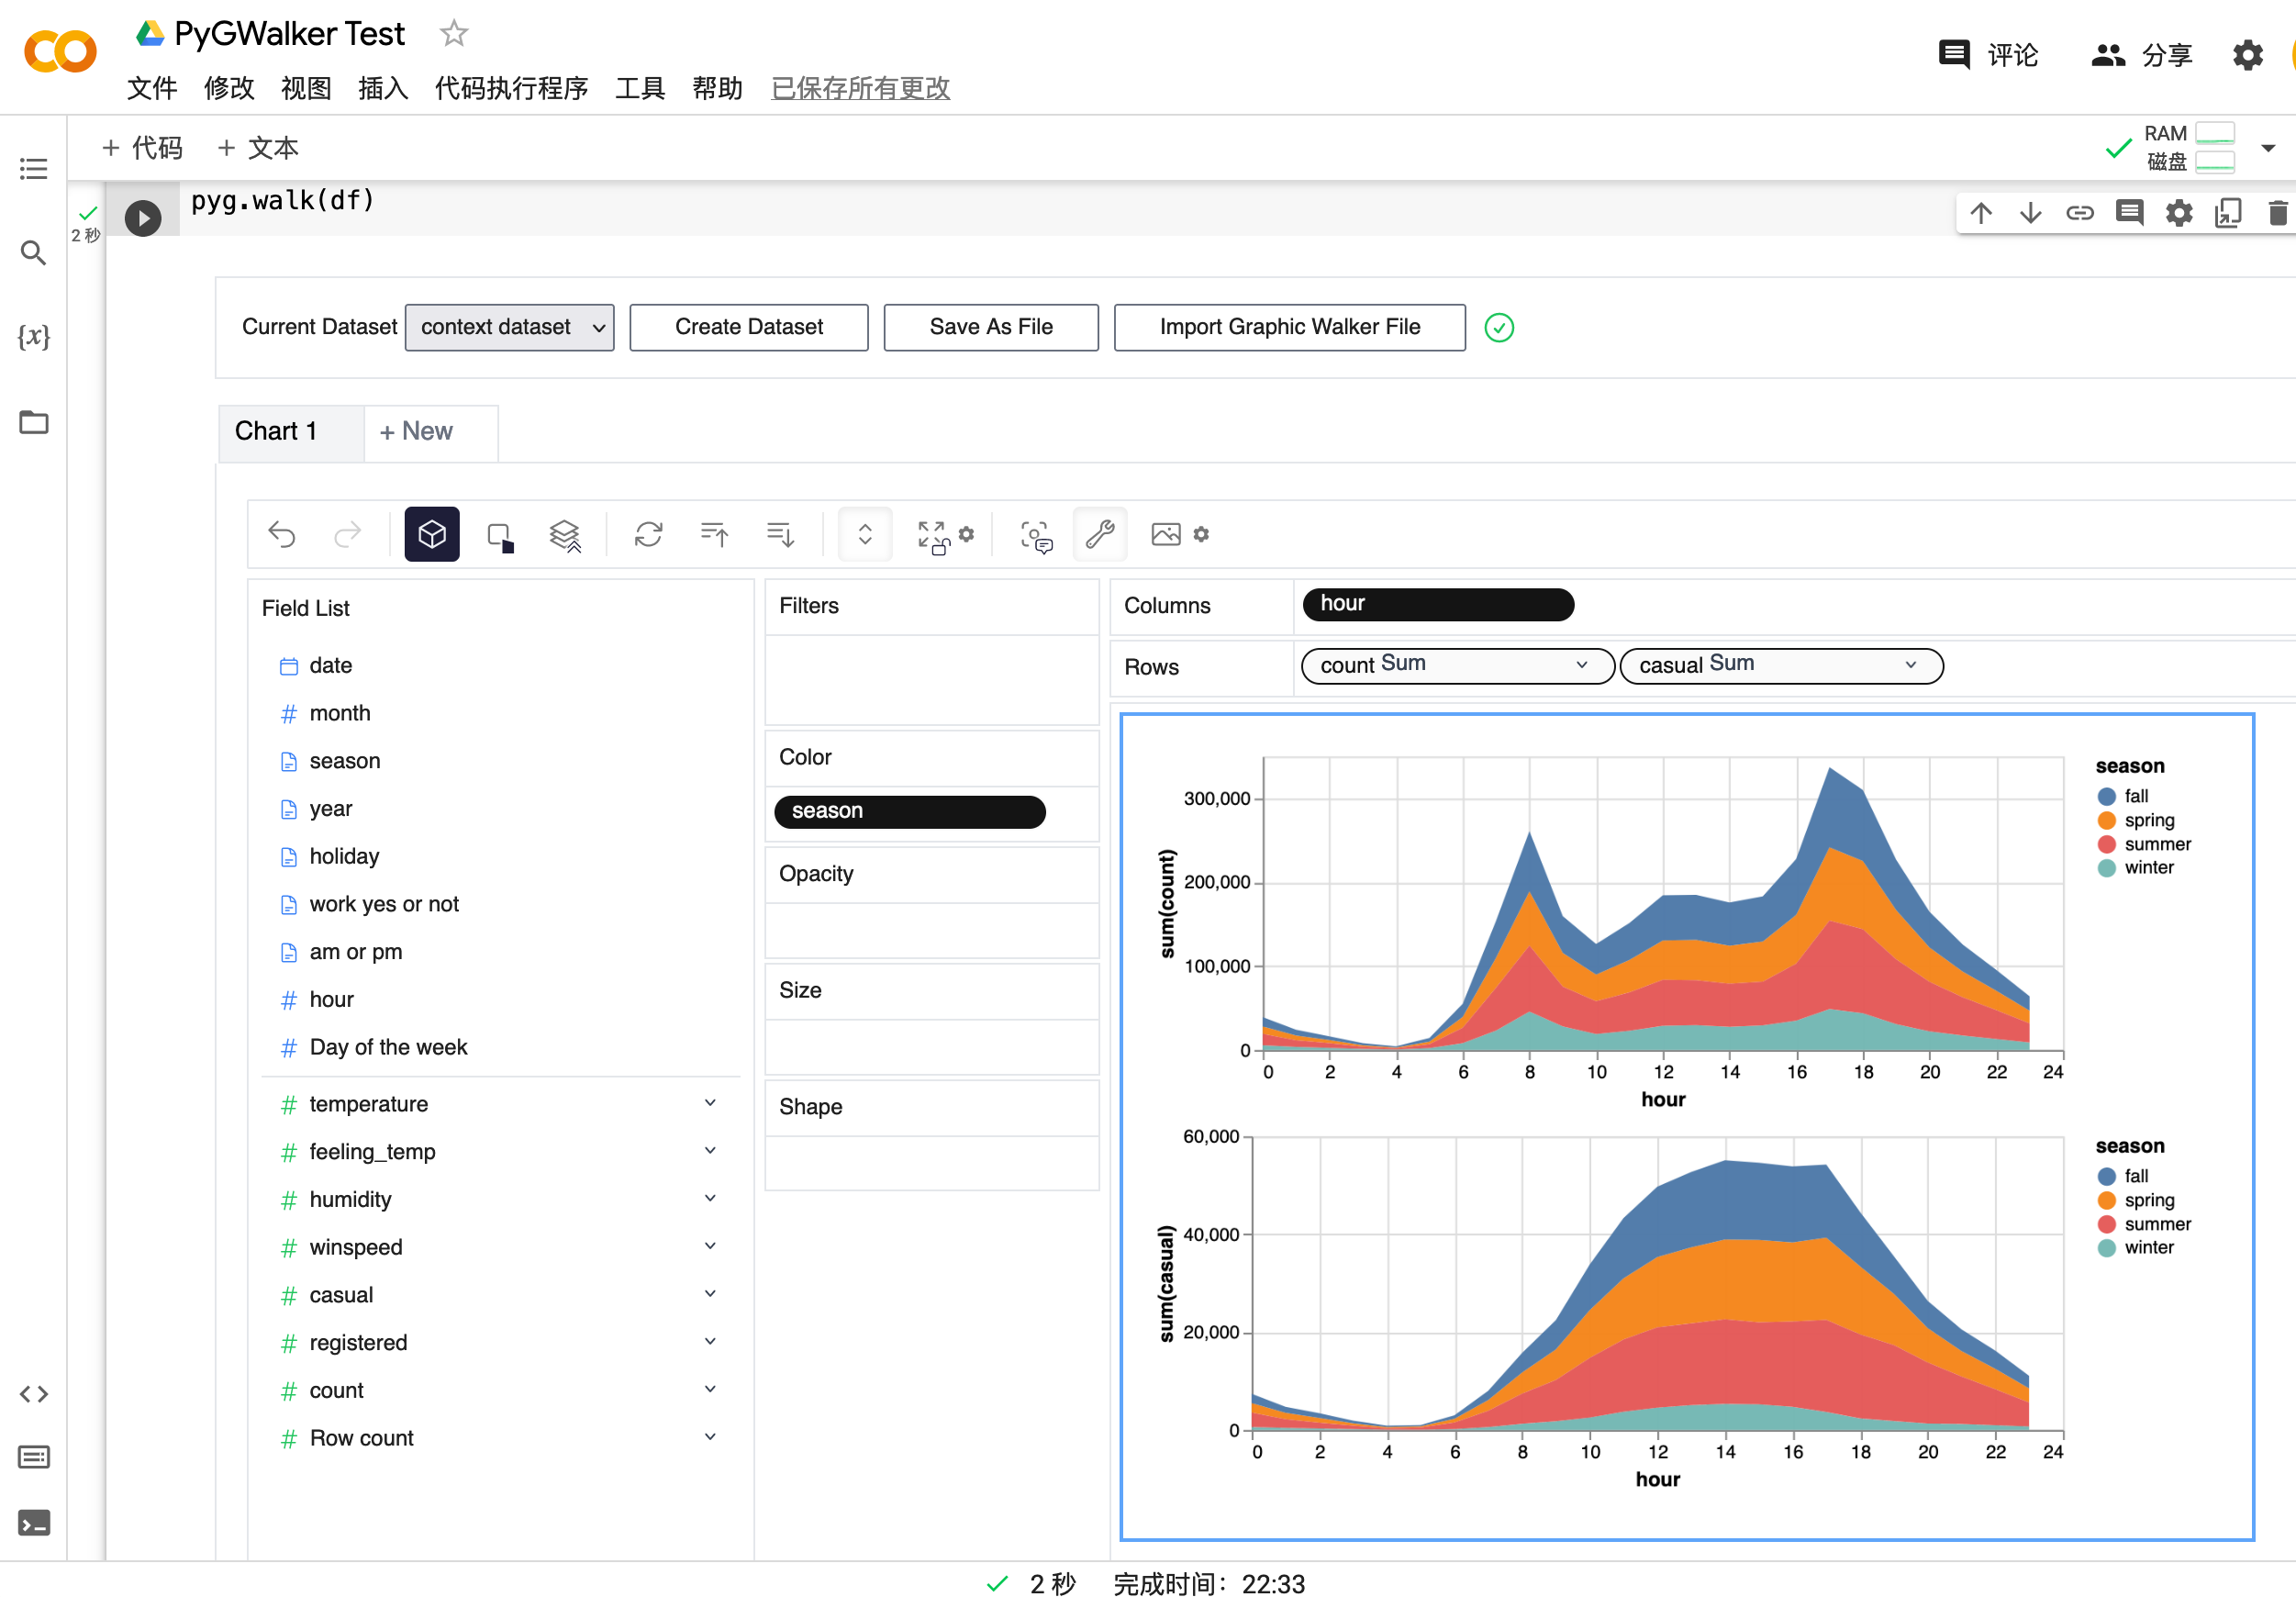
To compare different measures, you can create a concat view by adding more than one measure into rows/columns.

To make a facet view of several subviews divided by the value in dimension, put dimensions into rows or columns to make a facets view.

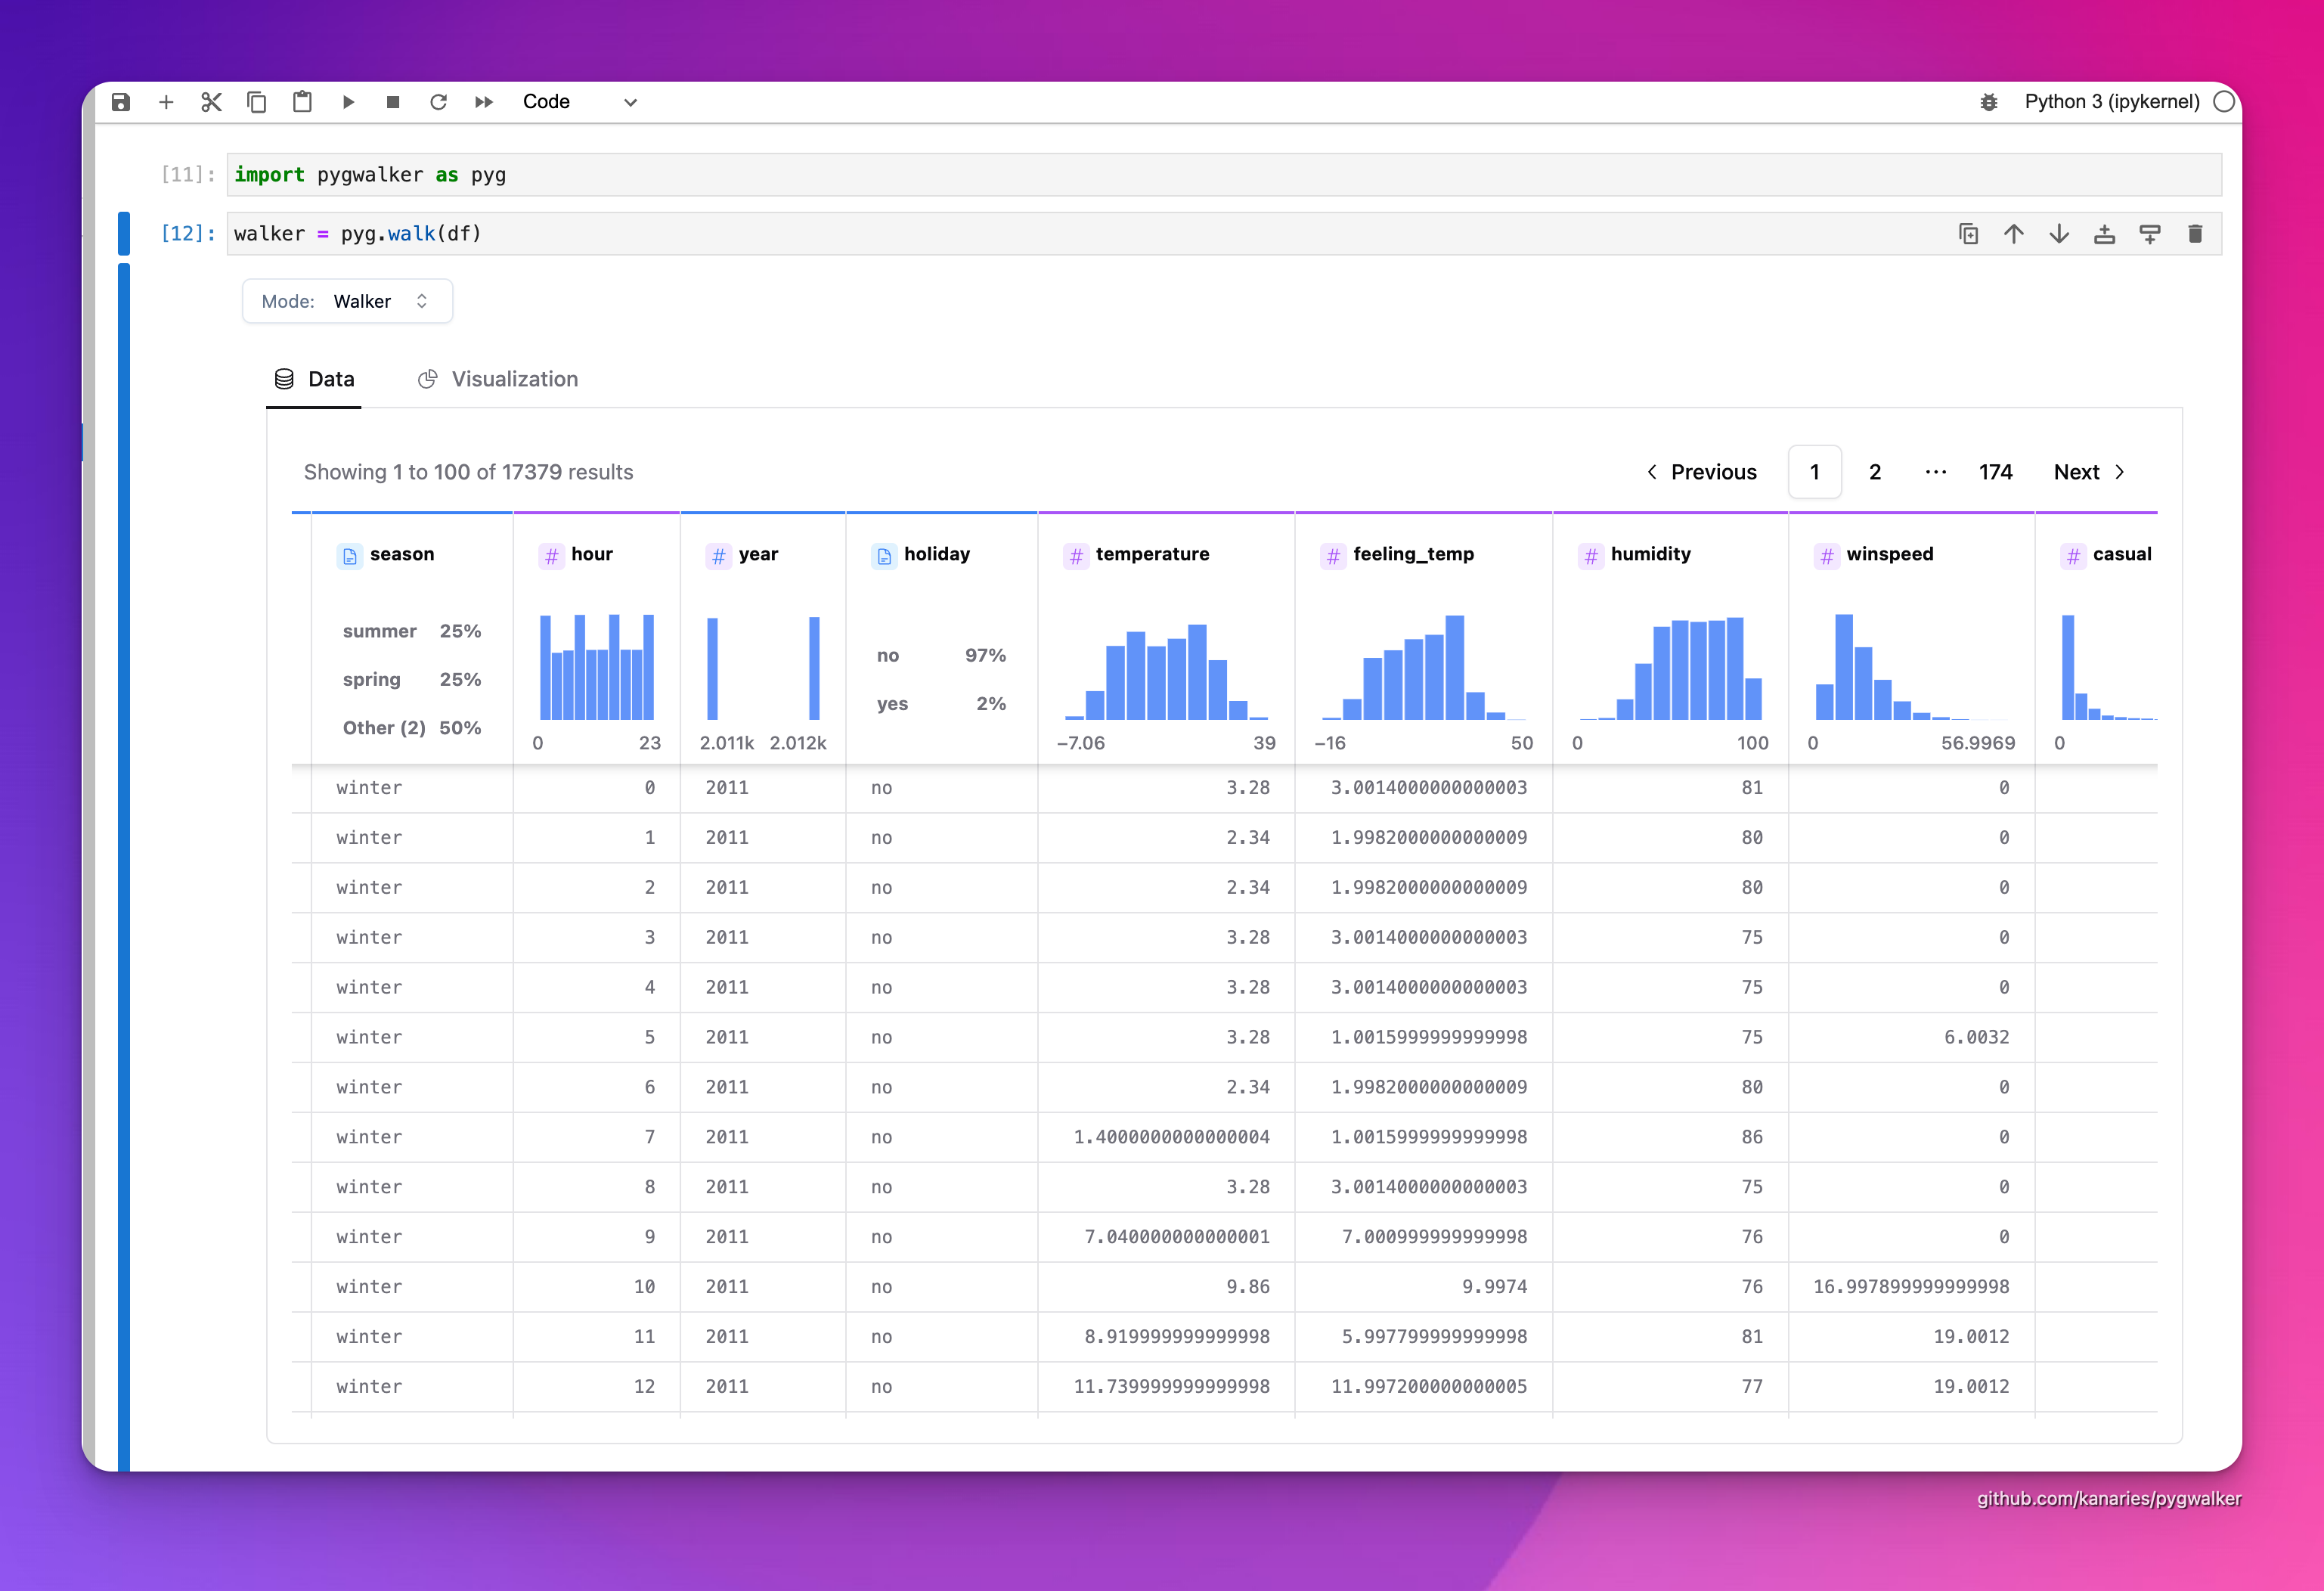
PyGWalker contains a powerful data table, which provides a quick view of data and its distribution, profiling. You can also add filters or change the data types in the table.
- You can save the data exploration result to a local file
Better Practices
There are some important parameters you should know when using pygwalker:
spec_path: local file path for saving/loading chart config.spec: chart config object, JSON string, config ID, or remote URL.computation: choose where data queries run. Use "browser" for frontend-only computation, "kernel" for local DuckDB-backed Python computation, "cloud" for Kanaries cloud computation, or omit it for the default automatic behavior.kernel_computation: legacy boolean for using DuckDB as computing engine. Prefer computation="kernel" or computation="browser"; this legacy flag is scheduled for removal in PyGWalker 0.7.0.cloud_computation: legacy boolean for Kanaries cloud computation. Prefer computation="cloud"; this legacy flag is scheduled for removal in PyGWalker 0.7.0.use_kernel_calc: deprecated alias for kernel computation. Prefer computation="kernel" or computation="browser"; this legacy flag is scheduled for removal in PyGWalker 0.7.0.
df = pd.read_csv('./bike_sharing_dc.csv')
walker = pyg.walk(
    df,
    spec_path="./chart_meta_0.json",  # local file used to load and save chart state.
    computation="kernel",          # use DuckDB in the Python kernel for larger datasets.
)
For new code on the 0.6 line, prefer a reusable Walker object and choose where to render it:
walker = pyg.Walker(df, spec_path="./chart_meta_0.json", computation="browser")
walker.show()       # auto-detects notebook or script mode
html = walker.to_html()
html = pyg.to_html(walker)
See PyGWalker 0.6 Release Notes for the compatibility policy, deprecation timeline, and tested runtime support.
After exploring in the UI, export the current chart state as reproducible Python code:
code = walker.to_code(dataset_name="df")
print(code)
If you have an older saved spec, migrate it to the current schema before committing it:
migrated_spec = pyg.spec.migrate(open("./old_chart_meta.json").read())
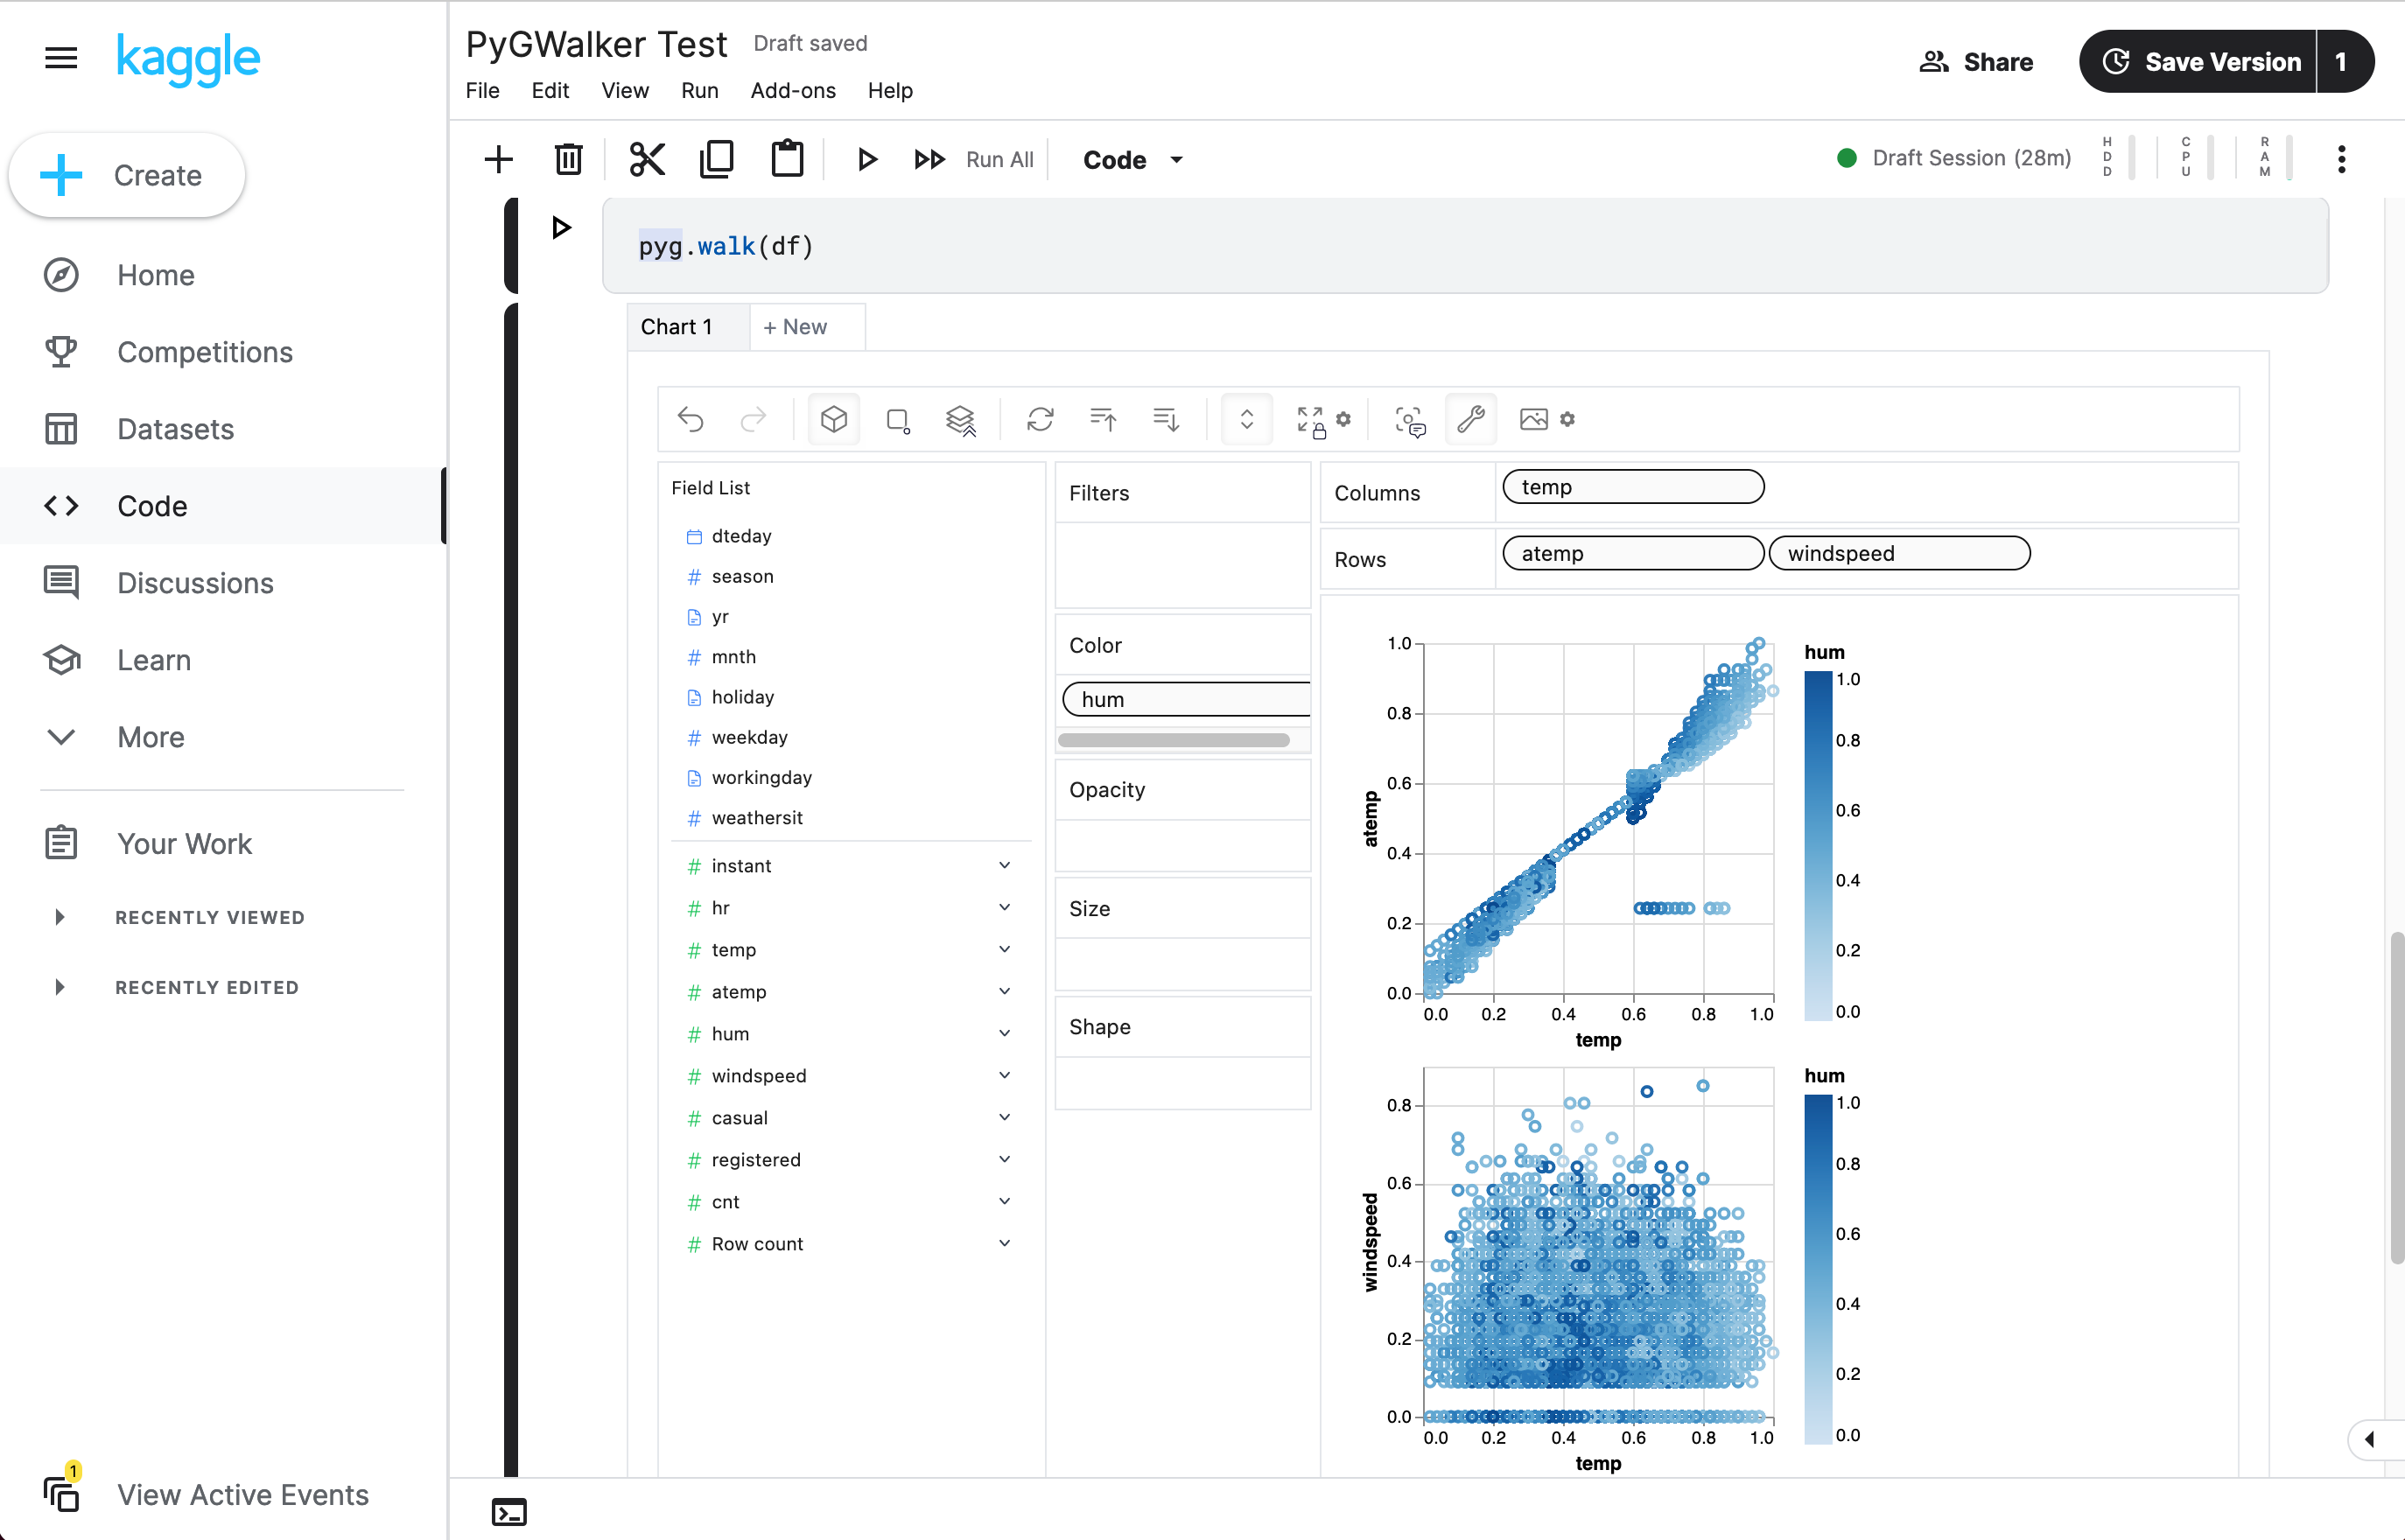
Example in local notebook
Example in cloud notebook
Programmatic Export of Charts
After saving a chart from the UI, you can retrieve the image directly from Python.
walker = pyg.walk(df, spec_path="./chart_meta_0.json")
# edit the chart in the UI and click the save button
walker.save_chart_to_file("Chart 1", "chart1.svg", save_type="svg")
png_bytes = walker.export_chart_png("Chart 1")
svg_bytes = walker.export_chart_svg("Chart 1")
Use pygwalker in Streamlit
Streamlit allows you to host a web version of pygwalker without figuring out details of how web application works.
Here are some of the app examples build with pygwalker and streamlit:

from pygwalker.api.streamlit import StreamlitRenderer
import pandas as pd
import streamlit as st

# Adjust the width of the Streamlit page
st.set_page_config(
    page_title="Use Pygwalker In Streamlit",
    layout="wide"
)

# Add Title
st.title("Use Pygwalker In Streamlit")

# You should cache your pygwalker renderer, if you don't want your memory to explode
@st.cache_resource
def get_pyg_renderer() -> "StreamlitRenderer":
    df = pd.read_csv("./bike_sharing_dc.csv")
    # If you want to use feature of saving chart config, set `spec_io_mode="rw"`
    return StreamlitRenderer(df, spec_path="./gw_config.json", spec_io_mode="rw")


renderer = get_pyg_renderer()

renderer.explorer()
If you already created a reusable Walker, Streamlit can render it directly:
import pygwalker as pyg
from pygwalker.api.streamlit import StreamlitRenderer

walker = pyg.Walker(df, spec_path="./gw_config.json", computation="kernel")
renderer = StreamlitRenderer(walker)
renderer.explorer()
| Parameter |
Type |
Default |
Description |
| dataset |
Union[DataFrame, pyarrow.Table, Connector, str, Walker] |
- |
DataFrame, pyarrow table, database connector, SQL/data source string, or reusable Walker object to explore. |
| gid |
Union[int, str] |
None |
ID for the GraphicWalker container div, formatted as gwalker-{gid}. |
| env |
Literal['JupyterAnywidget', 'Jupyter', 'JupyterWidget'] |
'JupyterAnywidget' |
Notebook rendering environment. Use JupyterAnywidget or omit env; Jupyter and JupyterWidget are deprecated aliases to the anywidget transport and are scheduled for removal in PyGWalker 0.7.0. |
| field_specs |
Optional[List[FieldSpec]] |
None |
Field specifications. They will be inferred from dataset if not specified. |
| theme_key |
Literal['vega', 'g2', 'streamlit'] |
'g2' |
Theme type for Graphic Walker. |
| appearance |
Literal['media', 'light', 'dark'] |
'media' |
Theme appearance. media follows the operating system preference. |
| spec |
str |
"" |
Chart configuration data. Can be a configuration ID, JSON string, local file path, or remote file URL. |
| spec_path |
Optional[str] |
None |
Local chart configuration file path. Prefer this over passing a local file path through spec. |
| computation |
Optional[Literal['auto', 'browser', 'kernel', 'cloud']] |
None |
Computation backend. Omit it for automatic behavior; use browser, kernel, or cloud to choose explicitly. |
| use_kernel_calc |
Optional[bool] |
None |
Deprecated; scheduled for removal in PyGWalker 0.7.0. Use computation="kernel" or computation="browser" instead. |
| kernel_computation |
Optional[bool] |
None |
Legacy boolean for local DuckDB-backed kernel computation; scheduled for removal in PyGWalker 0.7.0. Prefer computation. |
| cloud_computation |
bool |
False |
Legacy boolean for Kanaries cloud computation; scheduled for removal in PyGWalker 0.7.0. Prefer computation="cloud". |
| show_cloud_tool |
bool |
True |
Whether to show the Kanaries cloud tool when available. |
| kanaries_api_key |
str |
"" |
Kanaries API key used by cloud features. |
| default_tab |
Literal['data', 'vis'] |
'vis' |
Default tab to show when the UI opens. |
| **kwargs |
Any |
- |
Additional keyword arguments. |
Development
Local development is documented in this repository:
- AGENTS.md — repo map, the one-command dev stack (
python scripts/dev.py), and log locations (written for both human and AI-agent contributors).
- docs/DEVELOPMENT.md — hot-reload dev workflow and troubleshooting.
- docs/ARCHITECTURE.md — how the Python and frontend halves are built and talk to each other.
- docs/CONTRIBUTING.md — validation commands, CI, and package builds.
See also the hosted guide: local-development.
Tested Environments
- Jupyter Notebook
- Google Colab
- Kaggle Code
- Jupyter Lab
- Jupyter Lite
- Databricks Notebook (Since version
0.1.4a0)
- Jupyter Extension for Visual Studio Code (Since version
0.1.4a0)
- Most web applications compatiable with IPython kernels. (Since version
0.1.4a0)
- Streamlit (Since version
0.1.4.9), enabled with pygwalker.api.streamlit.StreamlitRenderer
- DataCamp Workspace (Since version
0.1.4a0)
- Panel. See panel-graphic-walker.
- marimo (Since version
0.4.9.11)
- Hex Projects
- ...feel free to raise an issue for more environments.
Configuration And Privacy Policy(pygwalker >= 0.3.10)
You can use pygwalker config to set your privacy configuration.
$ pygwalker config --help

usage: pygwalker config [-h] [--set [key=value ...]] [--reset [key ...]] [--reset-all] [--list]

Modify configuration file. (default: ~/Library/Application Support/pygwalker/config.json)
Available configurations:

- privacy  ['offline', 'update-only', 'events'] (default: update-only).
    "offline": fully offline, no data is send or api is requested
    "update-only": only check whether this is a new version of pygwalker to update
    "events": share which events about which feature is used in pygwalker, it only contains events data about which feature you arrive for product optimization. No DATA YOU ANALYSIS IS SEND. Events data will bind with a unique id, which is generated by pygwalker when it is installed based on timestamp. We will not collect any other information about you.

- kanaries_token  ['your kanaries token'] (default: empty string).
    your kanaries token, you can get it from https://kanaries.net.
    refer: https://space.kanaries.net/t/how-to-get-api-key-of-kanaries.
    by kanaries token, you can use kanaries service in pygwalker, such as share chart, share config.


options:
  -h, --help            show this help message and exit
  --set [key=value ...]
                        Set configuration. e.g. "pygwalker config --set privacy=update-only"
  --reset [key ...]     Reset user configuration and use default values instead. e.g. "pygwalker config --reset privacy"
  --reset-all           Reset all user configuration and use default values instead. e.g. "pygwalker config --reset-all"
  --list                List current used configuration.
More details, refer it: How to set your privacy configuration?
License
Apache License 2.0
Contribution Guideline
You are encouraged to contribute to PyGWalker in any way that suits your interests. This may include:
- Answering questions and providing support
- Sharing ideas for new features
- Reporting bugs and glitches
- Contributing code to the project
- Offering suggestions for website improvements and better documentation
Resources
PyGWalker Cloud is released! You can now save your charts to cloud, publish the interactive cell as a web app and use advanced GPT-powered features. Check out the PyGWalker Cloud for more details.






 PyGWalker — это библиотека для Python, которая превращает ваш датафрейм pandas в интерактивный интерфейс для визуального анализа: данные можно изучать и строить по ним графики простым перетаскиванием прямо внутри Jupyter Notebook.