OrcaReplay
English · 简体中文 · 日本語 · 한국어 · Deutsch · Français · Español · العربية
Your agent broke something at 2am. Replay it at 9am — exactly, offline, as many times as you like.
Record any coding agent. Reproduce the run byte-for-byte with no model called. Fork it from any step
onto a different model and see who gets it right.

Built by the team behind OrcaRouter — one API key and one endpoint
for Claude, GPT, Gemini, Grok, DeepSeek, Qwen and the rest. It is what orca setup points at by
default, and what makes orca compare a single command instead of four provider accounts.
Find us: OrcaRouter All model APIs
Github Repos: OrcaCode Review · OrcaRouter Lite
Connect: X · Discord · Hugging Face · Ollama







Real output from one session — a Claude Code run recorded, replayed against the recording, then
forked at checkpoint 4 onto two models and graded by npx tsc --noEmit. Nothing here is mocked up.
Try it in three commands
orca record claude              # your agent, unmodified, doing whatever it does
orca replay last                # the same run again — no network, no tokens, no charge
orca replay last --from 4 --model claude-haiku-4-5 --ui
The third line is the one people stay for: same files, same conversation prefix, different model
from step 4 onward. The model is the only variable, which is what makes the answer mean anything.
npm i -g orcareplay
The three commands at the top need an agent installed, a key, a network and real tokens. If you
have none of those yet, one command brings its own:
orca quickstart
It writes a small project with a genuine bug in it and a recording of an agent fixing that bug,
then replays the recording against the project with no model called: two failing tests before,
four passing after, three turns served from the trace and nothing spent. --full prints the whole
timeline and the replay as it happened.
Read your agent's own system prompt
A proxy that sees the whole loop also sees the prompt the harness assembled before it sent
anything. One command captures it, scrubs the machine out of it, and files it by model:
node capture/capture.mjs claude --model claude-opus-5
Interactive prompts and -p prompts are not the same prompt, and neither is the same across
models. See capture/README.md for the measured differences, the pitfalls,
and the sanitising rules.
Why this exists
Agent debugging today is archaeology. You scroll a terminal, you re-run and get a different
failure, you add print statements to someone else's harness. The tools that exist are
observability tools: they tell you a run cost $4.12 and used 61k tokens, which is not the question
you have. The question you have is why did it delete my migration file.
OrcaReplay answers that by giving you the run back.
|
Observability tools |
OrcaReplay |
| Tells you what a run cost |
✅ |
✅ |
| Tells you which tool call deleted the file |
sometimes |
✅ |
| Runs the agent again and gets the same answer |
❌ |
✅ from the recording, byte-for-byte |
| Lets you change the model and re-run from step 4 |
❌ |
✅ |
| Needs you to modify your agent |
usually an SDK wrapper |
❌ two env vars |
| Works after you close the terminal |
❌ |
✅ it is a file |
| Sees past the model API — shell exit codes, file writes |
❌ |
✅ every turn |
| Records an agent with no API endpoint to redirect |
❌ |
✅ opt-in --tls-intercept |
The last two rows are the ones an SDK wrapper structurally cannot reach. Capture happens below
the agent — at the process and socket boundary — so it does not matter whether the agent is
yours, whether you can edit it, or whether it even holds an API key: a Codex CLI signed in with
a ChatGPT subscription talks to its own backend over TLS and has no base URL to point anywhere,
and orca can still record it. See
when the harness will not be redirected.
How it works
Model APIs are stateless, so on every turn an agent resends the entire conversation — including the
previous turn's tool results. A proxy in front of the model therefore sees the whole loop: each
request, each streamed response, every tool call the model emitted, and every tool result the
harness produced. That one property is what the tool is built on, and it is why OrcaReplay does
not patch your agent — it stands up a local proxy, sets two environment variables, and gets out of
the way.
What "egress blocked" means, exactly. On replay the proxy refuses to forward anything it cannot serve from the trace, so no model is called and no tokens are spent — that run prints egress=blocked. --loose lifts it deliberately: an unmatched request is then answered by the provider and recorded as a major divergence, and the same line reads egress=live-on-unmatched. A replay still executes the recorded tool calls for real, and a tool that opens its own socket — a shell command running curl, an MCP server fetching something — is outside the guarantee either way. By default it never reaches the proxy and goes to the network as usual. Under --tls-intercept it does reach the proxy, because that sets HTTPS_PROXY for the whole child: a host off the intercept list is tunnelled through untouched, though its hostname, port and byte counts still land in the trace, and a host on the list is refused there like any other unmatched call. Replay is not a sandbox; if you need one, run it inside one.
Three more layers catch what the protocol cannot see: an exit code, a real duration, which stream a
byte came out of, a file written without telling anyone. A fifth exists for the agents that read no
base-URL variable at all — see which agents.
%%{init: {'theme':'neutral'}}%%
flowchart LR
    A["<b>your agent</b><br/><i>unmodified</i>"]

    subgraph orca["orca · five capture layers"]
        direction TB
        P["<b>proxy</b><br/>base-URL env var"]
        SH["<b>PATH shim</b><br/>exit code · timing · streams"]
        MC["<b>JSON-RPC tee</b><br/>MCP config rewrite"]
        FS["<b>shadow git index</b><br/>workspace per turn"]
        FH["<b>fetch hook</b><br/>for a hardcoded origin"]
    end

    A --> P & SH & MC & FS & FH
    P -->|"forwarded, auth intact"| U["<b>the model API</b><br/><i>or OrcaRouter · any gateway</i>"]
    orca ==> T[("<b>one trace</b><br/>.orca/runs/run_a1b2c3")]
They all land in the same timeline, ordered by when they actually happened rather than when orca
got around to reading them.
Exact, fork and compare are one thing
They are not three subsystems. They are the same proxy with a cursor — the position in the
recorded stream where it stops answering from disk and starts answering from the network.
%%{init: {'theme':'neutral'}}%%
flowchart LR
    subgraph disk["from disk · byte-for-byte · network blocked"]
        direction LR
        T1["turn 1"] --> T2["turn 2"] --> T3["turn 3"] --> T4["turn 4"]
    end
    T4 ==> CUR{{"<b>cursor</b>"}}
    CUR ==> T5
    subgraph net["from the network · any model you name"]
        direction LR
        T5["turn 5"] --> T6["turn 6"] --> T7["…"]
    end
| command |
where the cursor sits |
what you get |
orca replay last |
at the end |
the whole run again, network blocked — no tokens, no charge, no variance |
orca replay last --from 4 --model X |
at checkpoint 4 |
turns up to 4 identical, then a different model takes over |
orca compare last --from 4 --models a,b |
at checkpoint 4, several times |
one table, one variable — the model |
A checkpoint is not recorded; it is derived — any point where the conversation prefix is
complete and the workspace was snapshotted. Every fork therefore starts from a state that provably
existed.
What a bug hunt actually looks like
Your agent was supposed to fix a failing auth test. It exited 0 and the test still fails. Start with
what it actually did:
$ orca show last
run_6473f858b59e  [email protected]  14 events  exit 0

SEQ  KIND   WHAT                                            DETAIL
0    RUN    run started                                     generic-openai
1    SNAP   tree 919d32ba037537b43814c83779963b2cc3023db7   0 changed
2    MODEL  claude-opus-5                                   1 messages
3    MODEL  claude-opus-5                                   stop: tool_use · 100 in · 20 out
4    TOOL   edit_file                                       {"path":"auth.ts",…}
5    SNAP   tree c6af62b75c0c8b8938bd6087328b5148f3dcd534   1 changed
6    FILE   auth.ts                                         modified +1 −3
7    TOOL   edit_file                                       ok
8    MODEL  claude-opus-5                                   3 messages
9    MODEL  claude-opus-5                                   stop: end_turn · 101 in · 5 out
10   SNAP   tree c6af62b75c0c8b8938bd6087328b5148f3dcd534   0 changed
11   SHELL  ["sh","-c","node --check nonexistent-file.ts"]  /tmp/hunt
12   SHELL  shell result                                    exit 1 · 43ms
13   RUN    run ended                                       exit 0

info usage input=201 output=25 cost=$0.004890
Three facts the model's own transcript could not have told you, and the run's exit code hid: the
file really changed (seq 6, +1 −3), the check the agent ran failed (seq 12, exit 1), and it
finished anyway. The run exited 0 because the agent exited 0.
That last fact is the one worth a command of its own. orca show gives you the order things
happened in; orca graph gives you what produced what:
$ orca graph last
FROM              TO               KIND      WHY
3 model.response  4 tool.call      recorded  tool_use block in the response
4 tool.call       6 fs.change      inferred  changed path appears in tool input, same or previous turn
4 tool.call       7 tool.result    recorded  tool result answers its call
7 tool.result     8 model.request  recorded  tool_result block in the request
11 shell.exec     12 shell.result  recorded  shell result answers its exec

  1 inferred — derived from this trace, not recorded in it
Two kinds of edge, and the difference matters. A recorded edge was written when the run
happened, because a tool_use block is physically inside the response that emitted it. An
inferred edge was worked out just now by the rule it names — a filesystem snapshot is taken
once per turn rather than once per tool call, so attributing a file change to a particular call
is a good guess and not a fact. Inferred edges are never written back into the trace, the same way
checkpoints are derived and never recorded, so a field a third-party reader trusts never contains
something orca made up.
--graph-card draws the whole run that way — time left to right, kind of thing top to bottom, with
the chain that produced the failure lit against everything else:
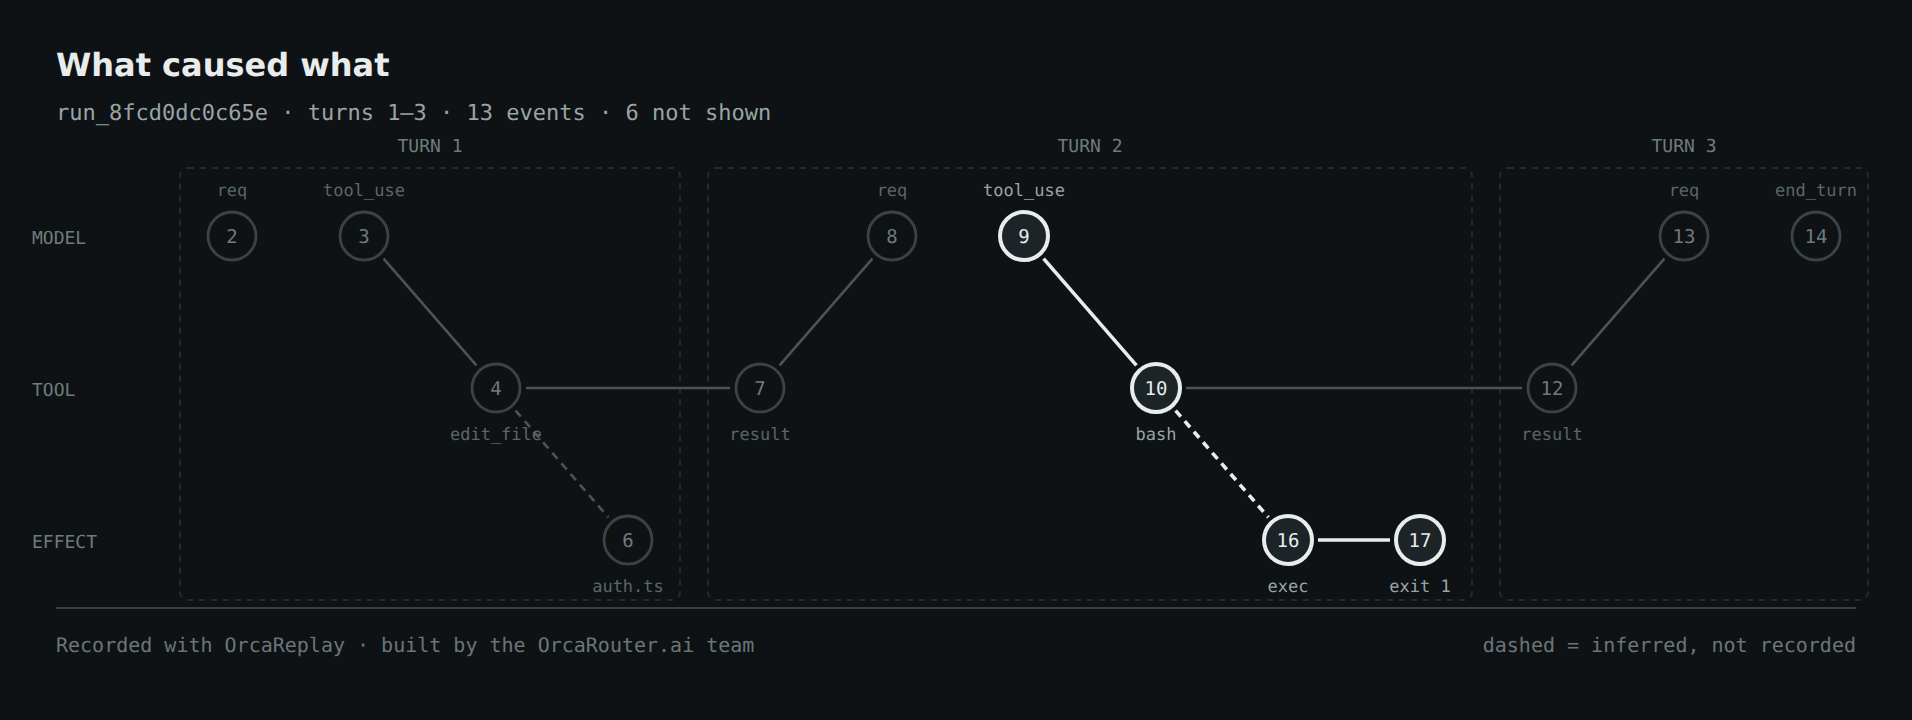
The shape is the point. A run is one motif repeated — request, response, call, effect, result — so
anything that breaks it is worth a look, and an event with no edge leaving it is an absence a
list cannot show at all.
orca export last --card bug.svg draws just that chain, which is the version that fits in an issue
or a message:
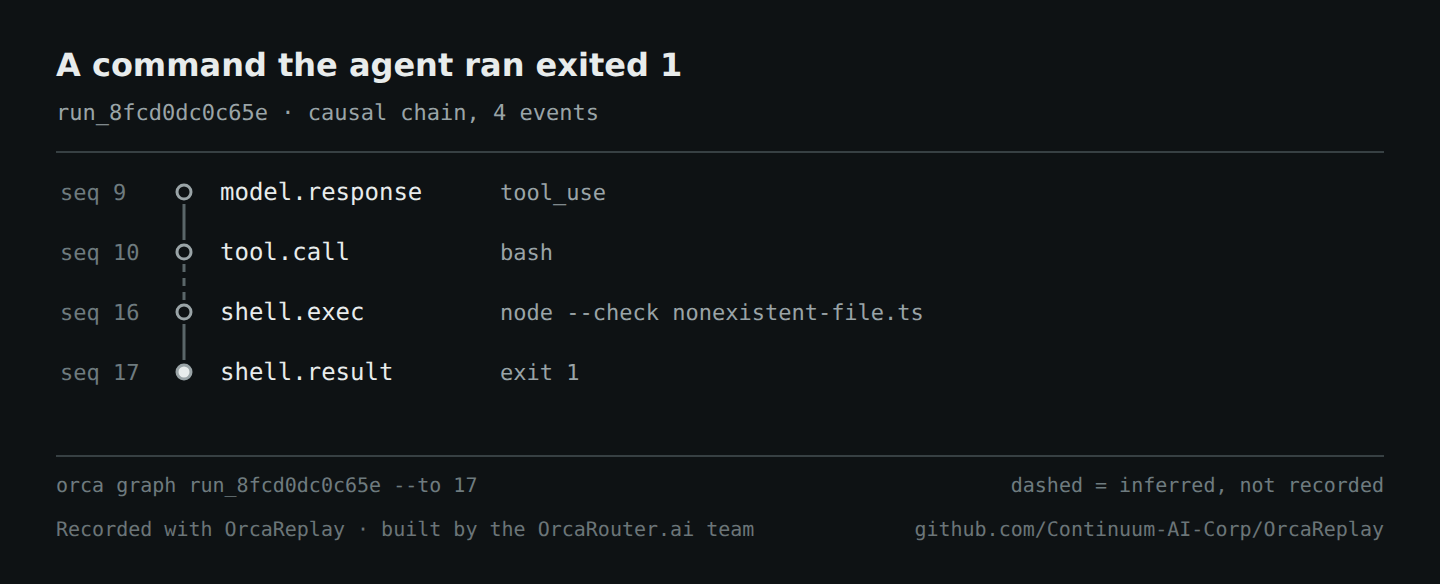
Nothing picked the subject by hand — --to was not passed. The card carries its own legend because
a dashed line travelling without its trace would otherwise launder a guess into a fact, and it
prints the command that reproduces it.
SVG renders in a GitHub issue and almost nowhere else that matters — X will not take it as an
upload, and Slack and Discord give it no preview — so name the file .png and you get one, or
.gif and the chain builds a hop at a time. That path needs a browser, and orca does not depend on
one: docs/media/README.md keeps the render toolchain out of package.json so nobody running
npm ci pays for a Chromium download, and a picture command is not a reason to reverse that. Ask
for a raster without it and orca says the one line that fixes it; orca doctor reports it either
way, and .svg never needs anything.
orca export last --card bug.png       # the chain, ready to post
orca export last --card bug.gif       # the same chain, one hop per frame
npm i --no-save playwright-core pngjs gifenc   # only needed for the two above
Now reproduce it as often as you like, for nothing:
$ orca replay last
info replay.done reused=2/2 exact=2 divergences=0 unmatched=0 exit=0
No network, no tokens, no variance. Then ask the question you actually have — would a different
model have got this right?
$ orca compare last --from 5 --models claude-opus-5,claude-haiku-4-5 --verify "npm test"
MODEL             VERDICT  TOKENS  COST       WALL  RUN
claude-opus-5     pass     201/25  $0.004890  0.3s  run_1457b35062ba
claude-haiku-4-5  pass     201/25  $0.000326  0.3s  run_b8ee08479fb6
Both pass. One costs 15× less. Same files, same conversation prefix, same checkpoint — the model
is the only thing that changed, which is the only reason that number means anything.
The timeline
orca replay last --ui (or orca ui) opens the run as one self-contained HTML file — no server
to keep running, no network, nothing to install. Filter it, step it, or press space and watch the
run play back at the pace it actually happened.
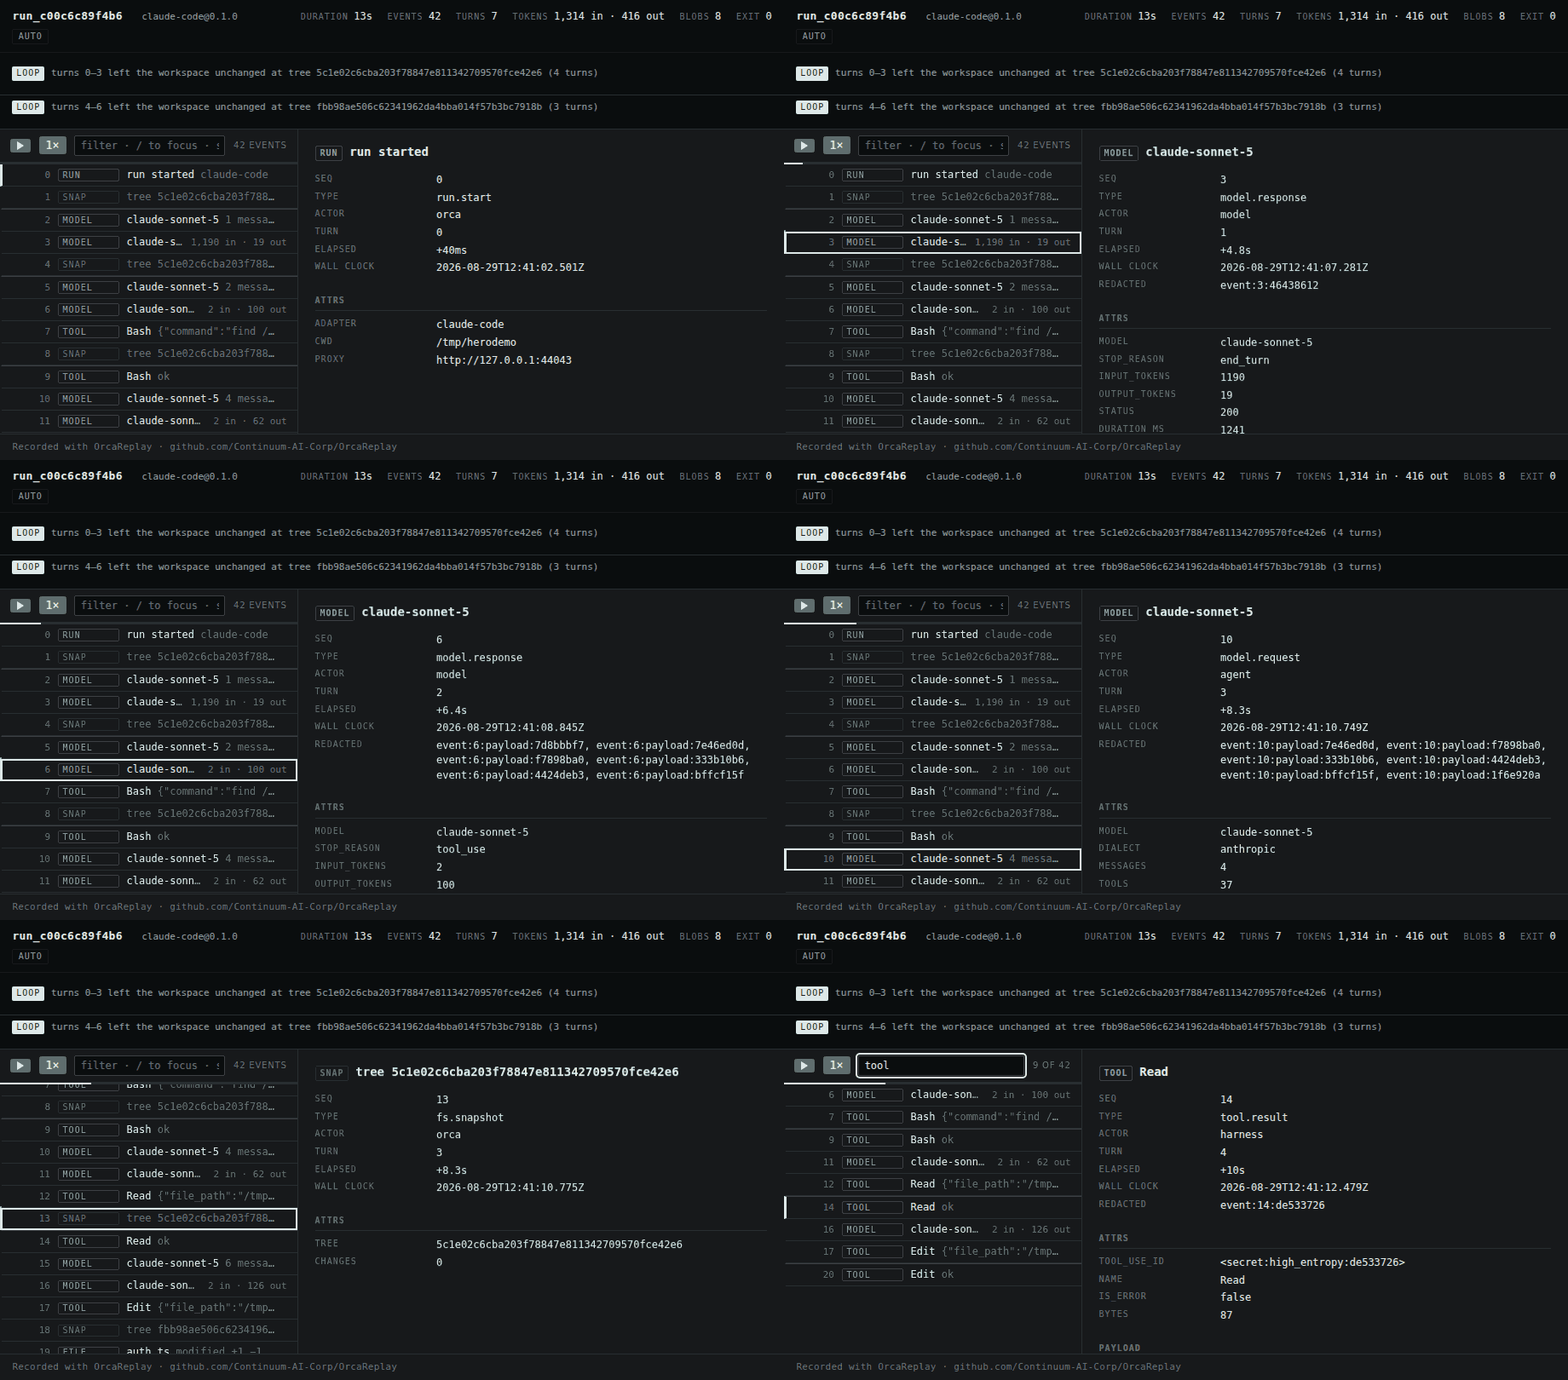
Every layer lands in the same timeline, so you can read the run as one story rather than four:
the model turns and their token counts, each tool call with its arguments and result, the shell
commands with their exit codes and timing, and the filesystem changes with the tree they produced.
orca export last -o bug.html writes exactly that page to a single file you can attach to an
issue. It carries no external reference of any kind — CI asserts that — so it renders from a
download folder, on a plane, in five years.
Same task, different model
orca compare forks one recorded run onto several models from the same checkpoint, with the same
files and the same conversation prefix, and grades each one with a command you choose. The model
is the only variable, which is what makes the answer mean anything.
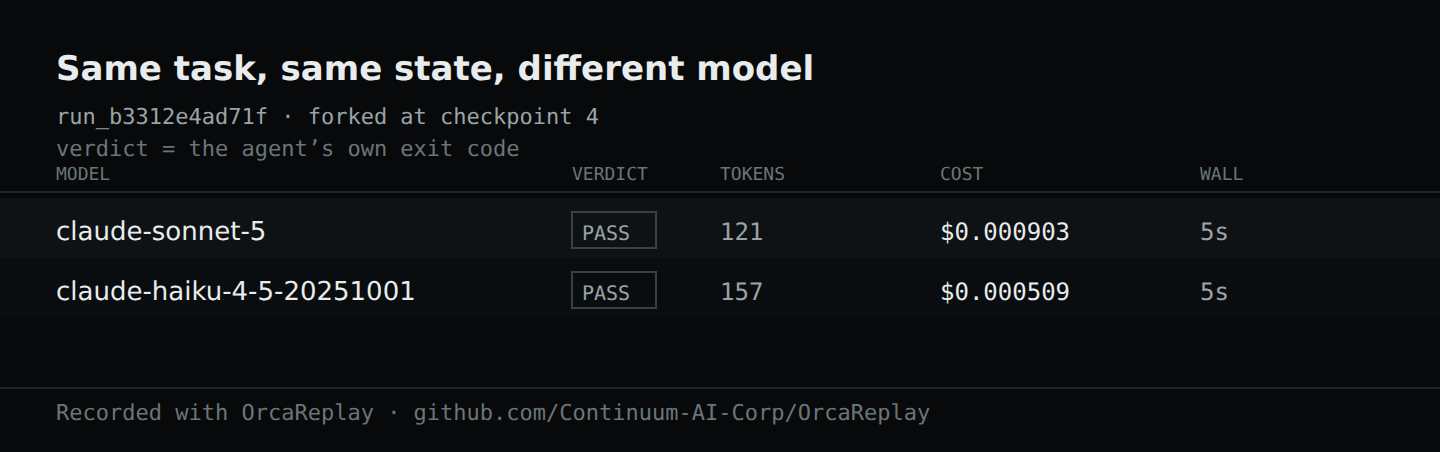
orca compare last --from 4 \
  --models claude-sonnet-5,claude-haiku-4-5 \
  --verify "npm test" \
  --share verdict.svg          # the card above, ready to paste into an issue
Pointing it at several models
Comparing models means reaching several providers, and doing that by hand means knowing that
--upstream-anthropic and --upstream-openai exist, that one gateway can serve both wire formats,
and where the key goes. All of that is real and none of it is discoverable, so there is a command
that asks instead:
$ orca setup
Gateway URL (serves the model APIs) [https://api.orcarouter.ai]:
  get a key at https://www.orcarouter.ai/console/token — OrcaRouter keys start sk-orca-
API key (stored 0600; leave blank for none):
  info config.saved path=~/.config/orca/config.json mode=0600 gateway=https://api.orcarouter.ai auth=stored

  6 models available:
    anthropic/claude-opus-5
    anthropic/claude-haiku-4-5
    openai/gpt-5.2
    ...

$ orca models
MODEL                      $/MTOK IN  $/MTOK OUT
anthropic/claude-opus-5    15         75
anthropic/claude-haiku-4-5 1          5
openai/gpt-5.2             1.25       10
some-local-model           —          —
orca setup asks the gateway what it actually serves rather than just writing the file, so a wrong
URL or a dead key is an answer now instead of a 401 in the middle of a comparison. It also stores the
models you picked, so after that orca compare last --verify "npm test" needs no model list and no
upstream flags at all. orca models prices what it recognises and shows a
dash for what it does not, because inventing a number for an unknown model is how a comparison
table ends up quoting a cost that was never real.
OrcaRouter is the default answer to that first question — press
Enter and you have one origin and one key serving Claude, GPT, Gemini, Grok, DeepSeek, Qwen and the
rest, which is exactly the shape orca compare wants. Its model ids are namespaced by provider
(anthropic/claude-sonnet-4.6, openai/gpt-4o-mini), which orca handles: the namespace picks the
wire format and is stripped before pricing.
It is a default, not a destination: type over it, or pass --gateway <url>, and anything that
speaks the OpenAI-compatible /v1/models and chat endpoints works just as well — another hosted
gateway, or something you run yourself.
It is also only ever a default for traffic you asked to send somewhere. With no gateway
configured, orca record proxies your agent's own calls straight to whatever provider it was
already talking to, on the agent's own key. Orca does not reroute a recording you never configured:
that would post your source code to a third party as a side effect of pressing record.
Non-interactive: orca setup --key <k> takes the default, orca setup --gateway <url> --key <k>
names another, and --key-env <VAR> reads the key from the environment rather than keeping a
credential on disk.
The key never reaches a trace. It is attached to the outbound request only, while what gets
recorded is built from the incoming request with auth stripped — so it is invisible to the
recording by construction, not by a rule someone has to remember. It is withheld entirely if a flag
sends that traffic somewhere other than the gateway that issued it.
Which agents
Two things decide whether a harness can be recorded: whether it can be pointed at the proxy, and
whether orca understands the wire format it speaks once it arrives.
| Agent |
How it is captured |
State |
| Claude Code |
ANTHROPIC_BASE_URL |
|

 OrcaReplay 记录编码智能体的完整运行过程(模型调用、工具调用、shell 命令、文件变更),之后你可以在离线状态下精确重放该次运行而不调用任何模型,从任意检查点把它分叉到另一个模型,并在同一任务上并排比较不同模型。