blessed-contrib
Build dashboards (or any other application) using ascii/ansi art and javascript.
Friendly to terminals, ssh and developers. Extends blessed with custom drawille and other widgets.
You should also check WOPR: a markup for creating terminal reports, presentations and infographics.
Contributors:
Yaron Naveh (@YaronNaveh)
Chris (@xcezzz)
Miguel Valadas (@mvaladas)
Liran Tal (@lirantal)
Demo (full size):
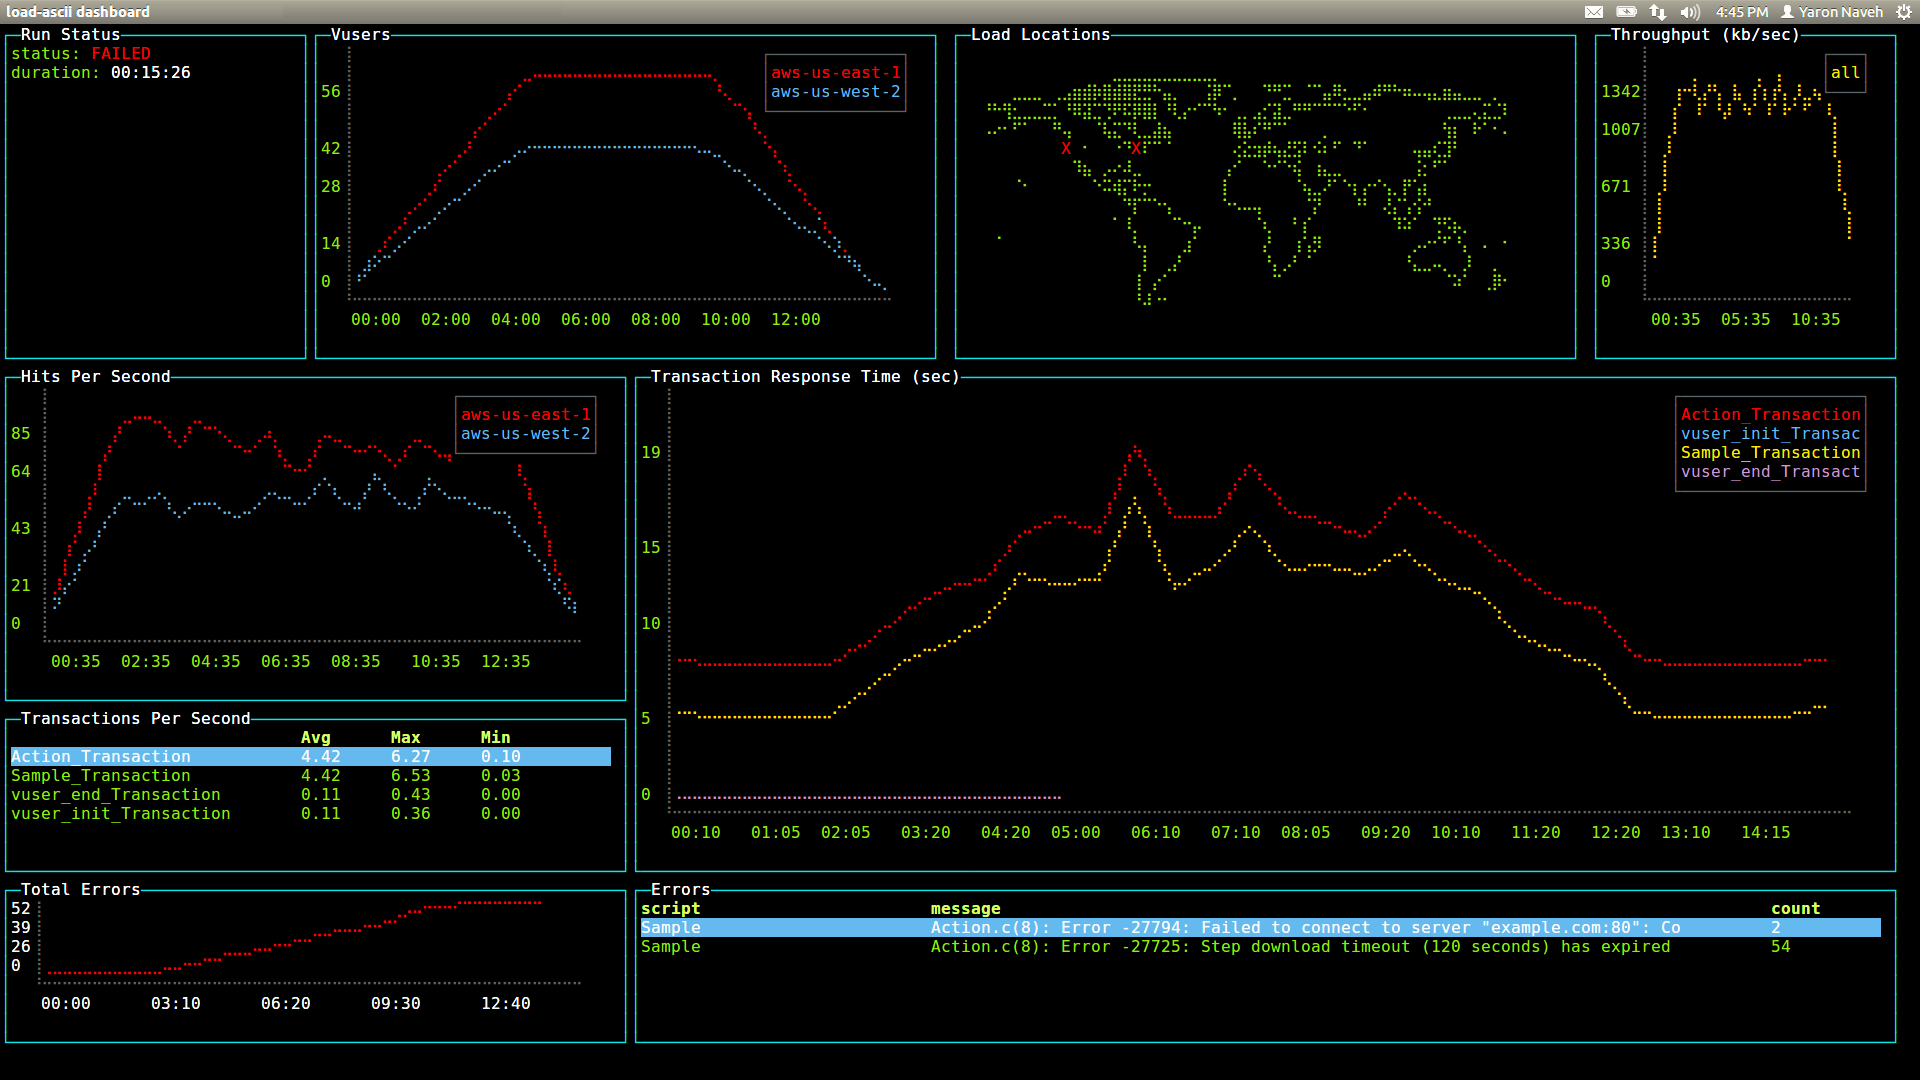
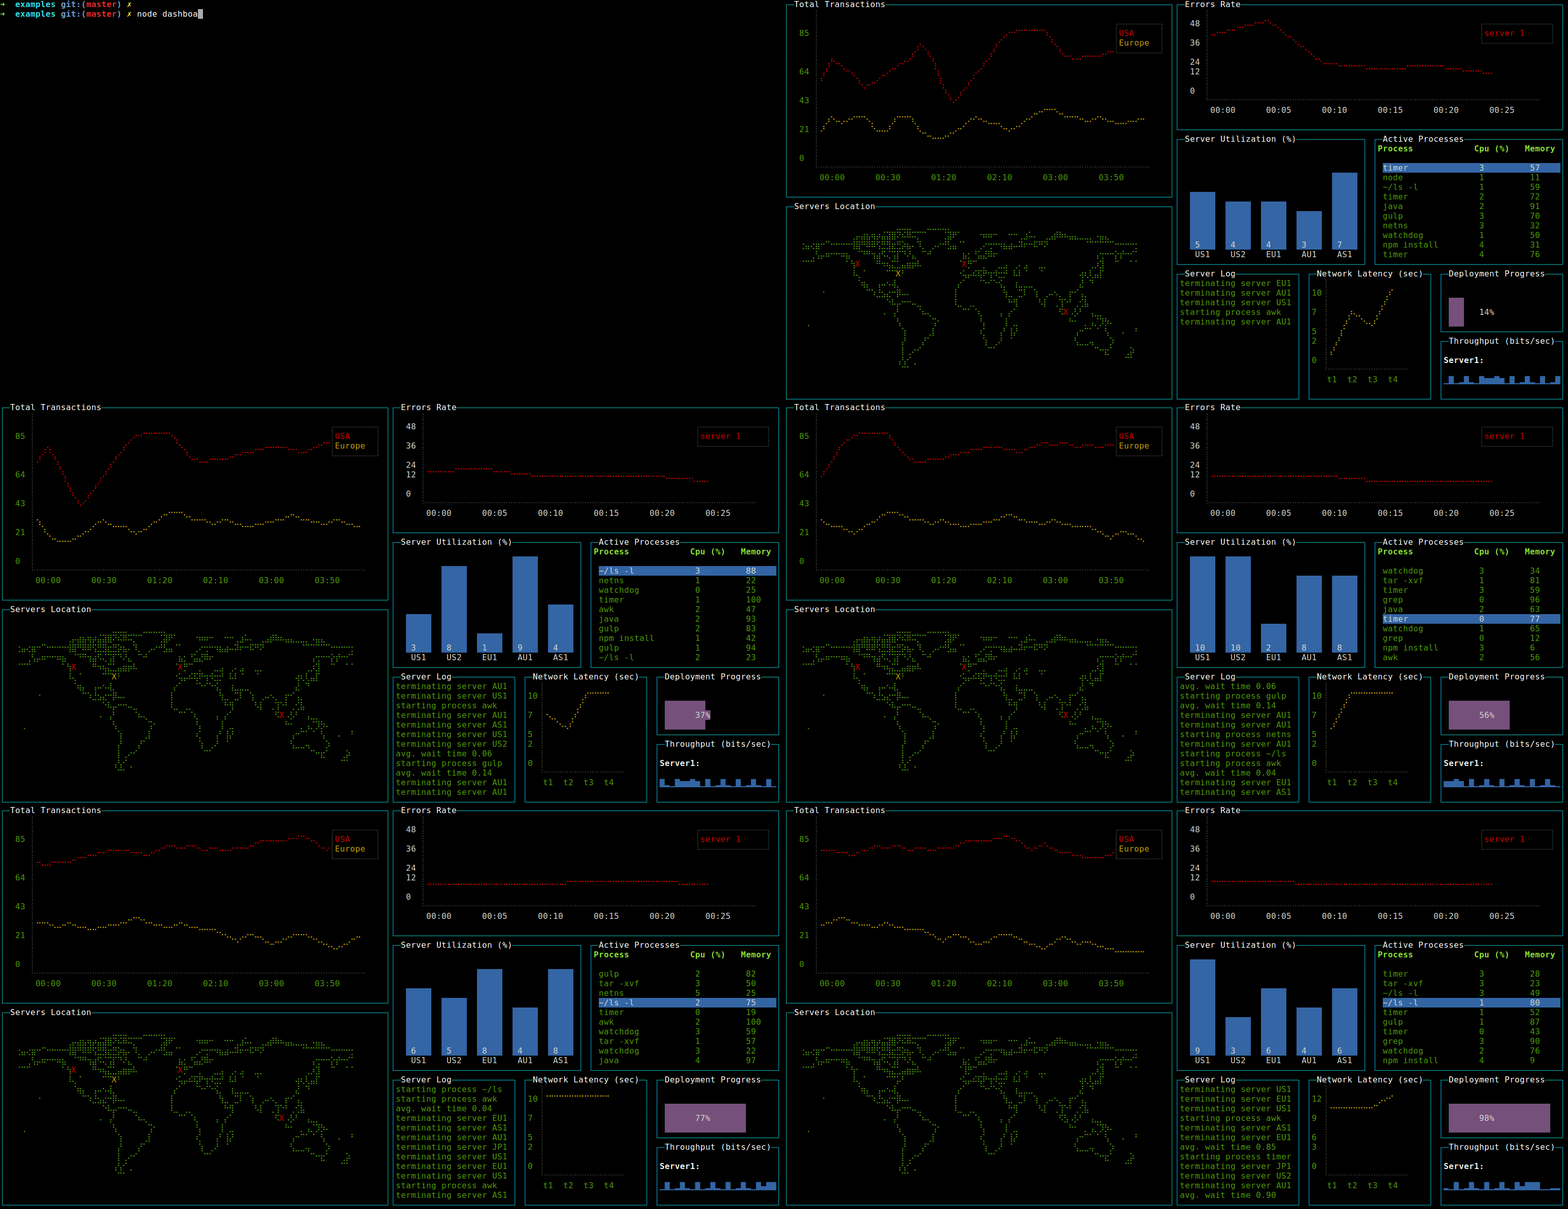
(source code)
Running the demo
git clone https://github.com/yaronn/blessed-contrib.git
cd blessed-contrib
npm install
node ./examples/dashboard.js
Works on Linux, OS X and Windows. For Windows follow the pre requisites.
Installation (to build custom projects)
Please use the latest stable version of Node.js LTS and install blessed-contrib and its peer dependency blessed as follows:
npm install blessed blessed-contrib
Usage
You can use any of the default widgets of blessed (texts, lists and etc) or the widgets added in blessed-contrib (described below). A layout is optional but useful for dashboards. The widgets in blessed-contrib follow the same usage pattern:
   var blessed = require('blessed')
     , contrib = require('blessed-contrib')
     , screen = blessed.screen()
     , line = contrib.line(
         { style:
           { line: "yellow"
           , text: "green"
           , baseline: "black"}
         , xLabelPadding: 3
         , xPadding: 5
         , label: 'Title'})
     , data = {
         x: ['t1', 't2', 't3', 't4'],
         y: [5, 1, 7, 5]
      }
   screen.append(line) //must append before setting data
   line.setData([data])

   screen.key(['escape', 'q', 'C-c'], function(ch, key) {
     return process.exit(0);
   });

   screen.render()
See below for a complete list of widgets.
Line Chart
Bar Chart
Stacked Bar Chart
Map
Gauge
Stacked Gauge
Donut
LCD Display
Rolling Log
Picture
Sparkline
Table
Tree
Markdown
Line Chart
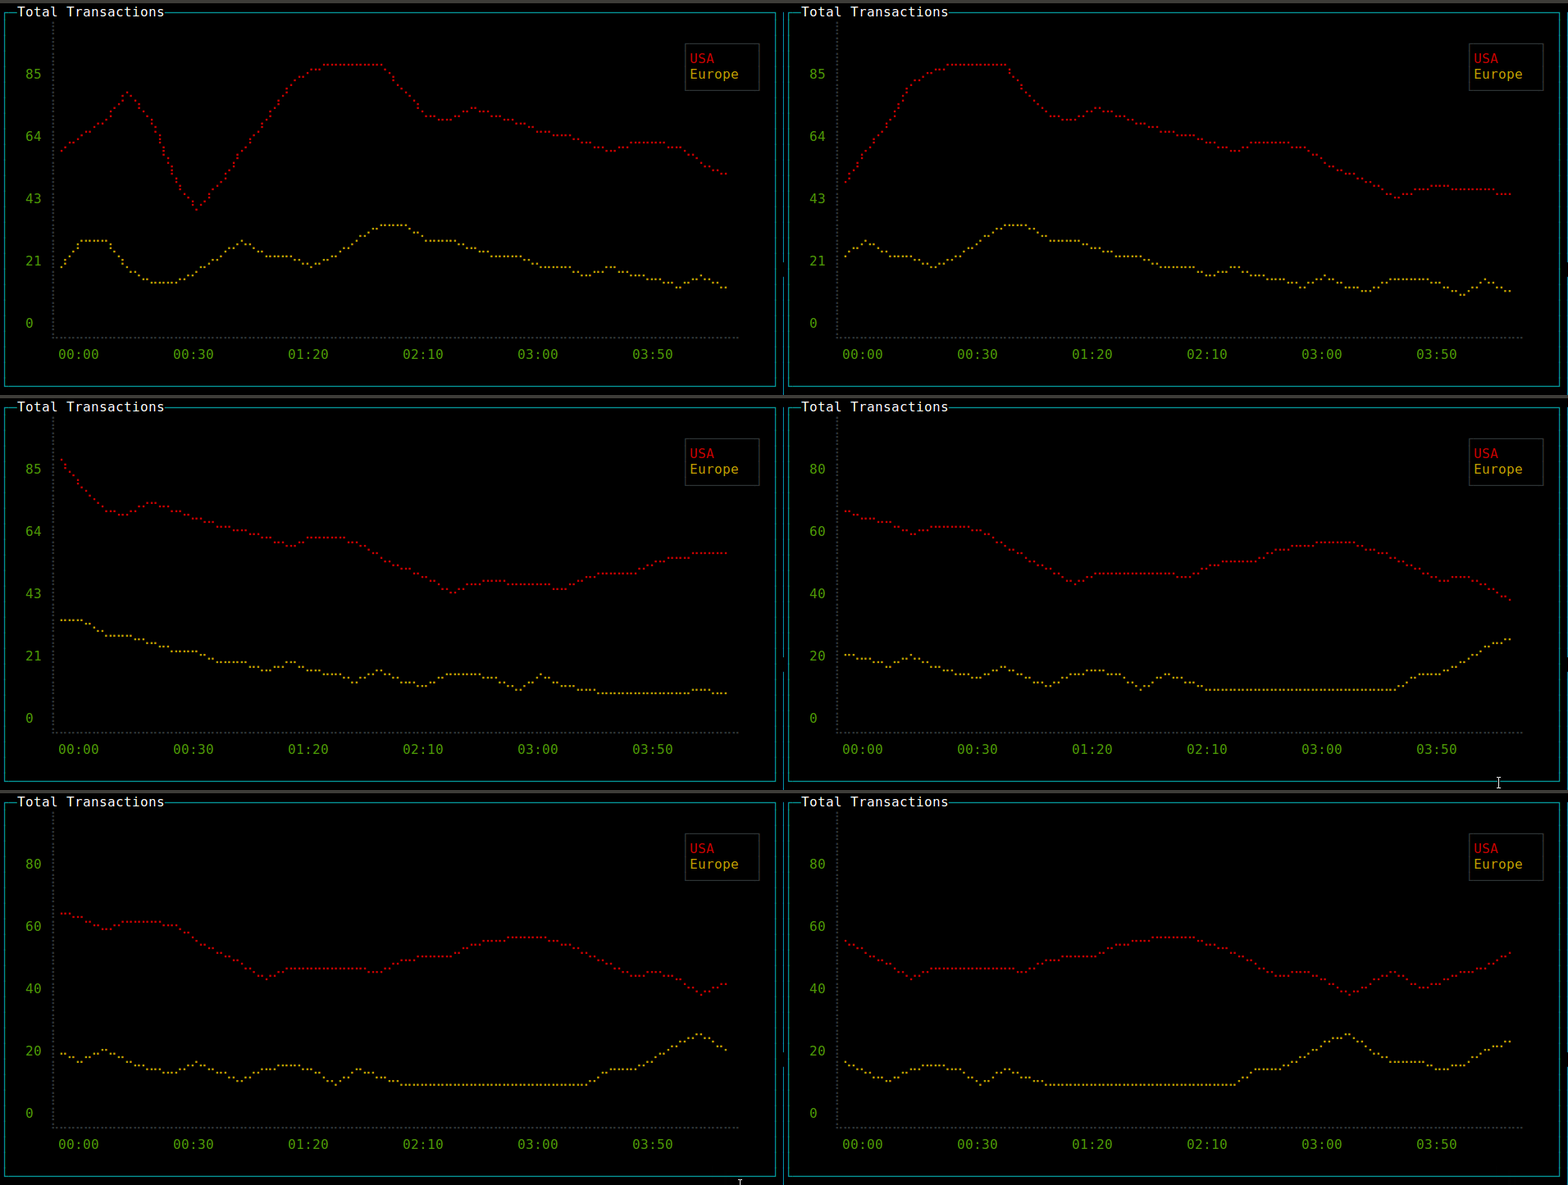
   var line = contrib.line(
         { style:
           { line: "yellow"
           , text: "green"
           , baseline: "black"}
         , xLabelPadding: 3
         , xPadding: 5
         , showLegend: true
         , wholeNumbersOnly: false //true=do not show fraction in y axis
         , label: 'Title'})
   var series1 = {
         title: 'apples',
         x: ['t1', 't2', 't3', 't4'],
         y: [5, 1, 7, 5]
      }
   var series2 = {
         title: 'oranges',
         x: ['t1', 't2', 't3', 't4'],
         y: [2, 1, 4, 8]
      }
   screen.append(line) //must append before setting data
   line.setData([series1, series2])
Examples: simple line chart, multiple lines, 256 colors
Bar Chart
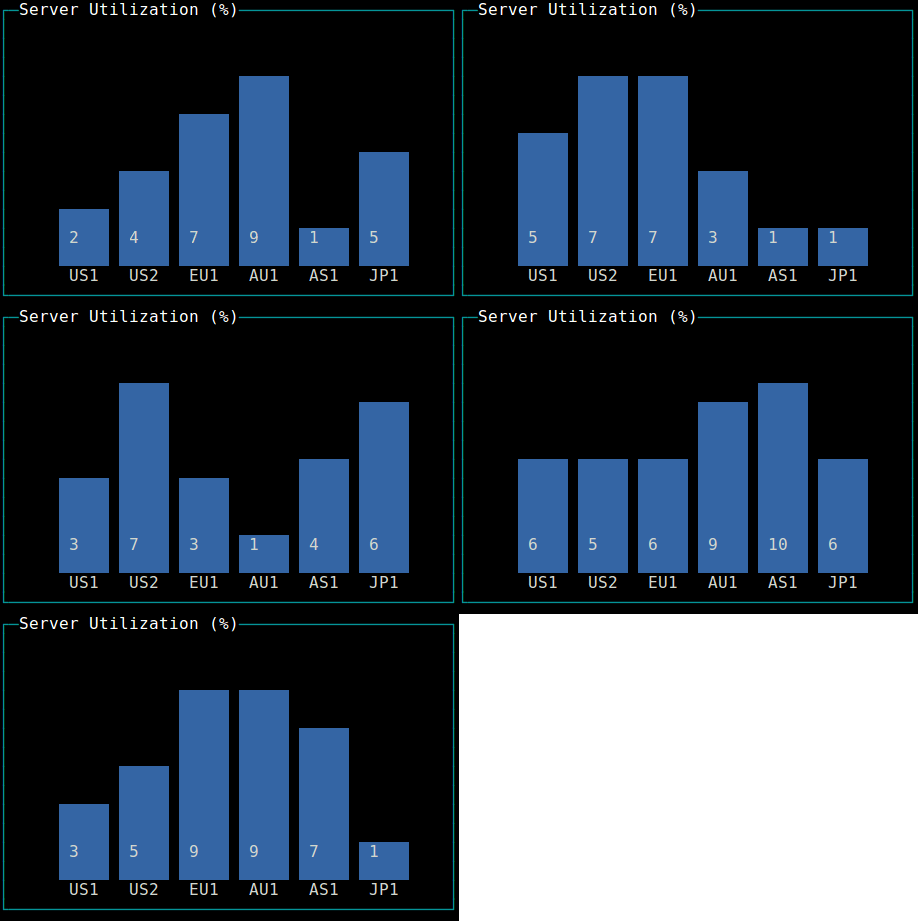
    var bar = contrib.bar(
       { label: 'Server Utilization (%)'
       , barWidth: 4
       , barSpacing: 6
       , xOffset: 0
       , maxHeight: 9})
    screen.append(bar) //must append before setting data
    bar.setData(
       { titles: ['bar1', 'bar2']
       , data: [5, 10]})
Stacked Bar Chart
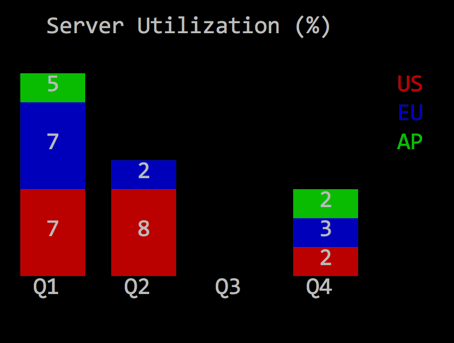
    bar = contrib.stackedBar(
       { label: 'Server Utilization (%)'
       , barWidth: 4
       , barSpacing: 6
       , xOffset: 0
       //, maxValue: 15
       , height: "40%"
       , width: "50%"
       , barBgColor: [ 'red', 'blue', 'green' ]})
    screen.append(bar)
    bar.setData(
       { barCategory: ['Q1', 'Q2', 'Q3', 'Q4']
       , stackedCategory: ['US', 'EU', 'AP']
       , data:
          [ [ 7, 7, 5]
          , [8, 2, 0]
          , [0, 0, 0]
          , [2, 3, 2] ]
       })
Map
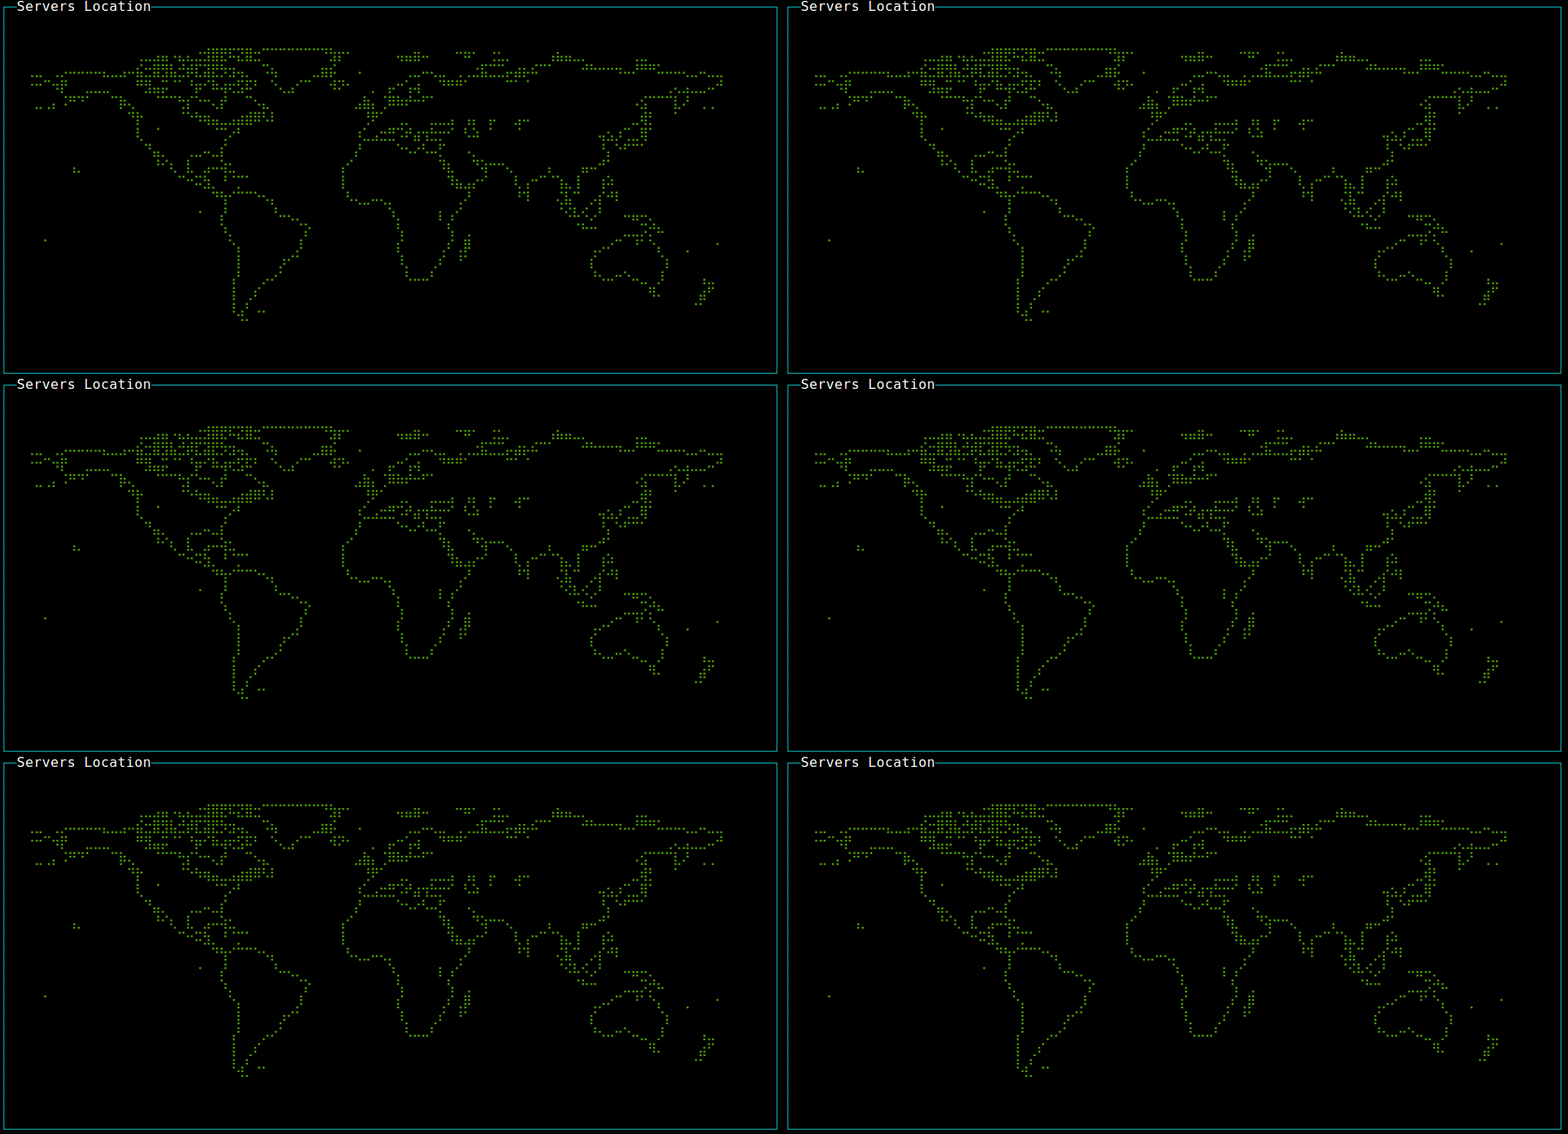
   var map = contrib.map({label: 'World Map'})
   map.addMarker({"lon" : "-79.0000", "lat" : "37.5000", color: "red", char: "X" })
Gauge
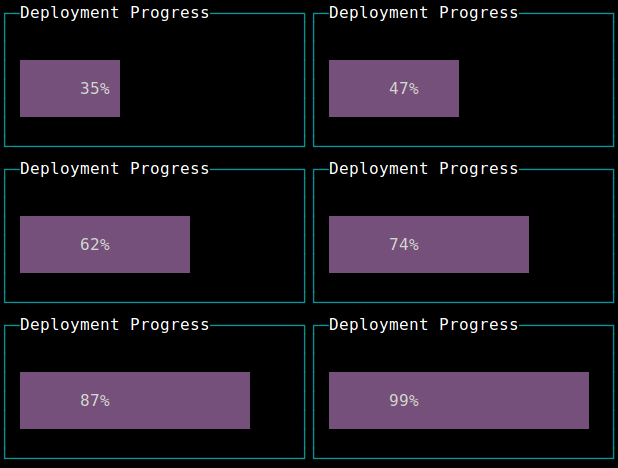
   var gauge = contrib.gauge({label: 'Progress', stroke: 'green', fill: 'white'})
   gauge.setPercent(25)
Stacked Gauge
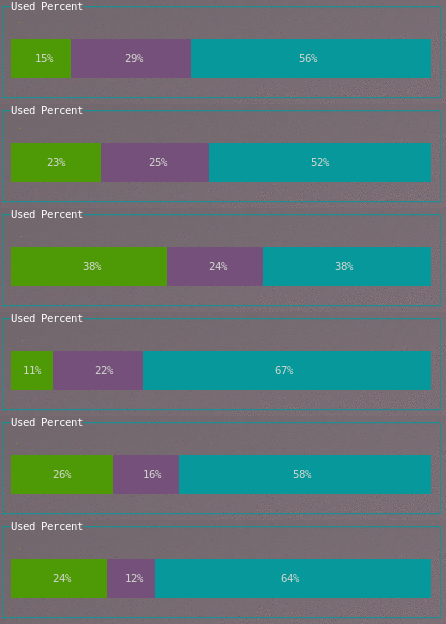
Either specify each stacked portion with a percent and stroke...
   var gauge = contrib.gauge({label: 'Stacked '})
   gauge.setStack([{percent: 30, stroke: 'green'}, {percent: 30, stroke: 'magenta'}, {percent: 40, stroke: 'cyan'}])
Or, you can just supply an array of numbers and random colors will be chosen.
   var gauge = contrib.gauge({label: 'Stacked Progress'})
   gauge.setStack([30,30,40])
Donut
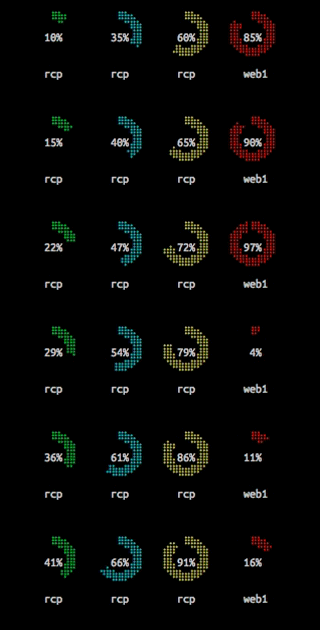
   var donut = contrib.donut({
	label: 'Test',
	radius: 8,
	arcWidth: 3,
	remainColor: 'black',
	yPadding: 2,
	data: [
	  {percent: 80, label: 'web1', color: 'green'}
	]
  });
Data passed in uses percent and label to draw the donut graph. Color is optional and defaults to green.
   donut.setData([
   	{percent: 87, label: 'rcp','color': 'green'},
	{percent: 43, label: 'rcp','color': 'cyan'},
   ]);
Updating the donut is as easy as passing in an array to setData using the same array format as in the constructor. Pass in as many objects to the array of data as you want, they will automatically resize and try to fit. However, please note that you will still be restricted to actual screen space.
You can also hardcode a specific numeric into the donut's core display instead of the percentage by passing an percentAltNumber property to the data, such as:
   var donut = contrib.donut({
	label: 'Test',
	radius: 8,
	arcWidth: 3,
	remainColor: 'black',
	yPadding: 2,
	data: [
	  {percentAltNumber: 50, percent: 80, label: 'web1', color: 'green'}
	]
  });
See an example of this in one of the donuts settings on ./examples/donut.js.
LCD Display
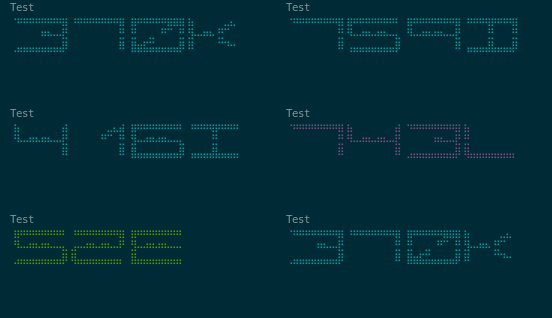
   var lcd = contrib.lcd(
     { segmentWidth: 0.06 // how wide are the segments in % so 50% = 0.5
     , segmentInterval: 0.11 // spacing between the segments in % so 50% = 0.550% = 0.5
     , strokeWidth: 0.11 // spacing between the segments in % so 50% = 0.5
     , elements: 4 // how many elements in the display. or how many characters can be displayed.
     , display: 321 // what should be displayed before first call to setDisplay
     , elementSpacing: 4 // spacing between each element
     , elementPadding: 2 // how far away from the edges to put the elements
     , color: 'white' // color for the segments
     , label: 'Storage Remaining'})
	lcd.setDisplay(23 + 'G'); // will display "23G"
	lcd.setOptions({}) // adjust options at runtime
Please see the examples/lcd.js for an example. The example provides keybindings to adjust the segmentWidth and segmentInterval and strokeWidth in real-time so that you can see how they manipulate the look and feel.
Rolling Log
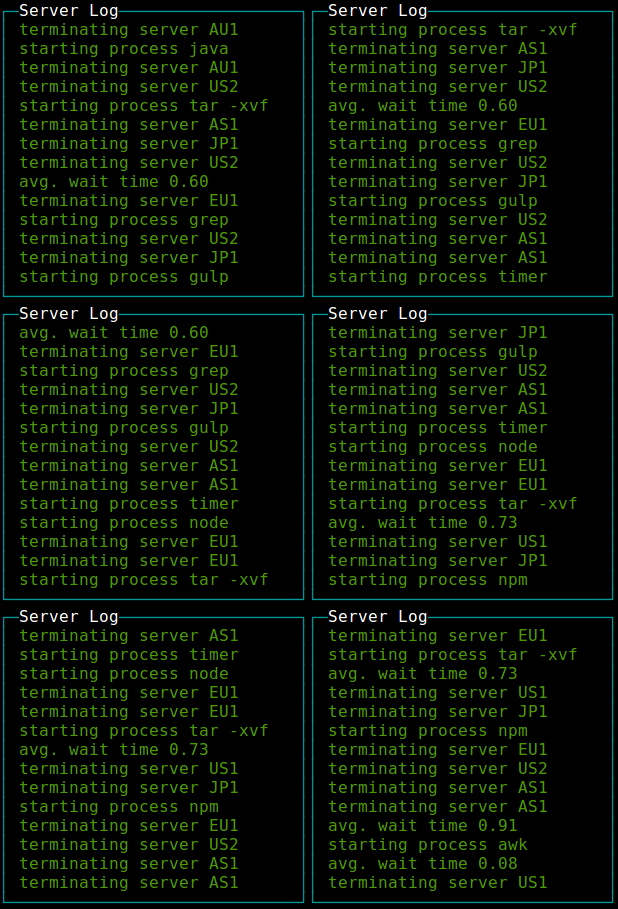
   var log = contrib.log(
      { fg: "green"
      , selectedFg: "green"
      , label: 'Server Log'})
   log.log("new log line")
Picture
(Also check the new blessed image implementation which has several benefits over this one.)

    var pic = contrib.picture(
       { file: './flower.png'
       , cols: 25
       , onReady: ready})
    function ready() {screen.render()}
note: only png images are supported
Sparkline
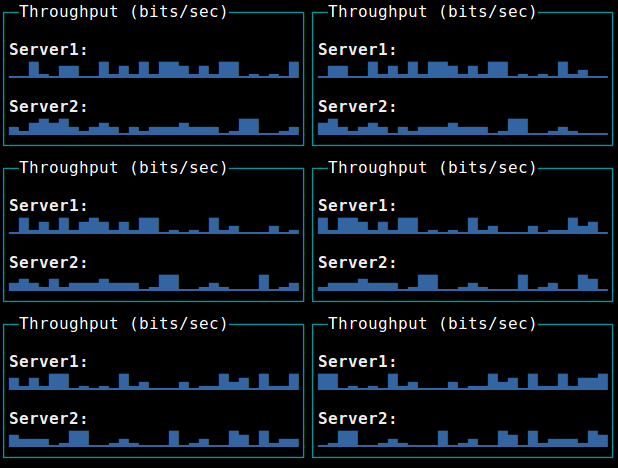
   var spark = contrib.sparkline(
     { label: 'Throughput (bits/sec)'
     , tags: true
     , style: { fg: 'blue' }})

   sparkline.setData(
   [ 'Sparkline1', 'Sparkline2'],
   [ [10, 20, 30, 20]
   , [40, 10, 40, 50]])
Table
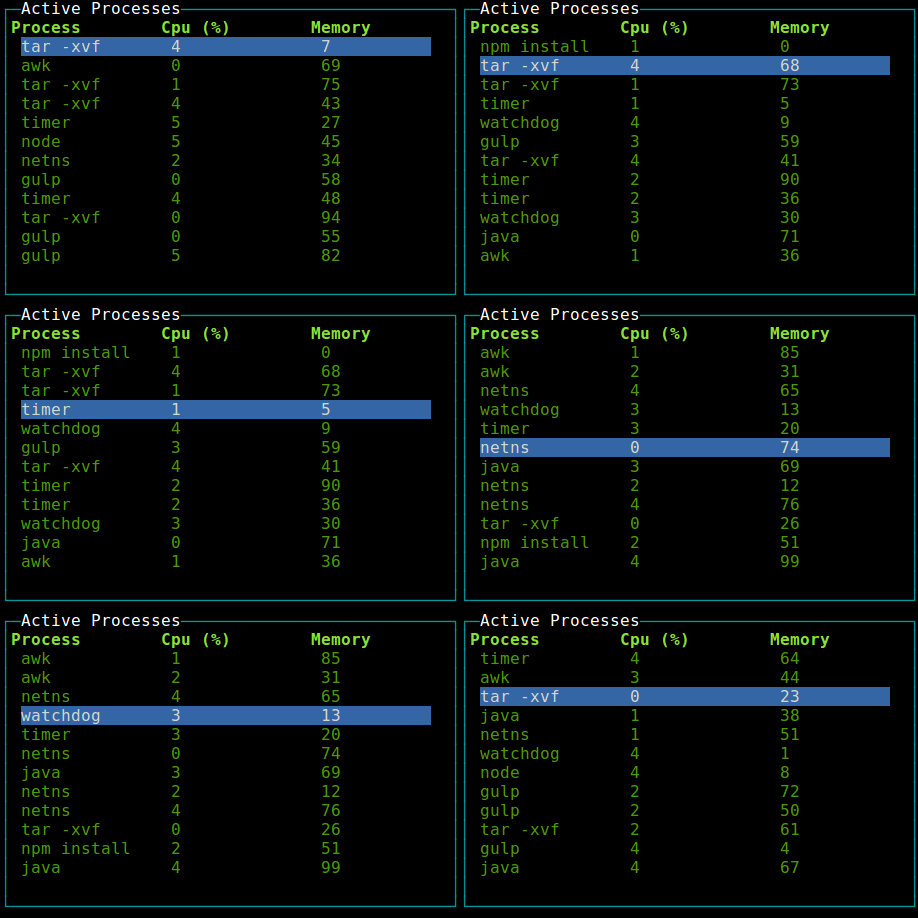
   var table = contrib.table(
     { keys: true
     , fg: 'white'
     , selectedFg: 'white'
     , selectedBg: 'blue'
     , interactive: true
     , label: 'Active Processes'
     , width: '30%'
     , height: '30%'
     , border: {type: "line", fg: "cyan"}
     , columnSpacing: 10 //in chars
     , columnWidth: [16, 12, 12] /*in chars*/ })

   //allow control the table with the keyboard
   table.focus()

   table.setData(
   { headers: ['col1', 'col2', 'col3']
   , data:
      [ [1, 2, 3]
      , [4, 5, 6] ]})
Tree
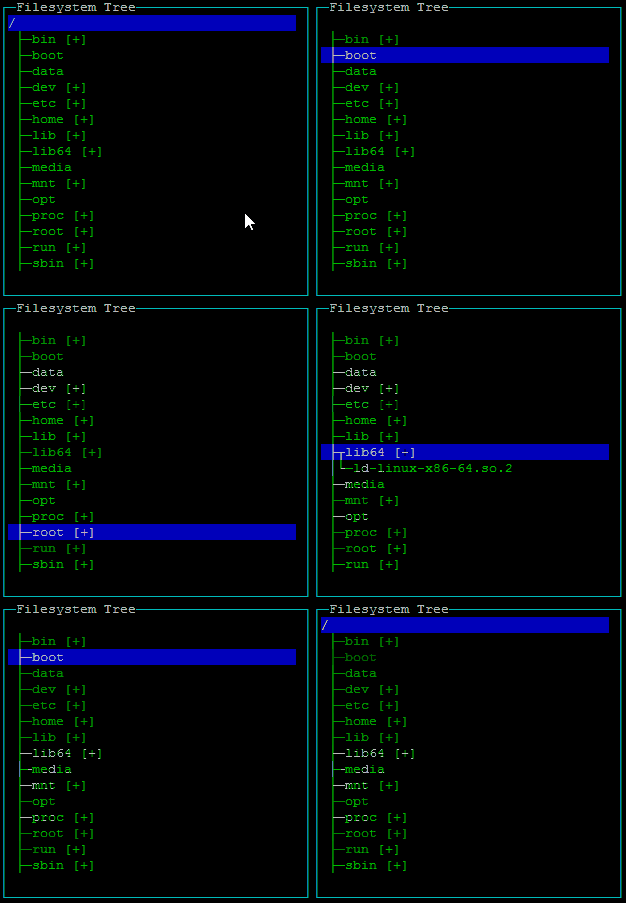
   var tree = contrib.tree({fg: 'green'})

   //allow control the table with the keyboard
   tree.focus()

   tree.on('select',function(node){
     if (node.myCustomProperty){
       console.log(node.myCustomProperty);
     }
     console.log(node.name);
   }

   // you can specify a name property at root level to display root
   tree.setData(
   { extended: true
   , children:
     {
       'Fruit':
       { children:
         { 'Banana': {}
         , 'Apple': {}
         , 'Cherry': {}
         , 'Exotics': {
             children:
             { 'Mango': {}
             , 'Papaya': {}
             , 'Kiwi': { name: 'Kiwi (not the bird!)', myCustomProperty: "hairy fruit" }
             }}
         , 'Pear': {}}}
     , 'Vegetables':
       { children:
         { 'Peas': {}
         , 'Lettuce': {}
         , 'Pepper': {}}}}})
Options
- keys : Key to expand nodes. Default : ['enter','default']
- extended : Should nodes be extended/generated by default? Be careful with this setting when using a callback function. Default : false
- template :
- extend : Suffix "icon" for closed node. Default : '[+]'
- retract : Suffix "icon" for opened node. Default : '[-]'
- lines : Show lines in tree. Default : true
Nodes
Every node is a hash and it can have custom properties that can be used in "select" event callback. However, there are several special keys :
- name
- Type :
string
- Desc : Node name
- If the node isn't the root and you don't specify the name, will be set to hash key
- Example :
{ name: 'Fruit'}
- children
- Type :
hash or function(node){ return children }
- Desc : Node children.
- The function must return a hash that could have been used as children property
- If you use a function, the result will be stored in
node.childrenContent and children
- Example :
- Hash :
{'Fruit':{ name: 'Fruit', children:{ 'Banana': {}, 'Cherry': {}}}}
- Function : see
examples/explorer.js
- childrenContent
- Type :
hash
- Desc : Children content for internal usage DO NOT MODIFY
- If
node.children is a hash, node.children===node.childrenContent
- If
node.children is a function, it's used to store the node.children() result
- You can read this property, but you should never write it.
- Usually this will be used to check
if(node.childrenContent) in your node.children function to generate children only once
- extended
- Type :
boolean
- Desc : Determine if this node is extended
- No effect when the node have no child
- Default value for each node will be
treeInstance.options.extended if the node extended option is not set
- Example :
{'Fruit':{ name: 'Fruit', extended: true, children:{ 'Banana': {}, 'Cherry': {}}}}
Markdown

   var markdown = contrib.markdown()
   markdown.setMarkdown('# Hello \n blessed-contrib renders markdown using `marked-terminal`')
Colors
You can use 256 colors (source):
  function randomColor() {
    return [Math.random() * 255,Math.random()*255, Math.random()*255]
  }

  line = contrib.line(
  {
    ...
    , style: { line: randomColor(), text: randomColor(), baseline: randomColor() }
  })
Layouts
Grid
Carousel
Grid
A grid layout can auto position your elements in a grid layout.
When using a grid, you should not create the widgets, rather specify to the grid which widget to create and with which params.
Each widget can span multiple rows and columns.
   var screen = blessed.screen()

   var grid = new contrib.grid({rows: 12, cols: 12, screen: screen})

   //grid.set(row, col, rowSpan, colSpan, obj, opts)
   var map = grid.set(0, 0, 4, 4, contrib.map, {label: 'World Map'})
   var box = grid.set(4, 4, 4, 4, blessed.box, {content: 'My Box'})

   screen.render()
Carousel
A carousel layout switches between different views based on time or keyboard activity.
One use case is an office dashboard with rotating views:
    var blessed = require('blessed')
      , contrib = require('./')
      , screen = blessed.screen()

    function page1(screen) {
       var map = contrib.map()
       screen.append(map)
    }

    function page2(screen) {
      var line = contrib.line(
       { width: 80
       , height: 30
       , left: 15
       , top: 12
       , xPadding: 5
       , label: 'Title'
       })

      var data = [ { title: 'us-east',
                 x: ['t1', 't2', 't3', 't4'],
                 y: [0, 0.0695652173913043, 0.11304347826087, 2],
                 style: {
                  line: 'red'
                 }
               }
            ]

      screen.append(line)
      line.setData(data)
    }

    screen.key(['escape', 'q', 'C-c'], function(ch, key) {
      return process.exit(0);
    });

    var carousel = new contrib.carousel( [page1, page2]
                                       , { screen: screen
                                         , interval: 3000 //how often to switch views (set 0 to never swicth automatically)
                                         , controlKeys: true  //should right and left keyboard arrows control view rotation
                                         })
    carousel.start()
Samples
Terminal Dashboard
Running the sample
git clone https://github.com/yaronn/blessed-contrib.git
cd blessed-contrib
npm install
node ./examples/dashboard.js
Installation (for a custom dashboard)
npm install blessed
npm install blessed-contrib
A simple dashboard
   var blessed = require('blessed')
     , contrib = require('blessed-contrib')
     , screen = blessed.screen()
     , grid = new contrib.grid({rows: 1, cols: 2, screen: screen})

   var line = grid.set(0, 0, 1, 1, contrib.line,
     { style:
       { line: "yellow"
       , text: "green"
       , baseline: "black"}
     , xLabelPadding: 3
     , xPadding: 5
     , label: 'Stocks'})

   var map = grid.set(0, 1, 1, 1, contrib.map, {label: 'Servers Location'})

   var lineData = {
      x: ['t1', 't2', 't3', 't4'],
      y: [5, 1, 7, 5]
   }

   line.setData([lineData])

   screen.key(['escape', 'q', 'C-c'], function(ch, key) {
     return process.exit(0);
   });

   screen.render()
Rich dashboard
See source code
Troubleshooting
If you see questions marks or some (or all) missign characters try running with these env vars to fix encoding / terminal:
$> LANG=en_US.utf8 TERM=xterm-256color node your-code.js
License
This library is under the MIT License
Created by Yaron Naveh (twitter, blog)

 blessed-contrib 是一个 JavaScript 库,基于 blessed 终端界面库,用于利用 ASCII/ANSI 字符画构建终端仪表盘和其他文本界面应用。