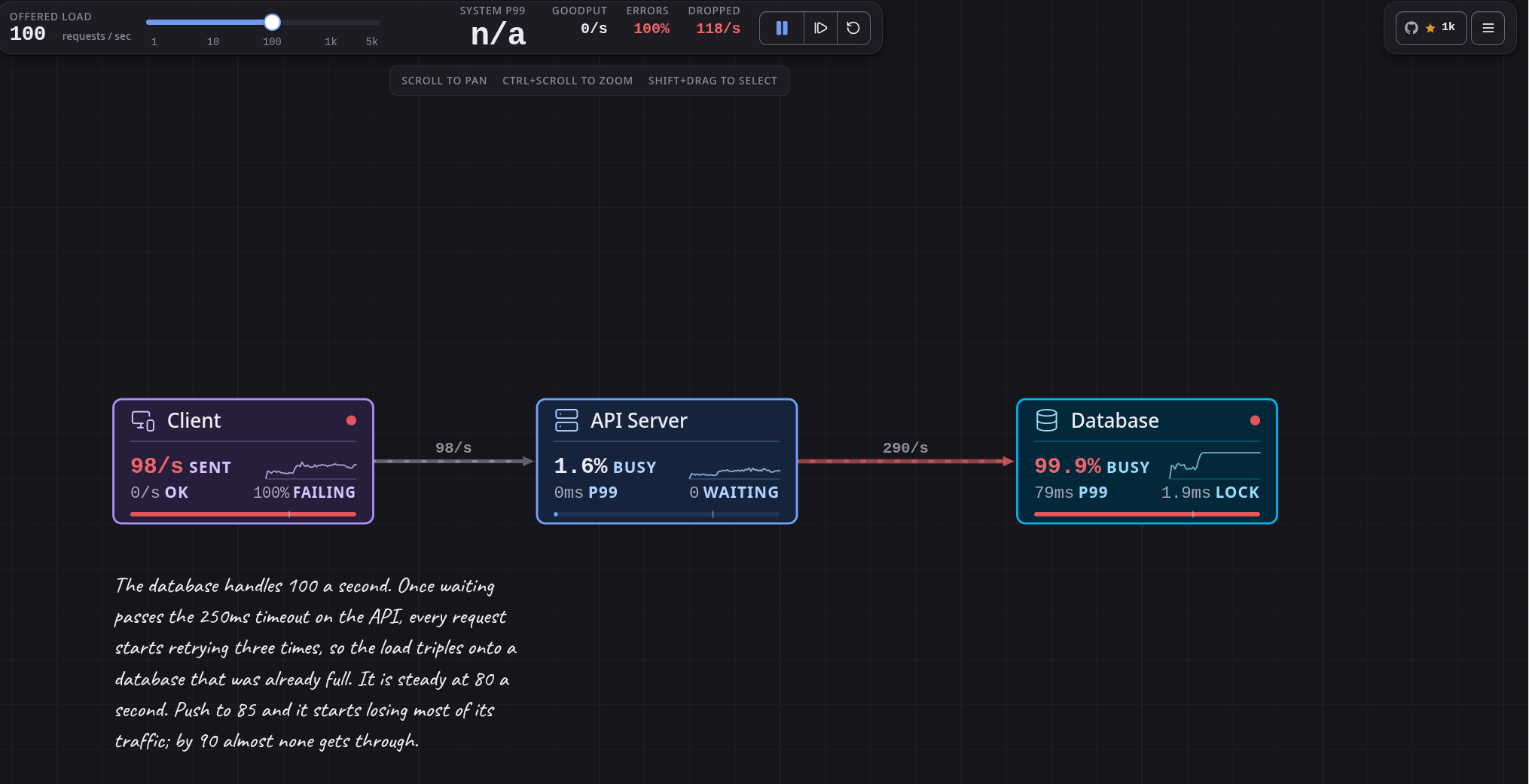
The Retry Storm example at 100 requests a second. The database is at 99.9% busy and
goodput is zero, because retries have tripled 100 offered requests into 348 hitting a
database that was already full.
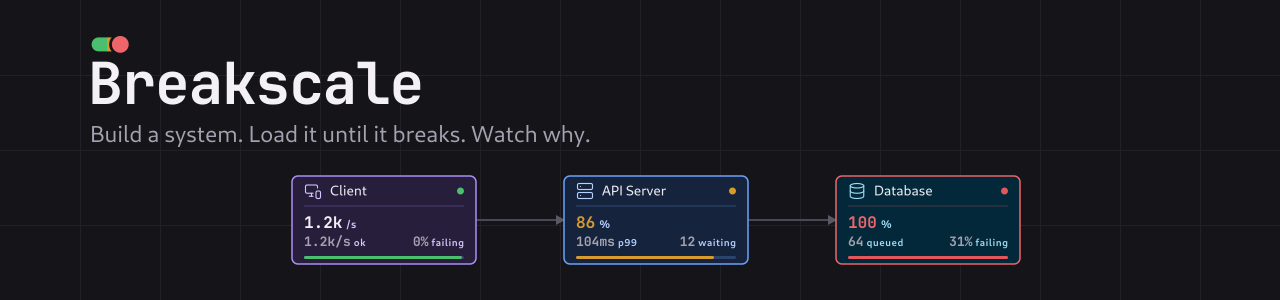
Breakscale is a system design simulator for learning how distributed systems behave under load.
You place components on a canvas, wire them together, then drag a slider and watch real queueing
behaviour emerge: latency percentiles climbing, queues filling, circuit breakers tripping, whole
systems collapsing into retry storms.
Every number comes from an actual discrete-event simulation. Nothing is faked, approximated, or
animated to look plausible.
Why this exists
Most system design material is static diagrams and rules of thumb. "Add a cache." "Use a queue."
It is hard to build intuition for why p99 latency falls off a cliff as utilisation passes 80
percent, or how a short timeout with retries turns one slow database into a total outage.
Breakscale runs the experiment instead. Load the Retry Storm example, drag the traffic up, and
watch goodput fall to zero while the database still runs flat out, because every request that
completes has already been abandoned by a caller that gave up.
git clone https://github.com/xevrion/breakscale.git
cd breakscale
bun install
bun dev
Open http://localhost:5173, pick an example from the left, and raise the traffic slider until
something goes red.
Features
33 components. Load balancers, caches, databases, queues and workers, plus CDNs, rate
limiters, circuit breakers, read replicas, sharded stores, autoscalers, stream brokers,
WebSocket gateways, serverless functions and bulkheads.
23 worked examples. Sixteen teaching scenarios and seven reconstructions of real
architectures, each one loadable in a click.
A real discrete-event engine. Finite server slots, gamma-distributed service times, measured
percentiles. No formulas standing in for a simulation.
Chaos controls. Crash a node, slow it down, force an error rate, or cut a single link.
Deterministic. The same seed and topology replay identically, every time.
Explanations built in. Every metric and unit has a plain-language definition.
Runs entirely in the browser. No account, no backend, no telemetry. Your designs stay local.
What is in it
The 23 examples are sixteen teaching scenarios, each isolating one failure mode, plus seven
reconstructions of real architectures:
Example
What it teaches
Single Server
Latency climbs sharply as the database fills up
Load Balanced
Three servers share the load, but all still talk to one database
Cache Aside
Lower the hit rate and the database takes the whole load
Async Workers
The backlog grows when workers fall behind, and drains after
Retry Storm
Retries multiply the load that caused them
Rate Limited API
Serves slightly less, but what it serves stays fast
Circuit Breaker
Break the dependency, watch the circuit trip, then recover
Sharded Database
One shard melts while the average still looks healthy
Autoscaling Service
Requests fail in the gap while new servers boot
Plus Netflix, Spotify, Discord, Uber, Twitter/X, Stripe and WhatsApp,
reconstructed from published engineering material. Each names what it models and what it leaves
out. They are teaching diagrams, not insider knowledge.
How the simulation works
The engine in src/sim is a discrete-event simulator. Requests are real objects moving through the
topology, and a few details are what make the results worth trusting:
Finite server slots. A component's capacity is how many requests it can work on at once, and
instances is how many copies of it are running. Everything beyond instances × capacity waits in
a real FIFO queue, and beyond the queue limit it is shed.
Service time variance. Service time is a mean plus a coefficient of variation, sampled from a
gamma distribution. Variance is what makes tail latency diverge from the average, so it is modelled
rather than assumed away.
Abandoned work still burns capacity. When a caller times out, the downstream keeps working on a
request nobody is waiting for. This is why retry storms are visible here rather than theoretical.
Queues acknowledge immediately. A request entering a queue resolves as success at that point
and the message is buffered for workers. Backlog depth is real, so you can watch it build and
drain.
Percentiles are measured. p50, p95 and p99 come from a ring buffer of completed request
latencies, never from multiplying a mean by a constant.
The simulation is deterministic: the same seed and topology replay identically. Correctness is
covered by a test suite asserting request conservation, that the failure breakdown sums to the
failure total, that utilisation stays within bounds, and that no snapshot field is ever NaN or
infinite.
Project layout
src/sim/         the simulation engine. No React, no DOM, no I/O
src/components/  canvas, inspector, metrics, palette
src/content/     glossary text
src/App.tsx      shell: layout, the animation loop, persistence
The engine has no UI dependency, so you can drive it from a script:
import { Engine } from './src/sim/engine';
import { PRESETS } from './src/sim/presets';

const engine = new Engine(PRESETS[0].topology, 42);
for (let i = 0; i < 600; i += 1) engine.advance(1000 / 60);
console.log(engine.snapshot().system);
Contributing
Contributions are welcome, especially new components, new teaching examples, and better
explanations. See CONTRIBUTING.md for how the project is put together and what
the bar is for a change.
The short version: the numbers have to be true. This is a tool people learn from, so a plausible
looking number is worse than no number at all.
Built with
React, TypeScript and Vite, with Lucide for icons. The canvas is hand-rolled SVG and the charts are
drawn directly rather than pulled from a charting library, which keeps the bundle small and the
rendering predictable.
The bundled Caveat webfont in public/fonts/Caveat/ is not covered by the
MIT licence. It is licensed separately under the
SIL Open Font License 1.1, which ships alongside
the font file as that licence requires.
Copyright 2014 The Caveat Project Authors.
breakscale (xevrion/breakscale)
Choose a tag and it will appear here. With no tags selected, all catalog projects are shown.
Searching Database…
Choose a tag and it will appear here. With no tags selected, all catalog projects are shown.



 Breakscale 是一个系统设计模拟器:你在画布上摆放组件、把它们连接起来,然后拖动流量滑块,观看真实的离散事件模拟呈现出延迟、排队和故障,从而了解分布式系统在负载下的行为。