

1.7K ·GitHub
Что это?
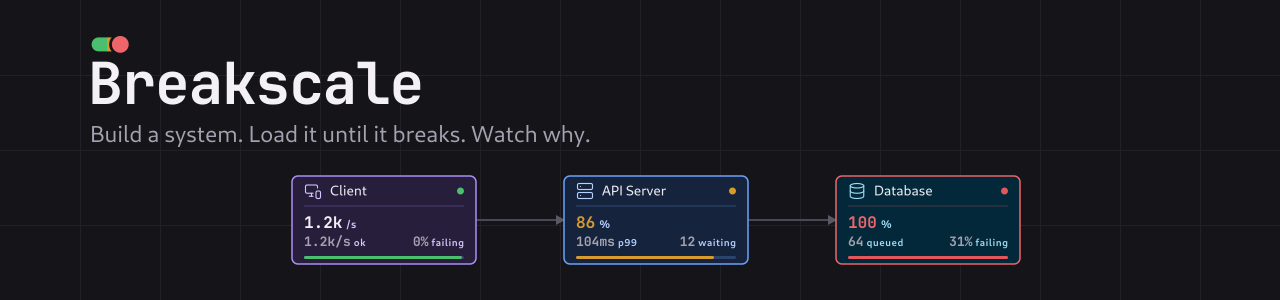
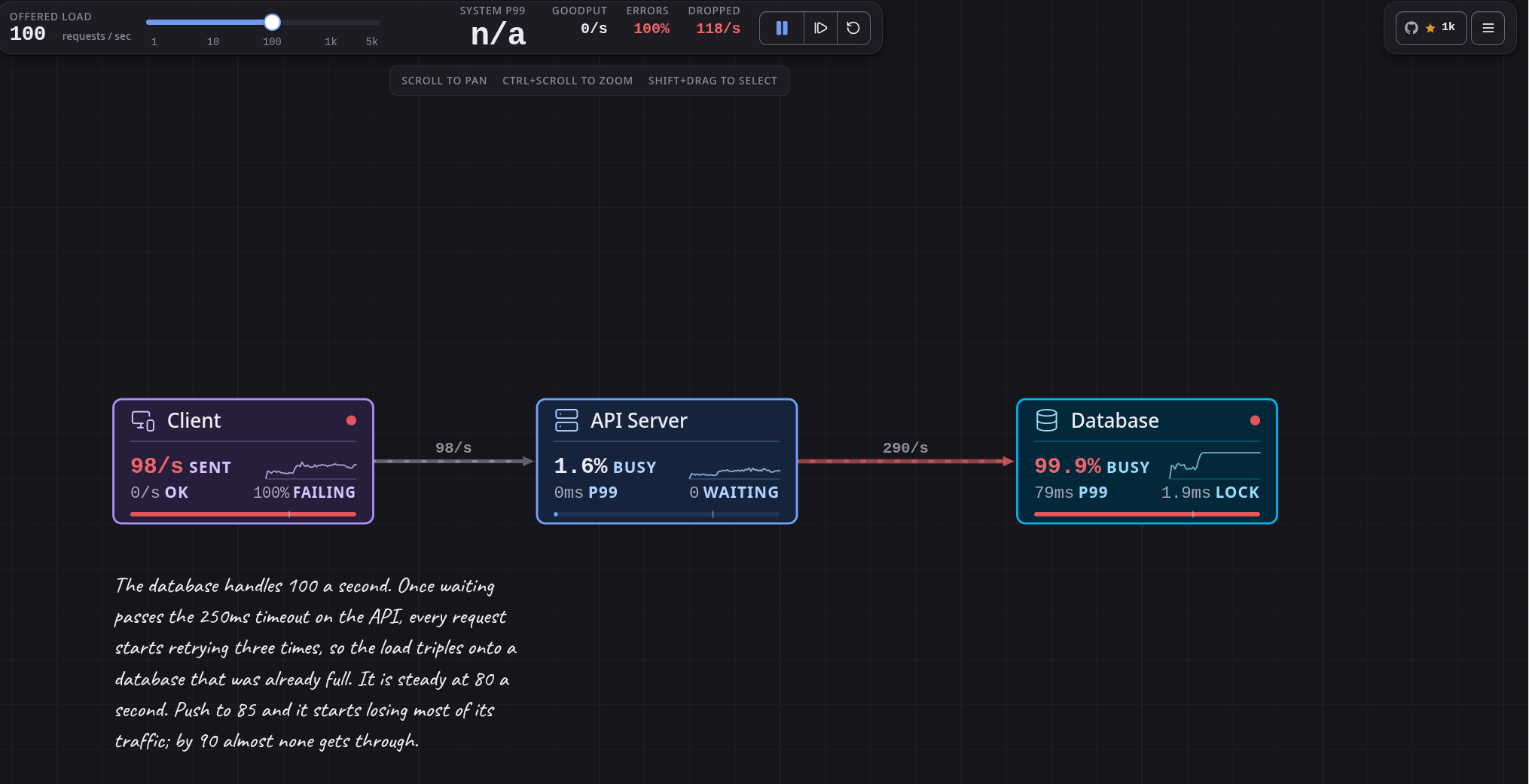
 Breakscale — симулятор проектирования систем: вы расставляете компоненты на холсте, соединяете их, тянете ползунок трафика и наблюдаете, как настоящая дискретно-событийная симуляция показывает рост задержек, очередей и отказов, — так можно понять, как распределённые системы ведут себя под нагрузкой.
Breakscale — симулятор проектирования систем: вы расставляете компоненты на холсте, соединяете их, тянете ползунок трафика и наблюдаете, как настоящая дискретно-событийная симуляция показывает рост задержек, очередей и отказов, — так можно понять, как распределённые системы ведут себя под нагрузкой.Это просто анимированные схемы или тут реально что-то симулируется?Это настоящий движок дискретно-событийной симуляции, а не визуальный трюк. Запросы моделируются как реальные объекты, движущиеся по топологии с гамма-распределённым временем обслуживания и измеренными перцентилями.
Это настоящий движок дискретно-событийной симуляции, а не визуальный трюк. Запросы моделируются как реальные объекты, движущиеся по топологии с гамма-распределённым временем обслуживания и измеренными перцентилями.Как это запустить?Запустите локально с Bun и Vite: просто откройте приложение, выберите пример в левой панели и поднимайте ползунок трафика, пока что-нибудь не сломается.
Запустите локально с Bun и Vite: просто откройте приложение, выберите пример в левой панели и поднимайте ползунок трафика, пока что-нибудь не сломается.Нужно ли что-то ещё, кроме Bun?Только Bun как JS-рантайм и пакетный менеджер; стек — React, TypeScript и Vite, иконки — Lucide.
Только Bun как JS-рантайм и пакетный менеджер; стек — React, TypeScript и Vite, иконки — Lucide.Есть ли бэкенд или мои данные куда-то отправляются?Нет, всё работает целиком в браузере — без аккаунтов, бэкенда и телеметрии, так что схемы остаются локально на вашей машине.
Нет, всё работает целиком в браузере — без аккаунтов, бэкенда и телеметрии, так что схемы остаются локально на вашей машине.Для кого это сделано?Для тех, кто учит или преподаёт распределённые системы и проектирование систем и хочет практической интуиции вместо статичных схем и эмпирических правил.
Для тех, кто учит или преподаёт распределённые системы и проектирование систем и хочет практической интуиции вместо статичных схем и эмпирических правил.Нужно ли что-то устанавливать в ОС или это просто работает в браузере?Оно полностью работает в браузере как веб-приложение; из специфичного для ОС — только Bun для локальной разработки.
Оно полностью работает в браузере как веб-приложение; из специфичного для ОС — только Bun для локальной разработки.Он отслеживает использование или отправляет телеметрию?Нет, телеметрии нет, и из вашего браузера ничего не уходит.
Нет, телеметрии нет, и из вашего браузера ничего не уходит.Из каких компонентов можно собирать системы?Есть 33 компонента, включая балансировщики нагрузки, кэши, базы данных, очереди, воркеры, CDN, ограничители частоты запросов, circuit breakers, read-реплики, шардированные хранилища, автоскейлеры, брокеры потоков, WebSocket-шлюзы, serverless-функции и переборки (bulkheads).
Есть 33 компонента, включая балансировщики нагрузки, кэши, базы данных, очереди, воркеры, CDN, ограничители частоты запросов, circuit breakers, read-реплики, шардированные хранилища, автоскейлеры, брокеры потоков, WebSocket-шлюзы, serverless-функции и переборки (bulkheads).Какие примеры входят в комплект?23 разобранных примера: 16 обучающих сценариев, каждый из которых изолирует один режим отказа (вроде Retry Storm или Circuit Breaker), плюс 7 реконструкций реальных архитектур из Netflix, Spotify, Discord, Uber, Twitter/X, Stripe и WhatsApp.
23 разобранных примера: 16 обучающих сценариев, каждый из которых изолирует один режим отказа (вроде Retry Storm или Circuit Breaker), плюс 7 реконструкций реальных архитектур из Netflix, Spotify, Discord, Uber, Twitter/X, Stripe и WhatsApp.Можно ли вносить сбои, чтобы увидеть реакцию системы?Да, хаос-управление позволяет уронить узел, замедлить его, принудительно задать долю ошибок или разорвать конкретную связь, а симуляция детерминирована, так что одинаковые сид и топология всегда воспроизводятся одинаково.
Да, хаос-управление позволяет уронить узел, замедлить его, принудительно задать долю ошибок или разорвать конкретную связь, а симуляция детерминирована, так что одинаковые сид и топология всегда воспроизводятся одинаково.Почему автор построил симулятор, а не просто ещё больше схем?Статичные схемы и эмпирические правила вроде «добавь кэш» не дают настоящей интуиции о том, почему p99-задержка взлетает за 80% загрузки; Breakscale запускает настоящий эксперимент, и вы можете наблюдать это вживую.
Статичные схемы и эмпирические правила вроде «добавь кэш» не дают настоящей интуиции о том, почему p99-задержка взлетает за 80% загрузки; Breakscale запускает настоящий эксперимент, и вы можете наблюдать это вживую.What are similar projects?empire, vistep, gitdiagram, bible-strong-avatar-lab, human-atlas, developer-roadmap, loadersz-core, gpt_image_playground
empire, vistep, gitdiagram, bible-strong-avatar-lab, human-atlas, developer-roadmap, loadersz-core, gpt_image_playgroundWhich topics is it in?teaching-tool, simulator, system-design, canvas, vite, distributed-systems, learning, web-app, react, privacy, education, frontend
teaching-tool, simulator, system-design, canvas, vite, distributed-systems, learning, web-app, react, privacy, education, frontend