

1.7K ·GitHub
What is this?
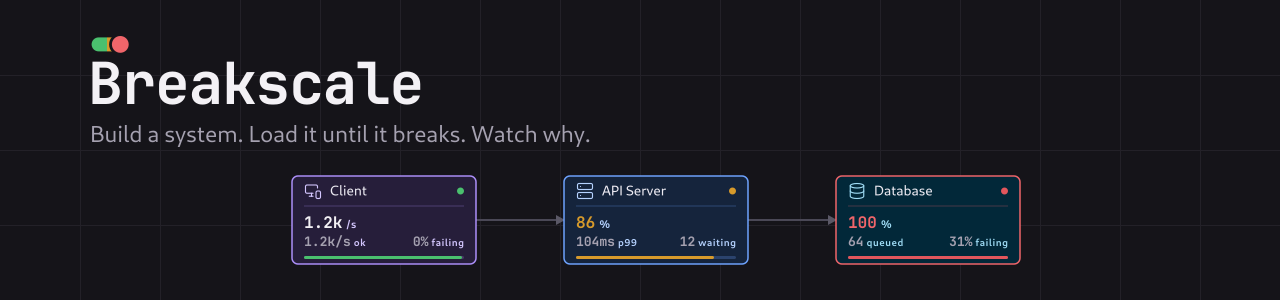
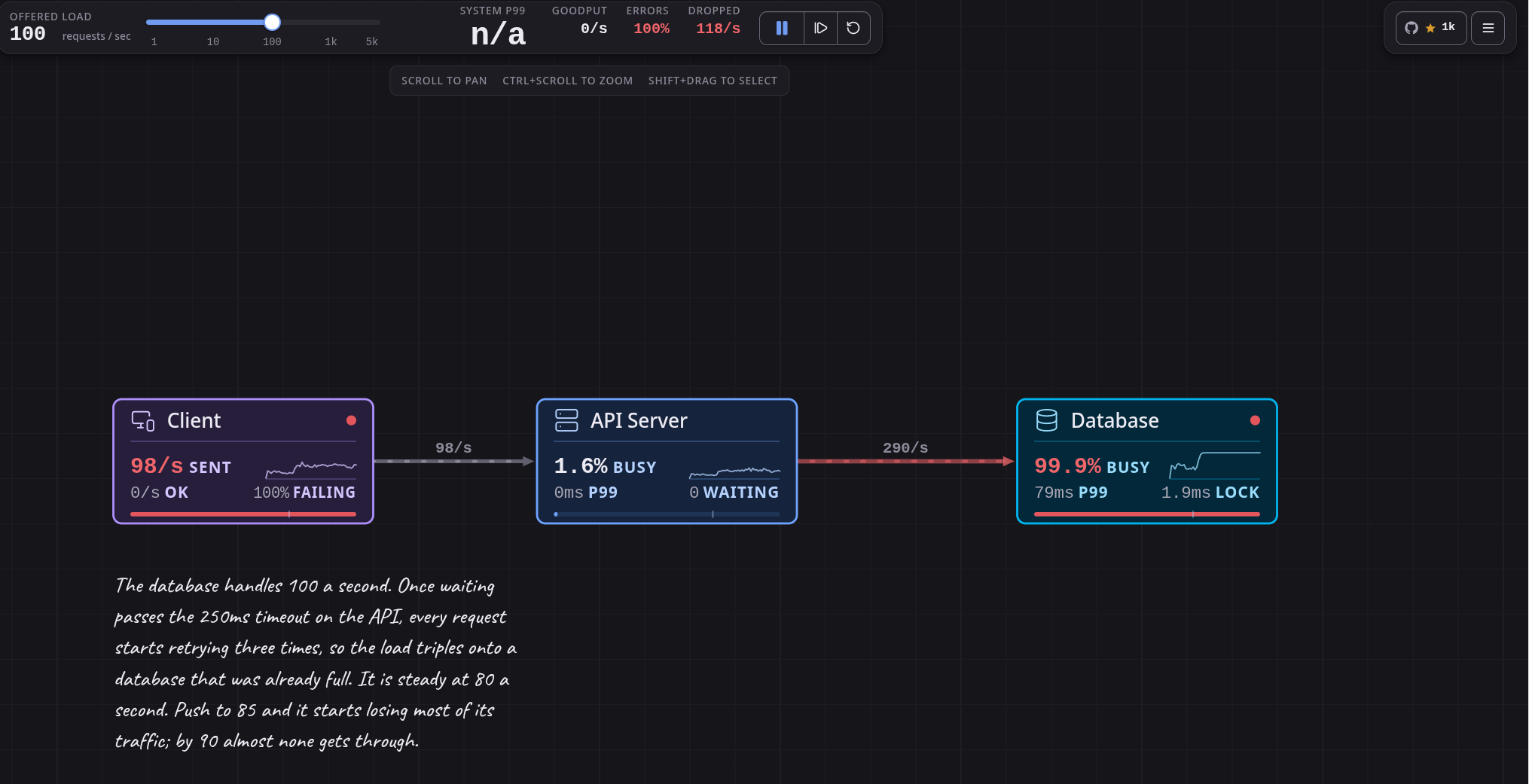
 Breakscale is a system design simulator where you place components on a canvas, wire them together, then drag a traffic slider and watch a real discrete-event simulation show latency, queues, and failures emerge, so you can learn how distributed systems behave under load.
Is this just animated diagrams, or does it actually simulate something?It is a real discrete-event simulation engine, not a visual trick. Requests are modeled as real objects moving through the topology with gamma-distributed service times and measured percentiles.
It is a real discrete-event simulation engine, not a visual trick. Requests are modeled as real objects moving through the topology with gamma-distributed service times and measured percentiles.How do I get it running?Run it locally with Bun and Vite: just open the app, pick an example from the left panel, and raise the traffic slider until something fails.
Run it locally with Bun and Vite: just open the app, pick an example from the left panel, and raise the traffic slider until something fails.Do I need anything besides Bun to run it?Just Bun as the JS runtime/package manager; the stack is React, TypeScript and Vite, with Lucide for icons.
Just Bun as the JS runtime/package manager; the stack is React, TypeScript and Vite, with Lucide for icons.Is there a backend or does my data get sent anywhere?No, everything runs entirely in the browser with no account, backend, or telemetry, so designs stay local to your machine.
No, everything runs entirely in the browser with no account, backend, or telemetry, so designs stay local to your machine.Who is this built for?It's built for people learning or teaching distributed systems and system design, wanting hands-on intuition instead of static diagrams and rules of thumb.
It's built for people learning or teaching distributed systems and system design, wanting hands-on intuition instead of static diagrams and rules of thumb.Do I need to install anything on my OS, or does it just run in a browser?It runs entirely in the browser as a web app; no OS-specific install beyond Bun for local development.
It runs entirely in the browser as a web app; no OS-specific install beyond Bun for local development.Does it track usage or send telemetry anywhere?No, there is no telemetry and nothing leaves your browser.
No, there is no telemetry and nothing leaves your browser.What components can I build systems with?There are 33 components including load balancers, caches, databases, queues, workers, CDNs, rate limiters, circuit breakers, read replicas, sharded stores, autoscalers, stream brokers, WebSocket gateways, serverless functions and bulkheads.
There are 33 components including load balancers, caches, databases, queues, workers, CDNs, rate limiters, circuit breakers, read replicas, sharded stores, autoscalers, stream brokers, WebSocket gateways, serverless functions and bulkheads.What kind of examples are included?23 worked examples: 16 teaching scenarios each isolating one failure mode (like Retry Storm or Circuit Breaker), plus 7 reconstructions of real architectures from Netflix, Spotify, Discord, Uber, Twitter/X, Stripe and WhatsApp.
23 worked examples: 16 teaching scenarios each isolating one failure mode (like Retry Storm or Circuit Breaker), plus 7 reconstructions of real architectures from Netflix, Spotify, Discord, Uber, Twitter/X, Stripe and WhatsApp.Can I inject failures to see how the system reacts?Yes, chaos controls let you crash a node, slow it down, force an error rate, or cut a single link, and the simulation is deterministic so the same seed and topology always replay identically.
Yes, chaos controls let you crash a node, slow it down, force an error rate, or cut a single link, and the simulation is deterministic so the same seed and topology always replay identically.Why did the author build a simulator instead of more diagrams?Static diagrams and rules of thumb like 'add a cache' don't build real intuition for things like why p99 latency spikes past 80% utilization; Breakscale runs the actual experiment so you can watch it happen.
Static diagrams and rules of thumb like 'add a cache' don't build real intuition for things like why p99 latency spikes past 80% utilization; Breakscale runs the actual experiment so you can watch it happen.What are similar projects?empire, vistep, gitdiagram, bible-strong-avatar-lab, human-atlas, developer-roadmap, loadersz-core, gpt_image_playground
empire, vistep, gitdiagram, bible-strong-avatar-lab, human-atlas, developer-roadmap, loadersz-core, gpt_image_playgroundWhich topics is it in?teaching-tool, simulator, system-design, canvas, vite, distributed-systems, learning, web-app, react, privacy, education, frontend
teaching-tool, simulator, system-design, canvas, vite, distributed-systems, learning, web-app, react, privacy, education, frontend