Vega-Altair 




Vega-Altair is a declarative statistical visualization library for Python. With Vega-Altair, you can spend more time understanding your data and its meaning. Vega-Altair's
API is simple, friendly and consistent and built on top of the powerful
Vega-Lite JSON specification. This elegant
simplicity produces beautiful and effective visualizations with a minimal amount of code.
Vega-Altair was originally developed by Jake Vanderplas and Brian
Granger in close collaboration with the UW
Interactive Data Lab.
The Vega-Altair open source project is not affiliated with Altair Engineering, Inc.
Documentation
See Vega-Altair's Documentation Site as well as the Tutorial Notebooks. You can
run the notebooks directly in your browser by clicking on one of the following badges:


Example
Here is an example using Vega-Altair to quickly visualize and display a dataset with the native Vega-Lite renderer in the JupyterLab:
import altair as alt

# load a simple dataset as a pandas DataFrame
from altair.datasets import data

cars = data.cars()

alt.Chart(cars).mark_point().encode(
    x="Horsepower",
    y="Miles_per_Gallon",
    color="Origin",
)
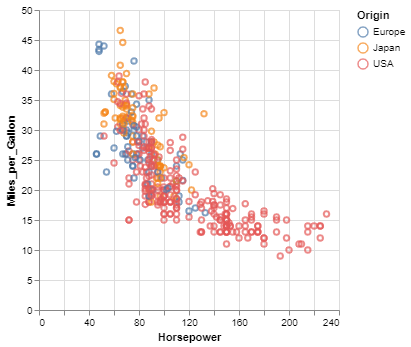
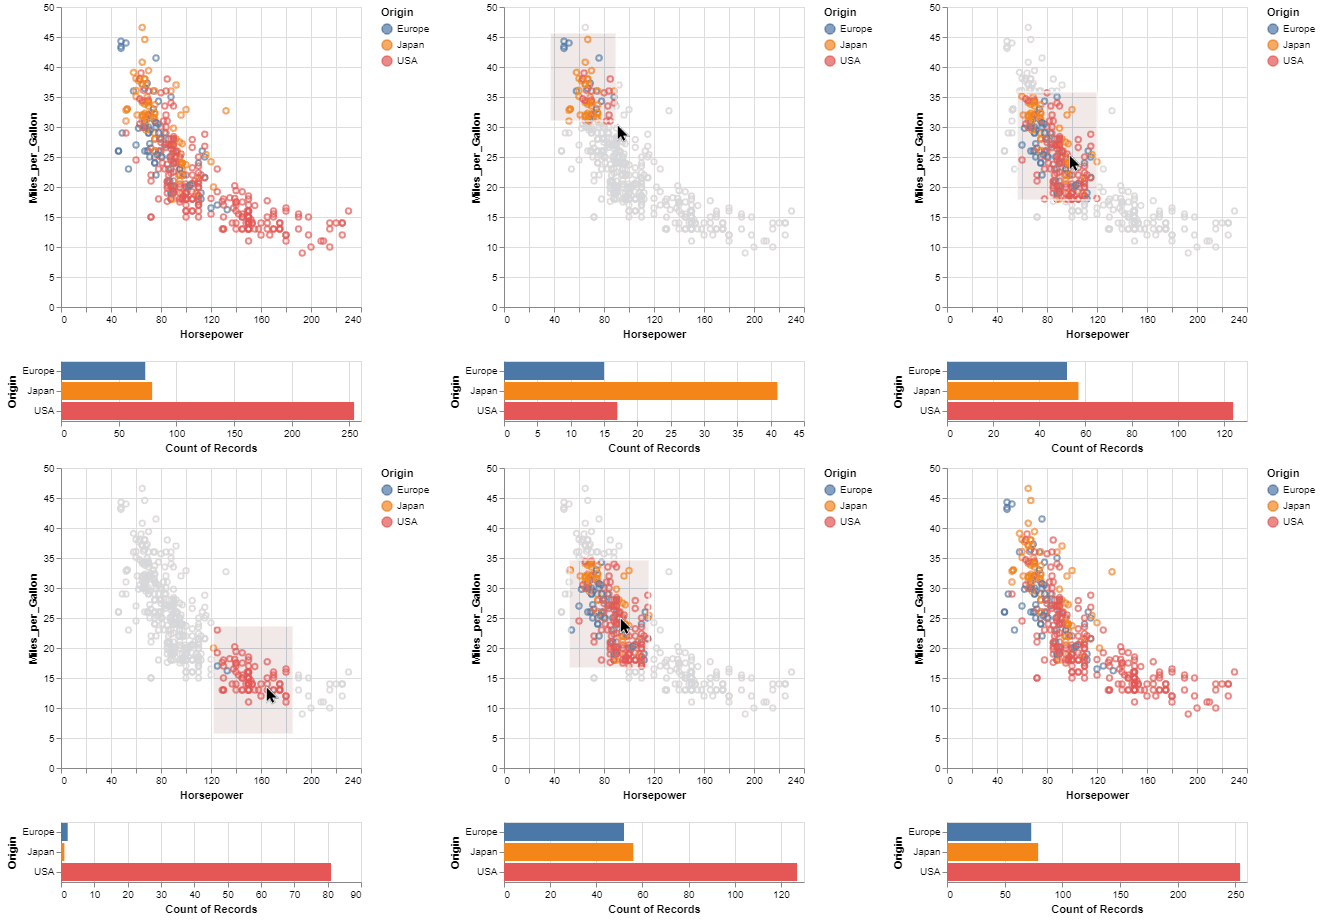
One of the unique features of Vega-Altair, inherited from Vega-Lite, is a declarative grammar of not just visualization, but interaction.
With a few modifications to the example above we can create a linked histogram that is filtered based on a selection of the scatter plot.
import altair as alt
from altair.datasets import data

source = data.cars()

brush = alt.selection_interval()

points = alt.Chart(source).mark_point().encode(
    x="Horsepower",
    y="Miles_per_Gallon",
    color=alt.when(brush).then("Origin").otherwise(alt.value("lightgray")),
).add_params(
    brush
)

bars = alt.Chart(source).mark_bar().encode(
    x="count(Origin)",
    y="Origin",
    color="Origin",
).transform_filter(
    brush
)

points & bars
Features
- Carefully-designed, declarative Python API.
- Auto-generated internal Python API that guarantees visualizations are type-checked and
in full conformance with the Vega-Lite
specification.
- Display visualizations in JupyterLab, Jupyter Notebook, Visual Studio Code, on GitHub and
nbviewer, and many more.
- Export visualizations to various formats such as PNG/SVG images, stand-alone HTML pages and the
Online Vega-Lite Editor.
- Serialize visualizations as JSON files.
Installation
Vega-Altair can be installed with:
pip install altair
If you are using the conda package manager, the equivalent is:
conda install altair -c conda-forge
For full installation instructions, please see the documentation.
Getting Help
If you have a question that is not addressed in the documentation,
you can post it on StackOverflow using the altair tag.
For bugs and feature requests, please open a Github Issue.
Development


For information on how to contribute your developments back to the Vega-Altair repository, see
CONTRIBUTING.md
Citing Vega-Altair
If you use Vega-Altair in academic work, please consider citing https://joss.theoj.org/papers/10.21105/joss.01057 as
@article{VanderPlas2018,
    doi = {10.21105/joss.01057},
    url = {https://doi.org/10.21105/joss.01057},
    year = {2018},
    publisher = {The Open Journal},
    volume = {3},
    number = {32},
    pages = {1057},
    author = {Jacob VanderPlas and Brian Granger and Jeffrey Heer and Dominik Moritz and Kanit Wongsuphasawat and Arvind Satyanarayan and Eitan Lees and Ilia Timofeev and Ben Welsh and Scott Sievert},
    title = {Altair: Interactive Statistical Visualizations for Python},
    journal = {Journal of Open Source Software}
}
Please additionally consider citing the Vega-Lite project, which Vega-Altair is based on: https://dl.acm.org/doi/10.1109/TVCG.2016.2599030
@article{Satyanarayan2017,
    author={Satyanarayan, Arvind and Moritz, Dominik and Wongsuphasawat, Kanit and Heer, Jeffrey},
    title={Vega-Lite: A Grammar of Interactive Graphics},
    journal={IEEE transactions on visualization and computer graphics},
    year={2017},
    volume={23},
    number={1},
    pages={341-350},
    publisher={IEEE}
}

 Vega-Altair 是一个用于 Python 的声明式统计可视化库,让你通过描述数据映射关系来构建图表,而不是使用绘图命令。