








What is this?
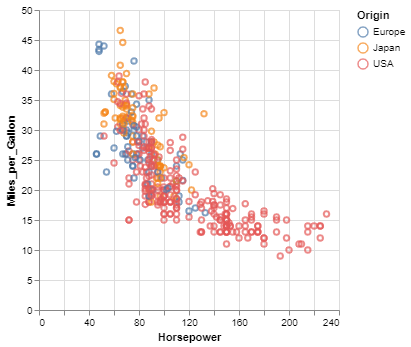
 Vega-Altair is a declarative statistical visualization library for Python, letting you build charts by describing data mappings instead of drawing commands.
Vega-Altair is a declarative statistical visualization library for Python, letting you build charts by describing data mappings instead of drawing commands.Is it a plotting library or a full app?It's a Python library that wraps the Vega-Lite JSON specification with a type-checked Python API, rendering charts inline rather than running as a standalone app.
It's a Python library that wraps the Vega-Lite JSON specification with a type-checked Python API, rendering charts inline rather than running as a standalone app.How do I install it and make my first chart?Install via pip or conda, then import altair and pass a DataFrame to a Chart object with encodings to render it in Jupyter or VS Code.
Install via pip or conda, then import altair and pass a DataFrame to a Chart object with encodings to render it in Jupyter or VS Code.Do I need Jupyter to use it?Not strictly required, but it's designed to display natively in JupyterLab, Jupyter Notebook, and VS Code, and can also export to standalone HTML or static images.
Not strictly required, but it's designed to display natively in JupyterLab, Jupyter Notebook, and VS Code, and can also export to standalone HTML or static images.Does it generate the charts itself or hand off to another renderer?Rendering is delegated to the Vega-Lite JS engine, so the actual chart drawing happens via that underlying spec, not Altair's Python code directly.
Rendering is delegated to the Vega-Lite JS engine, so the actual chart drawing happens via that underlying spec, not Altair's Python code directly.Can I export my charts to other formats?Yes, visualizations can be exported to PNG/SVG images, stand-alone HTML pages, the Online Vega-Lite Editor, or serialized as JSON files.
Yes, visualizations can be exported to PNG/SVG images, stand-alone HTML pages, the Online Vega-Lite Editor, or serialized as JSON files.Does it support interactive charts like linked selections?Yes, Altair inherits Vega-Lite's declarative grammar of interaction, so you can build things like a histogram that filters based on a scatter plot selection with only minor changes to a static chart.
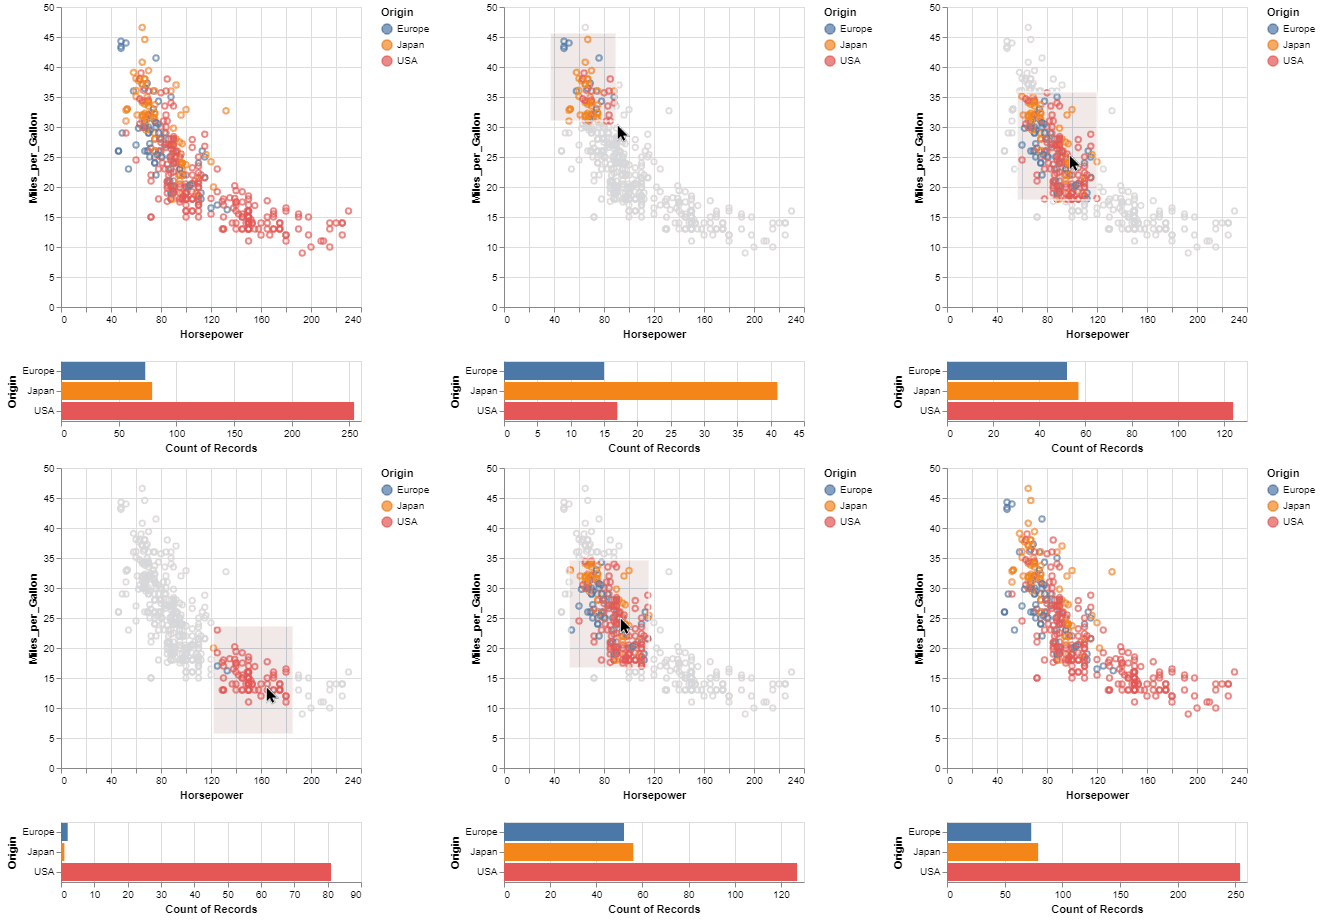
Yes, Altair inherits Vega-Lite's declarative grammar of interaction, so you can build things like a histogram that filters based on a scatter plot selection with only minor changes to a static chart.What are similar projects?matplotlib, plotly.py, bokeh, fg-data-profiling, DeepAnalyze, notebook, prettymaps, pygwalker
matplotlib, plotly.py, bokeh, fg-data-profiling, DeepAnalyze, notebook, prettymaps, pygwalkerWhich topics is it in?charting-library, data, jupyter, jupyter-notebook, data-analysis, academic, visualization, data-visualization, data-science, json, bsd, dashboard
charting-library, data, jupyter, jupyter-notebook, data-analysis, academic, visualization, data-visualization, data-science, json, bsd, dashboard