



What is this?
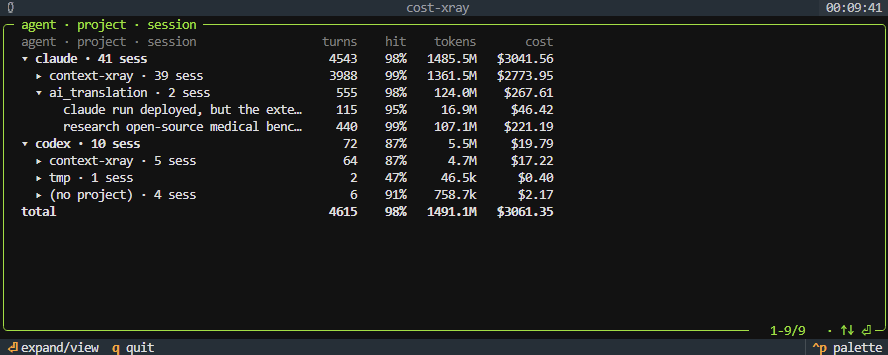
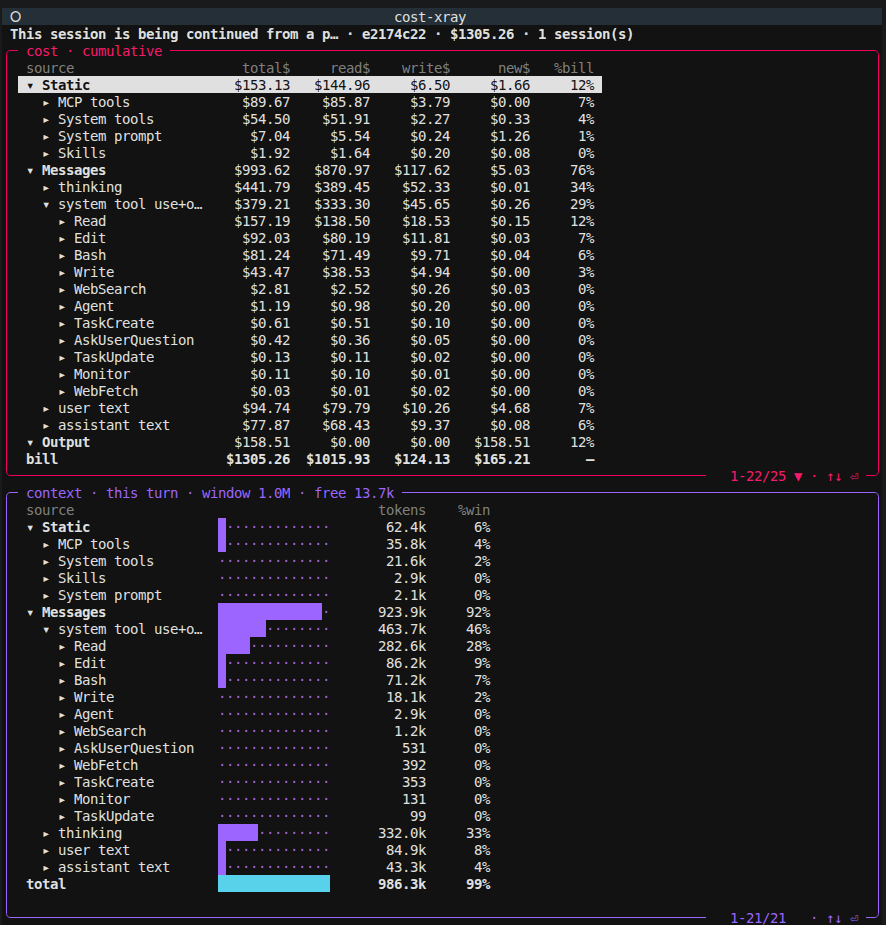
 cost-xray is a local tool that captures the raw API traffic between Claude Code or Codex and their providers, then breaks down exactly what's in each request and what each part costs — system prompts, tool schemas, MCP blocks, cached vs fresh tokens, and more.
cost-xray is a local tool that captures the raw API traffic between Claude Code or Codex and their providers, then breaks down exactly what's in each request and what each part costs — system prompts, tool schemas, MCP blocks, cached vs fresh tokens, and more.Is this a logging dashboard like ccusage, or something different?It's different from log-based tools: instead of reading local transcripts after a session ends, it runs a local proxy that intercepts the actual API requests, so it sees hidden pieces like system prompts and injected tool schemas that never show up in a transcript.
It's different from log-based tools: instead of reading local transcripts after a session ends, it runs a local proxy that intercepts the actual API requests, so it sees hidden pieces like system prompts and injected tool schemas that never show up in a transcript.How do I get it running?Run the installer (curl ... | bash, or ./install.sh if you've already cloned the repo); it asks which agent(s) to capture — Claude Code, Codex, or both. After that, just open a new terminal and run claude or codex as usual; capture starts automatically as a background service.
Run the installer (curl ... | bash, or ./install.sh if you've already cloned the repo); it asks which agent(s) to capture — Claude Code, Codex, or both. After that, just open a new terminal and run claude or codex as usual; capture starts automatically as a background service.Do I need an API key or to change my agent's config?No — no API keys, no account, and no config changes to Claude Code or Codex are needed; capture is a transparent local proxy hop. You just need a supported agent already installed, on macOS or Linux.
No — no API keys, no account, and no config changes to Claude Code or Codex are needed; capture is a transparent local proxy hop. You just need a supported agent already installed, on macOS or Linux.Does it pick up sessions I already had running?No, it's forward-only — only sessions started in a new terminal after install get captured, not past history. Also note that for Claude, the private tokenizer means per-source token splits are estimated (calibrated against real totals), not exact.
No, it's forward-only — only sessions started in a new terminal after install get captured, not past history. Also note that for Claude, the private tokenizer means per-source token splits are estimated (calibrated against real totals), not exact.Does it run on Windows?Not stated for Windows — only macOS and Linux are listed as supported, with GUI agents like Cursor needing manual base-URL setup.
Not stated for Windows — only macOS and Linux are listed as supported, with GUI agents like Cursor needing manual base-URL setup.What happens to my API keys and secrets as they pass through the capture proxy?They're redacted before anything touches disk — Authorization headers, API keys, cookies and secret-looking body fields are stripped. The proxy only binds to 127.0.0.1, sends no telemetry, and everything lives locally under ~/.cost-xray/ until you delete it.
They're redacted before anything touches disk — Authorization headers, API keys, cookies and secret-looking body fields are stripped. The proxy only binds to 127.0.0.1, sends no telemetry, and everything lives locally under ~/.cost-xray/ until you delete it.What does the window occupancy view show?It breaks down what's currently filling the model's context window — system prompt, each tool schema, MCP servers, messages, and output — so you can see what's crowding things out even when it's cheap thanks to caching.
It breaks down what's currently filling the model's context window — system prompt, each tool schema, MCP servers, messages, and output — so you can see what's crowding things out even when it's cheap thanks to caching.Can it tell me if an MCP server is wasted overhead?Yes — it flags configured MCP servers or tools whose schemas get injected into every request's prefix but are never actually called, exposing the dead weight you're paying for on every turn.
Yes — it flags configured MCP servers or tools whose schemas get injected into every request's prefix but are never actually called, exposing the dead weight you're paying for on every turn.What happens if the capture proxy crashes?The per-agent wrapper is self-healing: if the proxy goes down it restarts and routes through, and if it still can't connect, the agent simply runs direct — capture never breaks your agent.
The per-agent wrapper is self-healing: if the proxy goes down it restarts and routes through, and if it still can't connect, the agent simply runs direct — capture never breaks your agent.Why not just use a log-based tool like ccusage?Log readers only see the transcript after the fact, missing the system prompt, injected tool schemas, and MCP blocks assembled at request time — which can be roughly half the context or more; cost-xray reads the raw wire traffic instead.
Log readers only see the transcript after the fact, missing the system prompt, injected tool schemas, and MCP blocks assembled at request time — which can be roughly half the context or more; cost-xray reads the raw wire traffic instead.What are similar projects?ThinkWatch-Lite, casbin-gateway, pxpipe, tokscale, codeburn, lean-ctx, headroom, billion-context
ThinkWatch-Lite, casbin-gateway, pxpipe, tokscale, codeburn, lean-ctx, headroom, billion-contextWhich topics is it in?prompt-caching, llm-observability, cost-optimization, cost-tracking, ai-coding-agent, token-usage, codex-cli, reverse-proxy, tui, observability, proxy, anthropic
prompt-caching, llm-observability, cost-optimization, cost-tracking, ai-coding-agent, token-usage, codex-cli, reverse-proxy, tui, observability, proxy, anthropic