Kronos: A Foundation Model for the Language of Financial Markets

Kronos is the first open-source foundation model for financial candlesticks (K-lines),
trained on data from over 45 global exchanges.
📰 News
- 🚩 [2025.11.10] Kronos has been accpeted by AAAI 2026.
- 🚩 [2025.08.17] We have released the scripts for fine-tuning! Check them out to adapt Kronos to your own tasks.
- 🚩 [2025.08.02] Our paper is now available on arXiv!
📜 Introduction
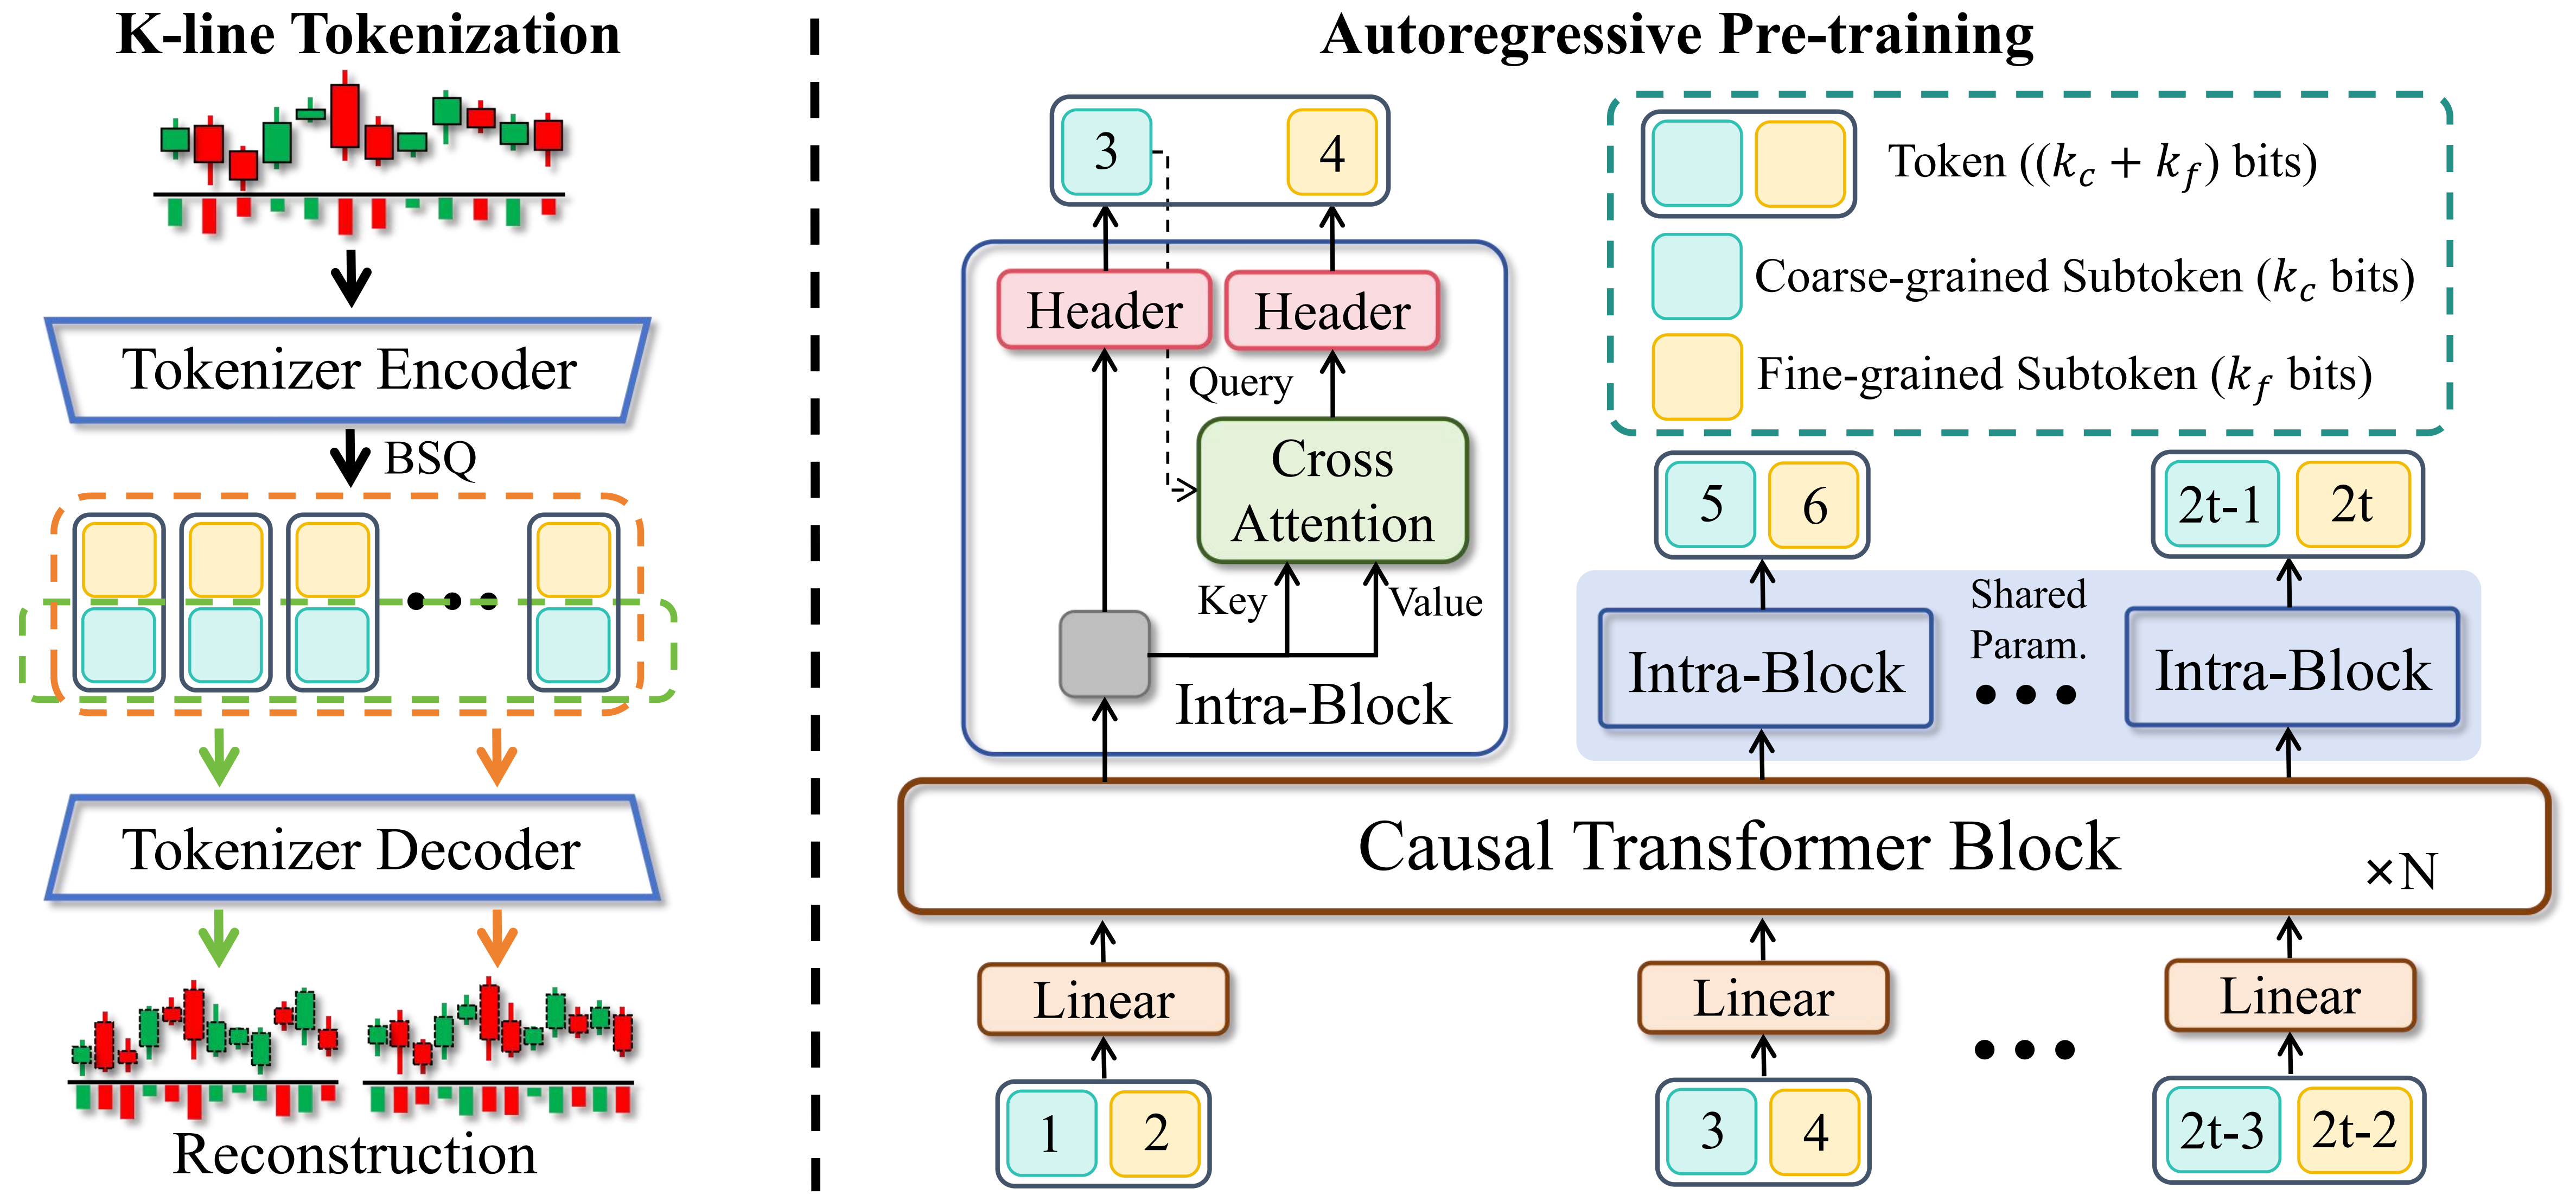
Kronos is a family of decoder-only foundation models, pre-trained specifically for the "language" of financial markets—K-line sequences. Unlike general-purpose TSFMs, Kronos is designed to handle the unique, high-noise characteristics of financial data. It leverages a novel two-stage framework:
- A specialized tokenizer first quantizes continuous, multi-dimensional K-line data (OHLCV) into hierarchical discrete tokens.
- A large, autoregressive Transformer is then pre-trained on these tokens, enabling it to serve as a unified model for diverse quantitative tasks.
✨ Live Demo
We have set up a live demo to visualize Kronos's forecasting results. The webpage showcases a forecast for the BTC/USDT trading pair over the next 24 hours.
👉 Access the Live Demo Here
📦 Model Zoo
We release a family of pre-trained models with varying capacities to suit different computational and application needs. All models are readily accessible from the Hugging Face Hub.
🚀 Getting Started
Installation
- Install Python 3.10+, and then install the dependencies:
pip install -r requirements.txt
📈 Making Forecasts
Forecasting with Kronos is straightforward using the KronosPredictor class. It handles data preprocessing, normalization, prediction, and inverse normalization, allowing you to get from raw data to forecasts in just a few lines of code.
Important Note: The max_context for Kronos-small and Kronos-base is 512. This is the maximum sequence length the model can process. For optimal performance, it is recommended that your input data length (i.e., lookback) does not exceed this limit. The KronosPredictor will automatically handle truncation for longer contexts.
Here is a step-by-step guide to making your first forecast.
1. Load the Tokenizer and Model
First, load a pre-trained Kronos model and its corresponding tokenizer from the Hugging Face Hub.
from model import Kronos, KronosTokenizer, KronosPredictor

# Load from Hugging Face Hub
tokenizer = KronosTokenizer.from_pretrained("NeoQuasar/Kronos-Tokenizer-base")
model = Kronos.from_pretrained("NeoQuasar/Kronos-small")
2. Instantiate the Predictor
Create an instance of KronosPredictor, passing the model, tokenizer, and desired device.
# Initialize the predictor
predictor = KronosPredictor(model, tokenizer, max_context=512)
The predict method requires three main inputs:
df: A pandas DataFrame containing the historical K-line data. It must include columns ['open', 'high', 'low', 'close']. volume and amount are optional.x_timestamp: A pandas Series of timestamps corresponding to the historical data in df.y_timestamp: A pandas Series of timestamps for the future periods you want to predict.
import pandas as pd

# Load your data
df = pd.read_csv("./data/XSHG_5min_600977.csv")
df['timestamps'] = pd.to_datetime(df['timestamps'])

# Define context window and prediction length
lookback = 400
pred_len = 120

# Prepare inputs for the predictor
x_df = df.loc[:lookback-1, ['open', 'high', 'low', 'close', 'volume', 'amount']]
x_timestamp = df.loc[:lookback-1, 'timestamps']
y_timestamp = df.loc[lookback:lookback+pred_len-1, 'timestamps']
4. Generate Forecasts
Call the predict method to generate forecasts. You can control the sampling process with parameters like T, top_p, and sample_count for probabilistic forecasting.
# Generate predictions
pred_df = predictor.predict(
    df=x_df,
    x_timestamp=x_timestamp,
    y_timestamp=y_timestamp,
    pred_len=pred_len,
    T=1.0,          # Temperature for sampling
    top_p=0.9,      # Nucleus sampling probability
    sample_count=1  # Number of forecast paths to generate and average
)

print("Forecasted Data Head:")
print(pred_df.head())
The predict method returns a pandas DataFrame containing the forecasted values for open, high, low, close, volume, and amount, indexed by the y_timestamp you provided.
For efficient processing of multiple time series, Kronos provides a predict_batch method that enables parallel prediction on multiple datasets simultaneously. This is particularly useful when you need to forecast multiple assets or time periods at once.
# Prepare multiple datasets for batch prediction
df_list = [df1, df2, df3]  # List of DataFrames
x_timestamp_list = [x_ts1, x_ts2, x_ts3]  # List of historical timestamps
y_timestamp_list = [y_ts1, y_ts2, y_ts3]  # List of future timestamps

# Generate batch predictions
pred_df_list = predictor.predict_batch(
    df_list=df_list,
    x_timestamp_list=x_timestamp_list,
    y_timestamp_list=y_timestamp_list,
    pred_len=pred_len,
    T=1.0,
    top_p=0.9,
    sample_count=1,
    verbose=True
)

# pred_df_list contains prediction results in the same order as input
for i, pred_df in enumerate(pred_df_list):
    print(f"Predictions for series {i}:")
    print(pred_df.head())
Important Requirements for Batch Prediction:
- All series must have the same historical length (lookback window)
- All series must have the same prediction length (
pred_len)
- Each DataFrame must contain the required columns:
['open', 'high', 'low', 'close']
volume and amount columns are optional and will be filled with zeros if missing
The predict_batch method leverages GPU parallelism for efficient processing and automatically handles normalization and denormalization for each series independently.
5. Example and Visualization
For a complete, runnable script that includes data loading, prediction, and plotting, please see examples/prediction_example.py.
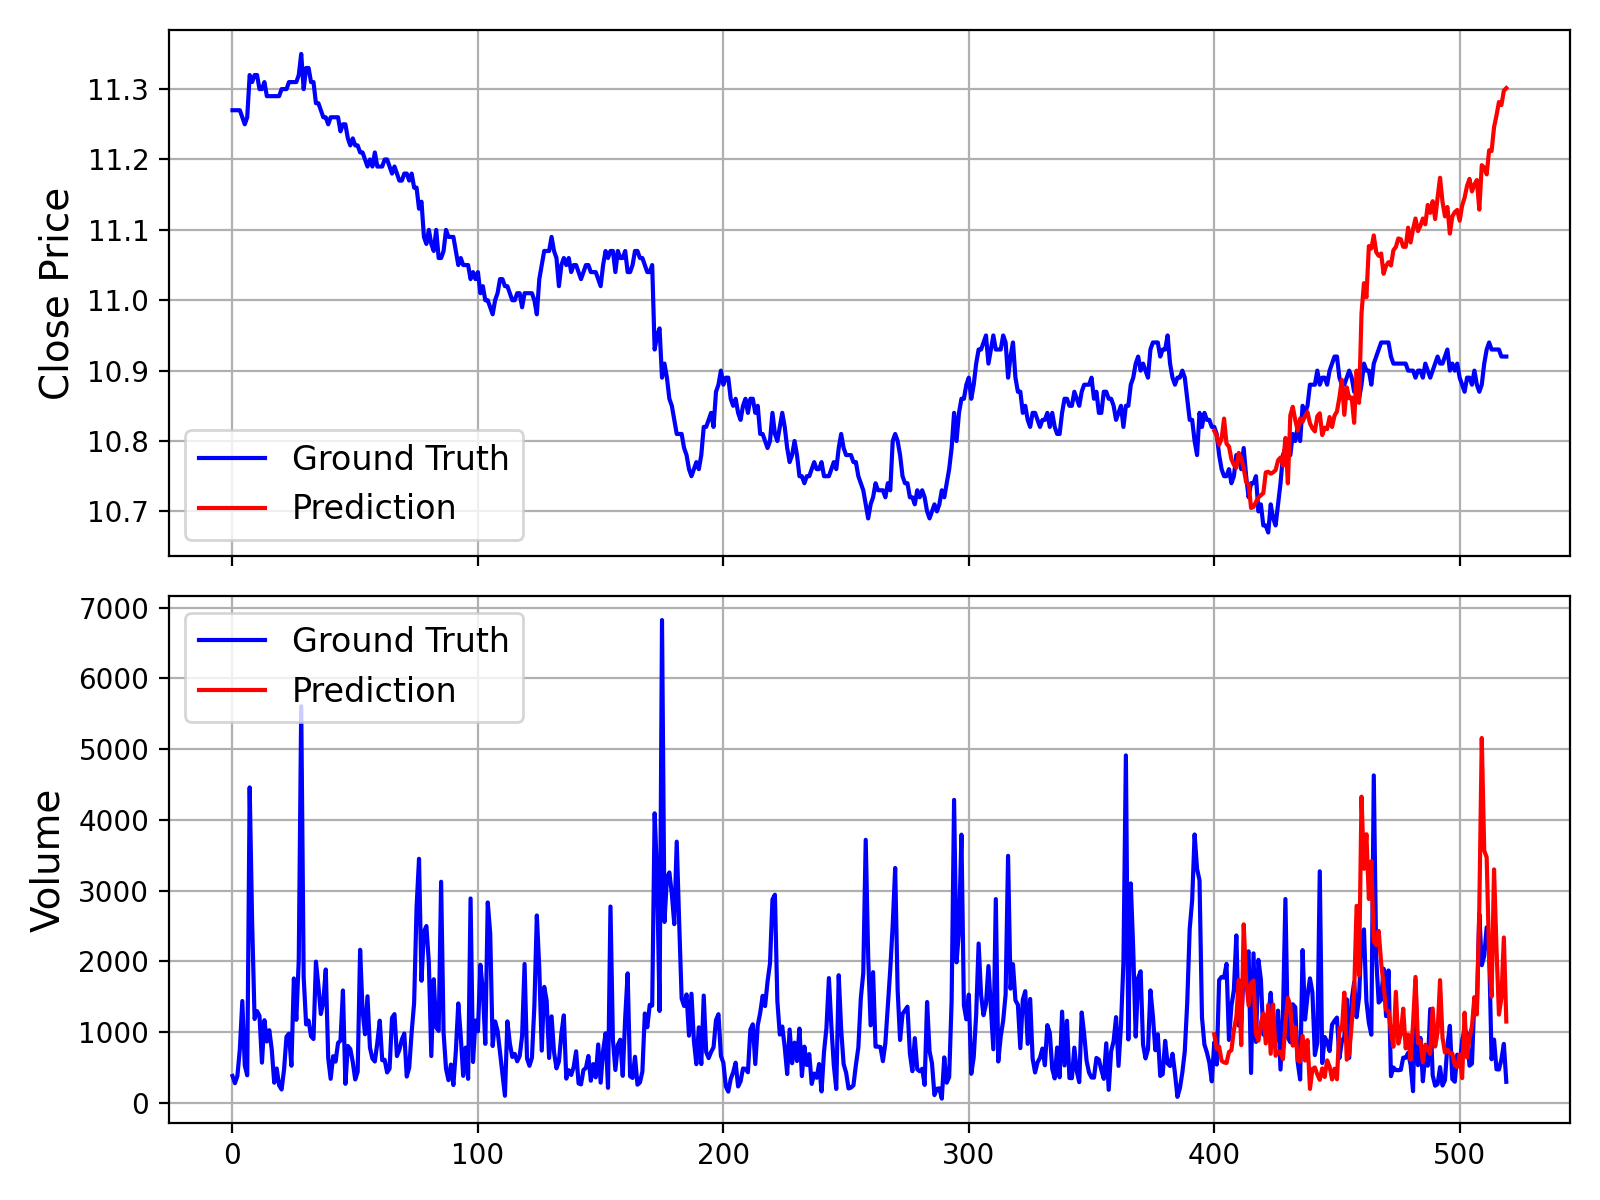
Running this script will generate a plot comparing the ground truth data against the model's forecast, similar to the one shown below:
Additionally, we provide a script that makes predictions without Volume and Amount data, which can be found in examples/prediction_wo_vol_example.py.
🔧 Finetuning on Your Own Data (A-Share Market Example)
We provide a complete pipeline for finetuning Kronos on your own datasets. As an example, we demonstrate how to use Qlib to prepare data from the Chinese A-share market and conduct a simple backtest.
Disclaimer: This pipeline is intended as a demonstration to illustrate the finetuning process. It is a simplified example and not a production-ready quantitative trading system. A robust quantitative strategy requires more sophisticated techniques, such as portfolio optimization and risk factor neutralization, to achieve stable alpha.
The finetuning process is divided into four main steps:
- Configuration: Set up paths and hyperparameters.
- Data Preparation: Process and split your data using Qlib.
- Model Finetuning: Finetune the Tokenizer and the Predictor models.
- Backtesting: Evaluate the finetuned model's performance.
Prerequisites
- First, ensure you have all dependencies from
requirements.txt installed.
- This pipeline relies on
qlib. Please install it: pip install pyqlib
- You will need to prepare your Qlib data. Follow the official Qlib guide to download and set up your data locally. The example scripts assume you are using daily frequency data.
All settings for data, training, and model paths are centralized in finetune/config.py. Before running any scripts, please modify the following paths according to your environment:
qlib_data_path: Path to your local Qlib data directory.dataset_path: Directory where the processed train/validation/test pickle files will be saved.save_path: Base directory for saving model checkpoints.backtest_result_path: Directory for saving backtesting results.pretrained_tokenizer_path and pretrained_predictor_path: Paths to the pre-trained models you want to start from (can be local paths or Hugging Face model names).
You can also adjust other parameters like instrument, train_time_range, epochs, and batch_size to fit your specific task. If you don't use Comet.ml, set use_comet = False.
Step 2: Prepare the Dataset
Run the data preprocessing script. This script will load raw market data from your Qlib directory, process it, split it into training, validation, and test sets, and save them as pickle files.
python finetune/qlib_data_preprocess.py
After running, you will find train_data.pkl, val_data.pkl, and test_data.pkl in the directory specified by dataset_path in your config.
Step 3: Run the Finetuning
The finetuning process consists of two stages: finetuning the tokenizer and then the predictor. Both training scripts are designed for multi-GPU training using torchrun.
3.1 Finetune the Tokenizer
This step adjusts the tokenizer to the data distribution of your specific domain.
# Replace NUM_GPUS with the number of GPUs you want to use (e.g., 2)
torchrun --standalone --nproc_per_node=NUM_GPUS finetune/train_tokenizer.py
The best tokenizer checkpoint will be saved to the path configured in config.py (derived from save_path and tokenizer_save_folder_name).
3.2 Finetune the Predictor
This step finetunes the main Kronos model for the forecasting task.
# Replace NUM_GPUS with the number of GPUs you want to use (e.g., 2)
torchrun --standalone --nproc_per_node=NUM_GPUS finetune/train_predictor.py
The best predictor checkpoint will be saved to the path configured in config.py.
Step 4: Evaluate with Backtesting
Finally, run the backtesting script to evaluate your finetuned model. This script loads the models, performs inference on the test set, generates prediction signals (e.g., forecasted price change), and runs a simple top-K strategy backtest.
# Specify the GPU for inference
python finetune/qlib_test.py --device cuda:0
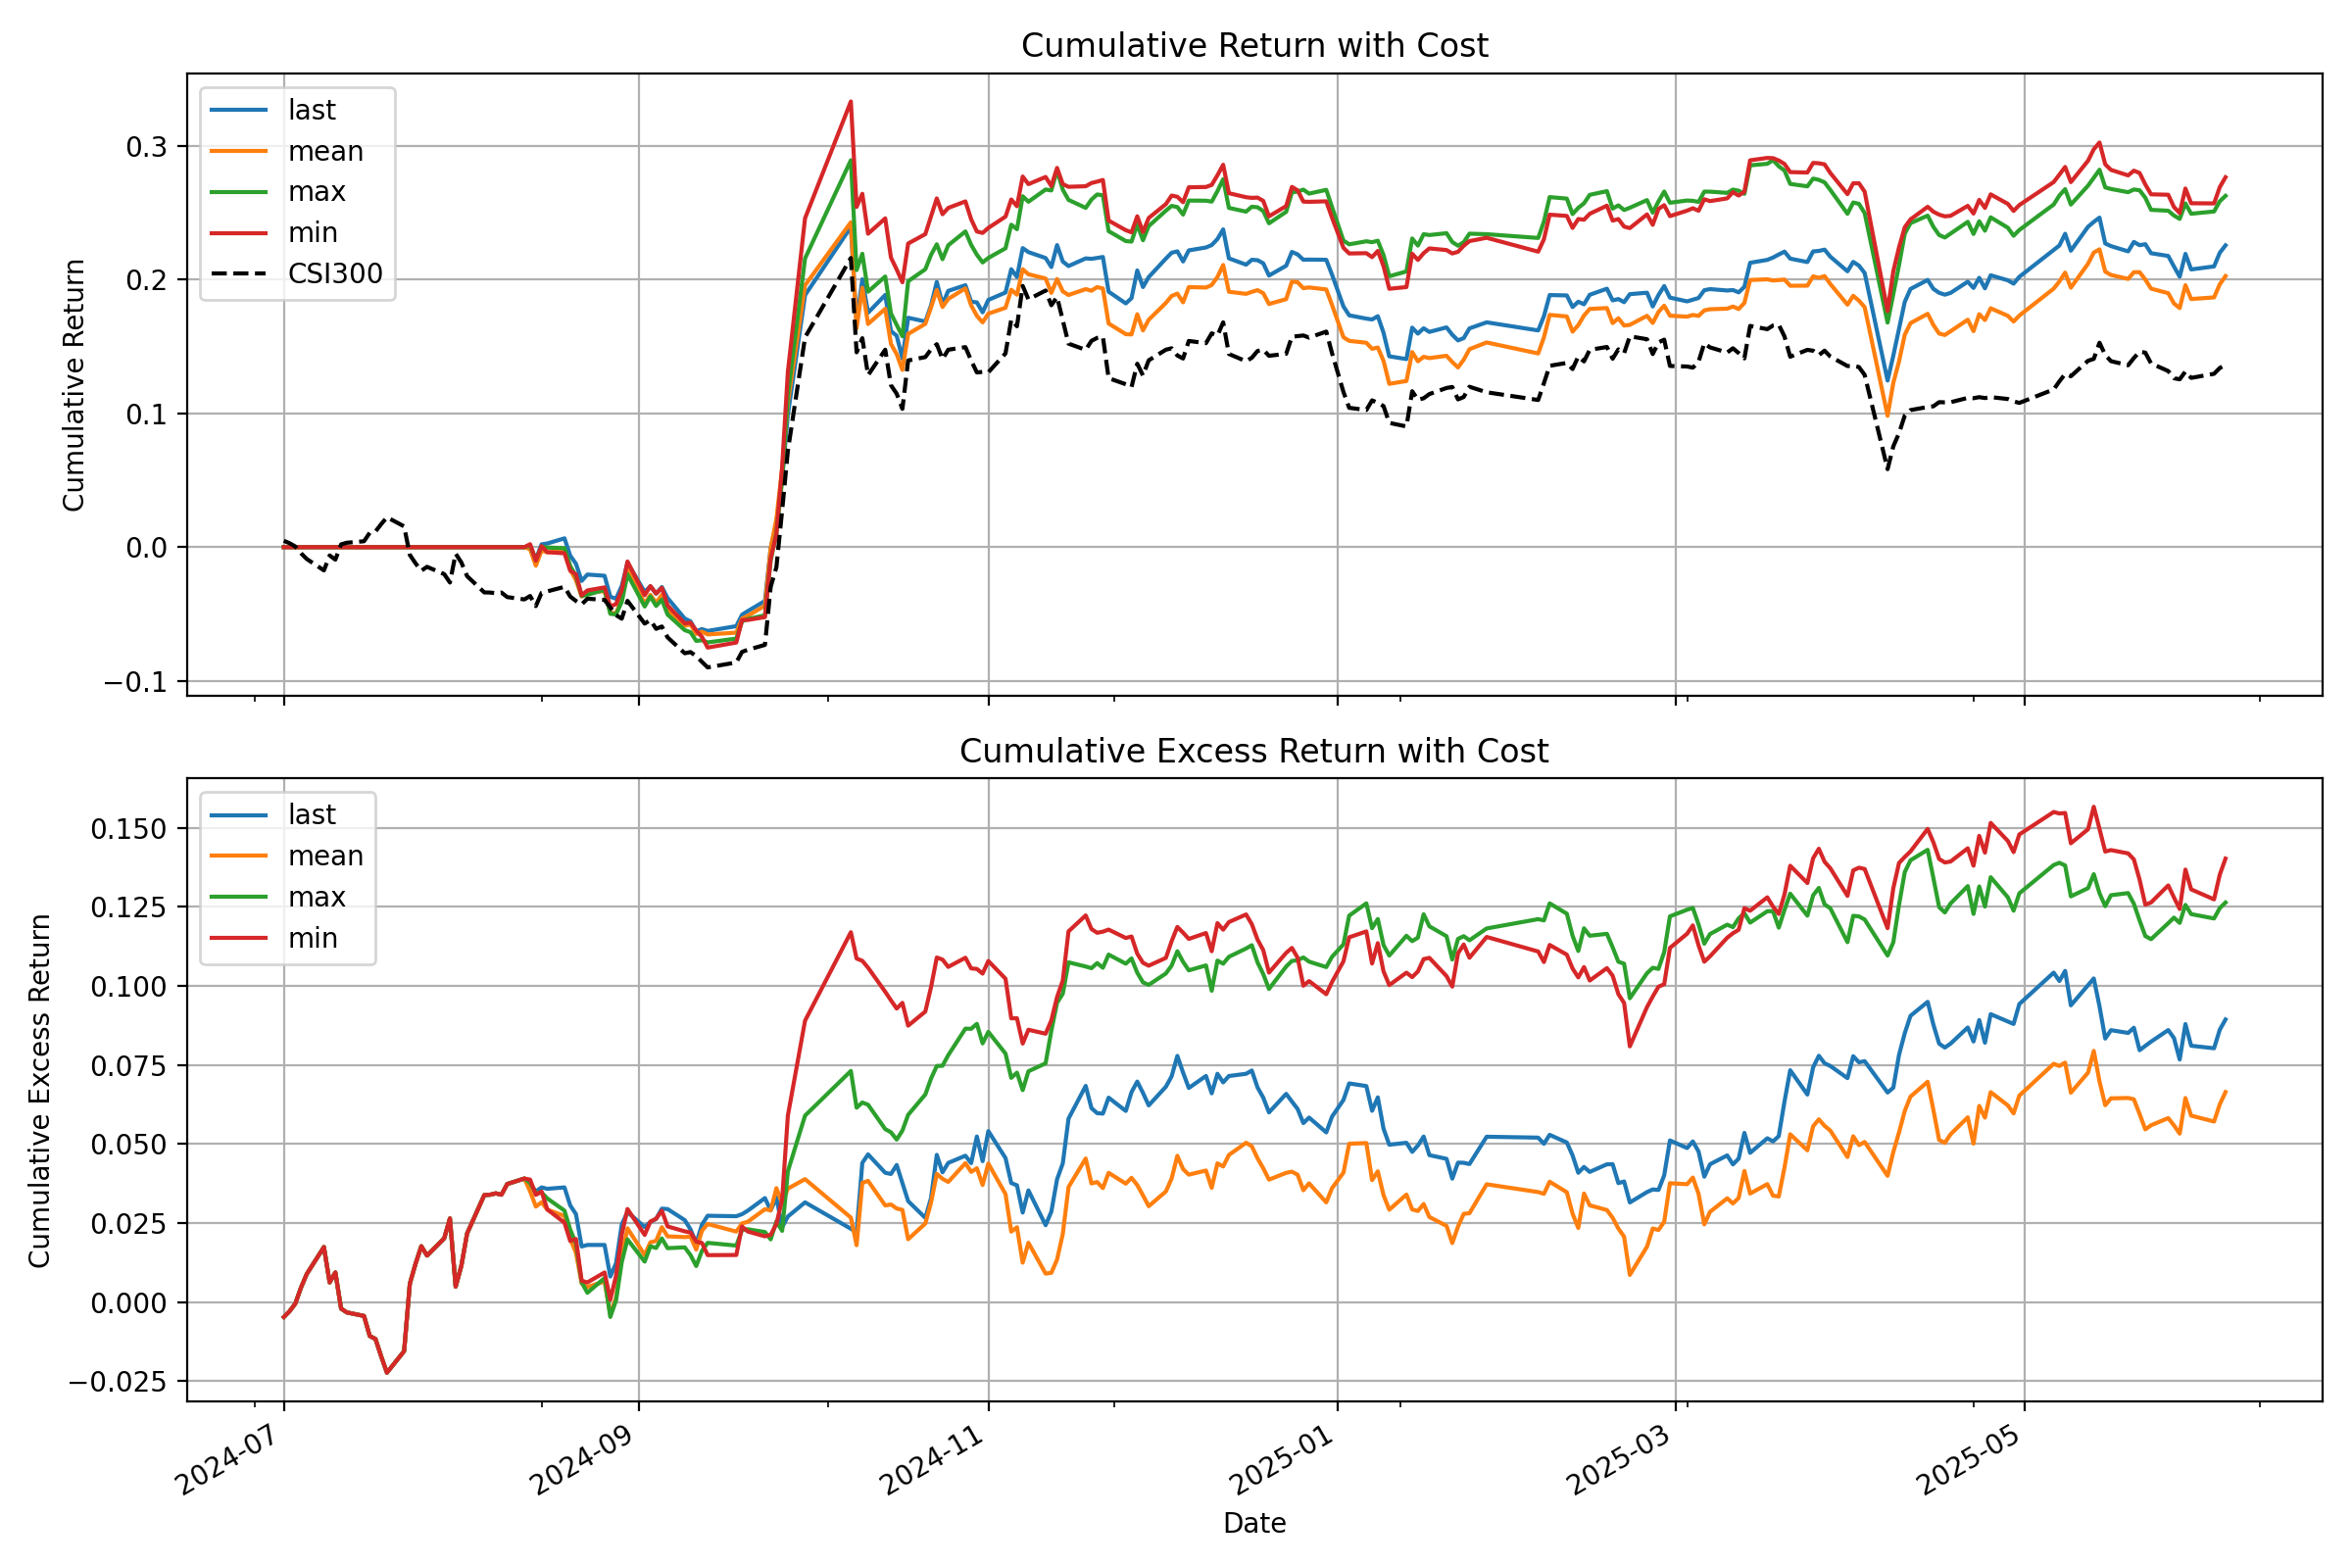
The script will output a detailed performance analysis in your console and generate a plot showing the cumulative return curves of your strategy against the benchmark, similar to the one below:
💡 From Demo to Production: Important Considerations
- Raw Signals vs. Pure Alpha: The signals generated by the model in this demo are raw predictions. In a real-world quantitative workflow, these signals would typically be fed into a portfolio optimization model. This model would apply constraints to neutralize exposure to common risk factors (e.g., market beta, style factors like size and value), thereby isolating the "pure alpha" and improving the strategy's robustness.
- Data Handling: The provided
QlibDataset is an example. For different data sources or formats, you will need to adapt the data loading and preprocessing logic.
- Strategy and Backtesting Complexity: The simple top-K strategy used here is a basic starting point. Production-level strategies often incorporate more complex logic for portfolio construction, dynamic position sizing, and risk management (e.g., stop-loss/take-profit rules). Furthermore, a high-fidelity backtest should meticulously model transaction costs, slippage, and market impact to provide a more accurate estimate of real-world performance.
📝 AI-Generated Comments: Please note that many of the code comments within the finetune/ directory were generated by an AI assistant (Gemini 2.5 Pro) for explanatory purposes. While they aim to be helpful, they may contain inaccuracies. We recommend treating the code itself as the definitive source of logic.
📖 Citation
If you use Kronos in your research, we would appreciate a citation to our paper:
@misc{shi2025kronos,
      title={Kronos: A Foundation Model for the Language of Financial Markets},
      author={Yu Shi and Zongliang Fu and Shuo Chen and Bohan Zhao and Wei Xu and Changshui Zhang and Jian Li},
      year={2025},
      eprint={2508.02739},
      archivePrefix={arXiv},
      primaryClass={q-fin.ST},
      url={https://arxiv.org/abs/2508.02739},
}
📜 License
This project is licensed under the MIT License.





 Kronos 是一个面向金融 K 线(K-line)数据的开源基础模型,在来自全球 45 家以上交易所的数据上完成预训练,用于生成价格和成交量预测。