

这是什么?
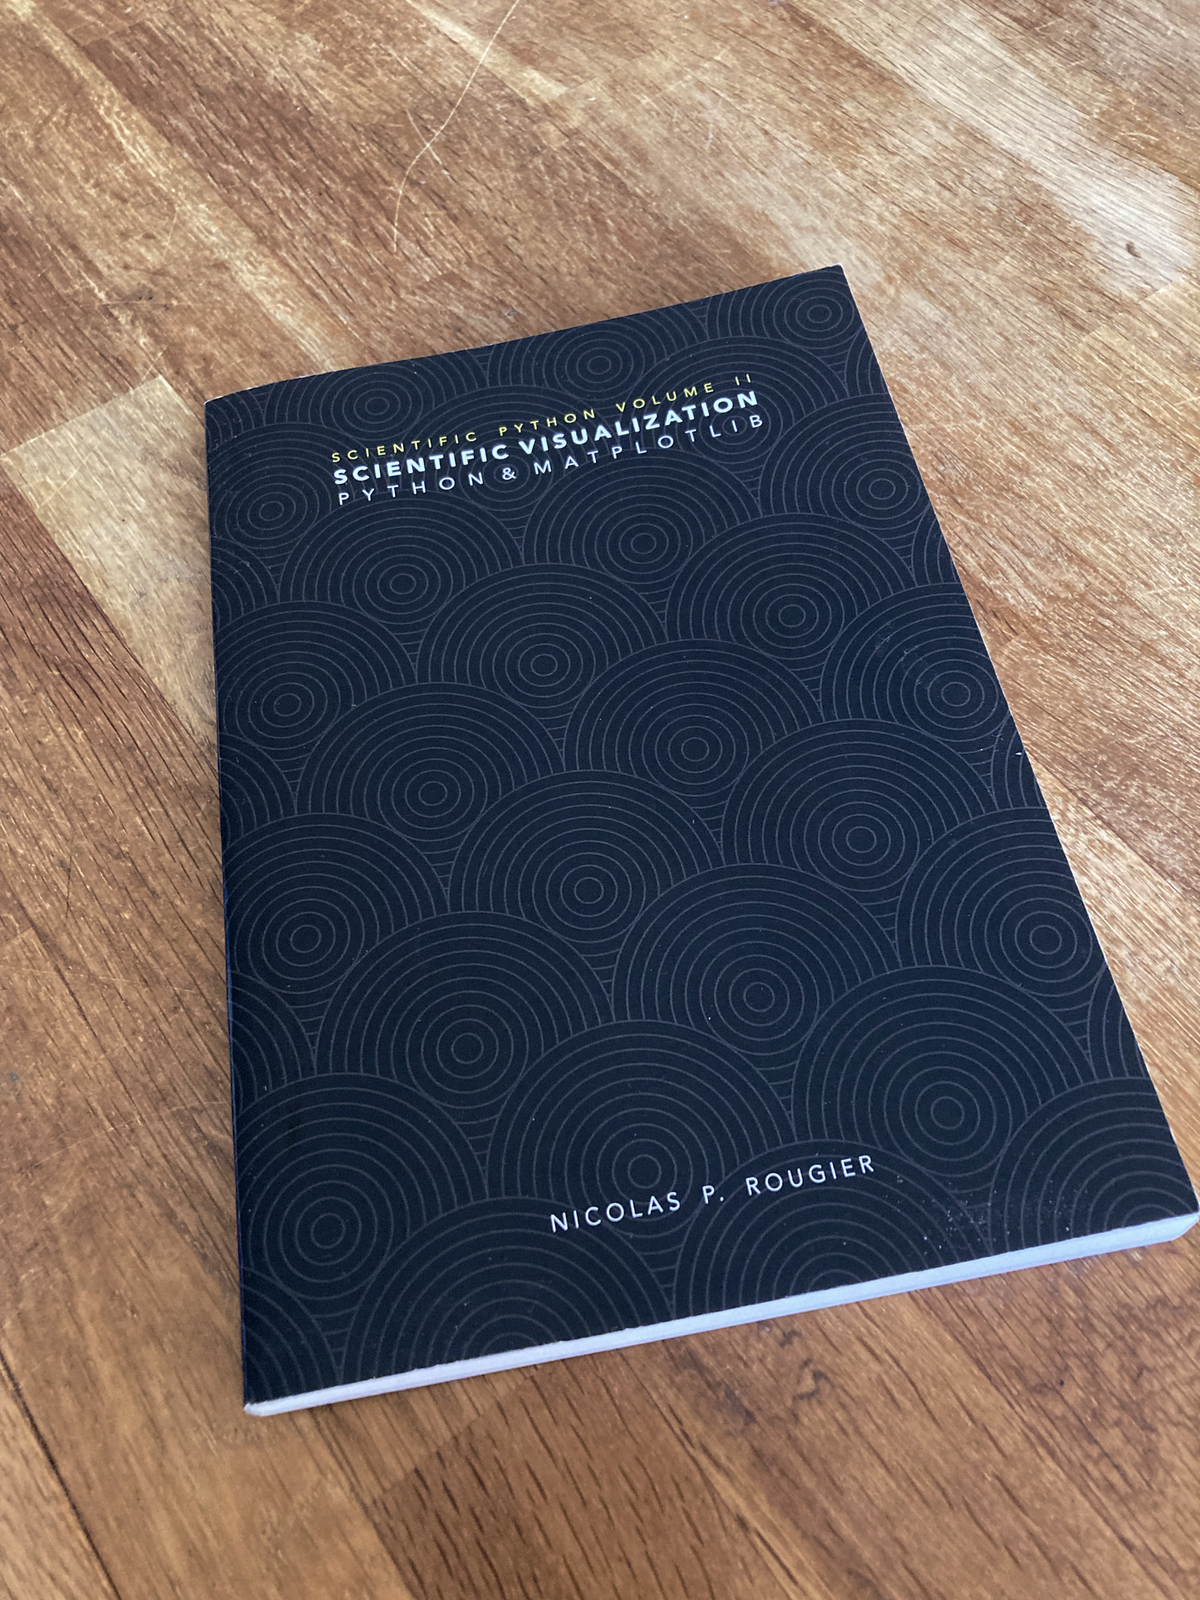
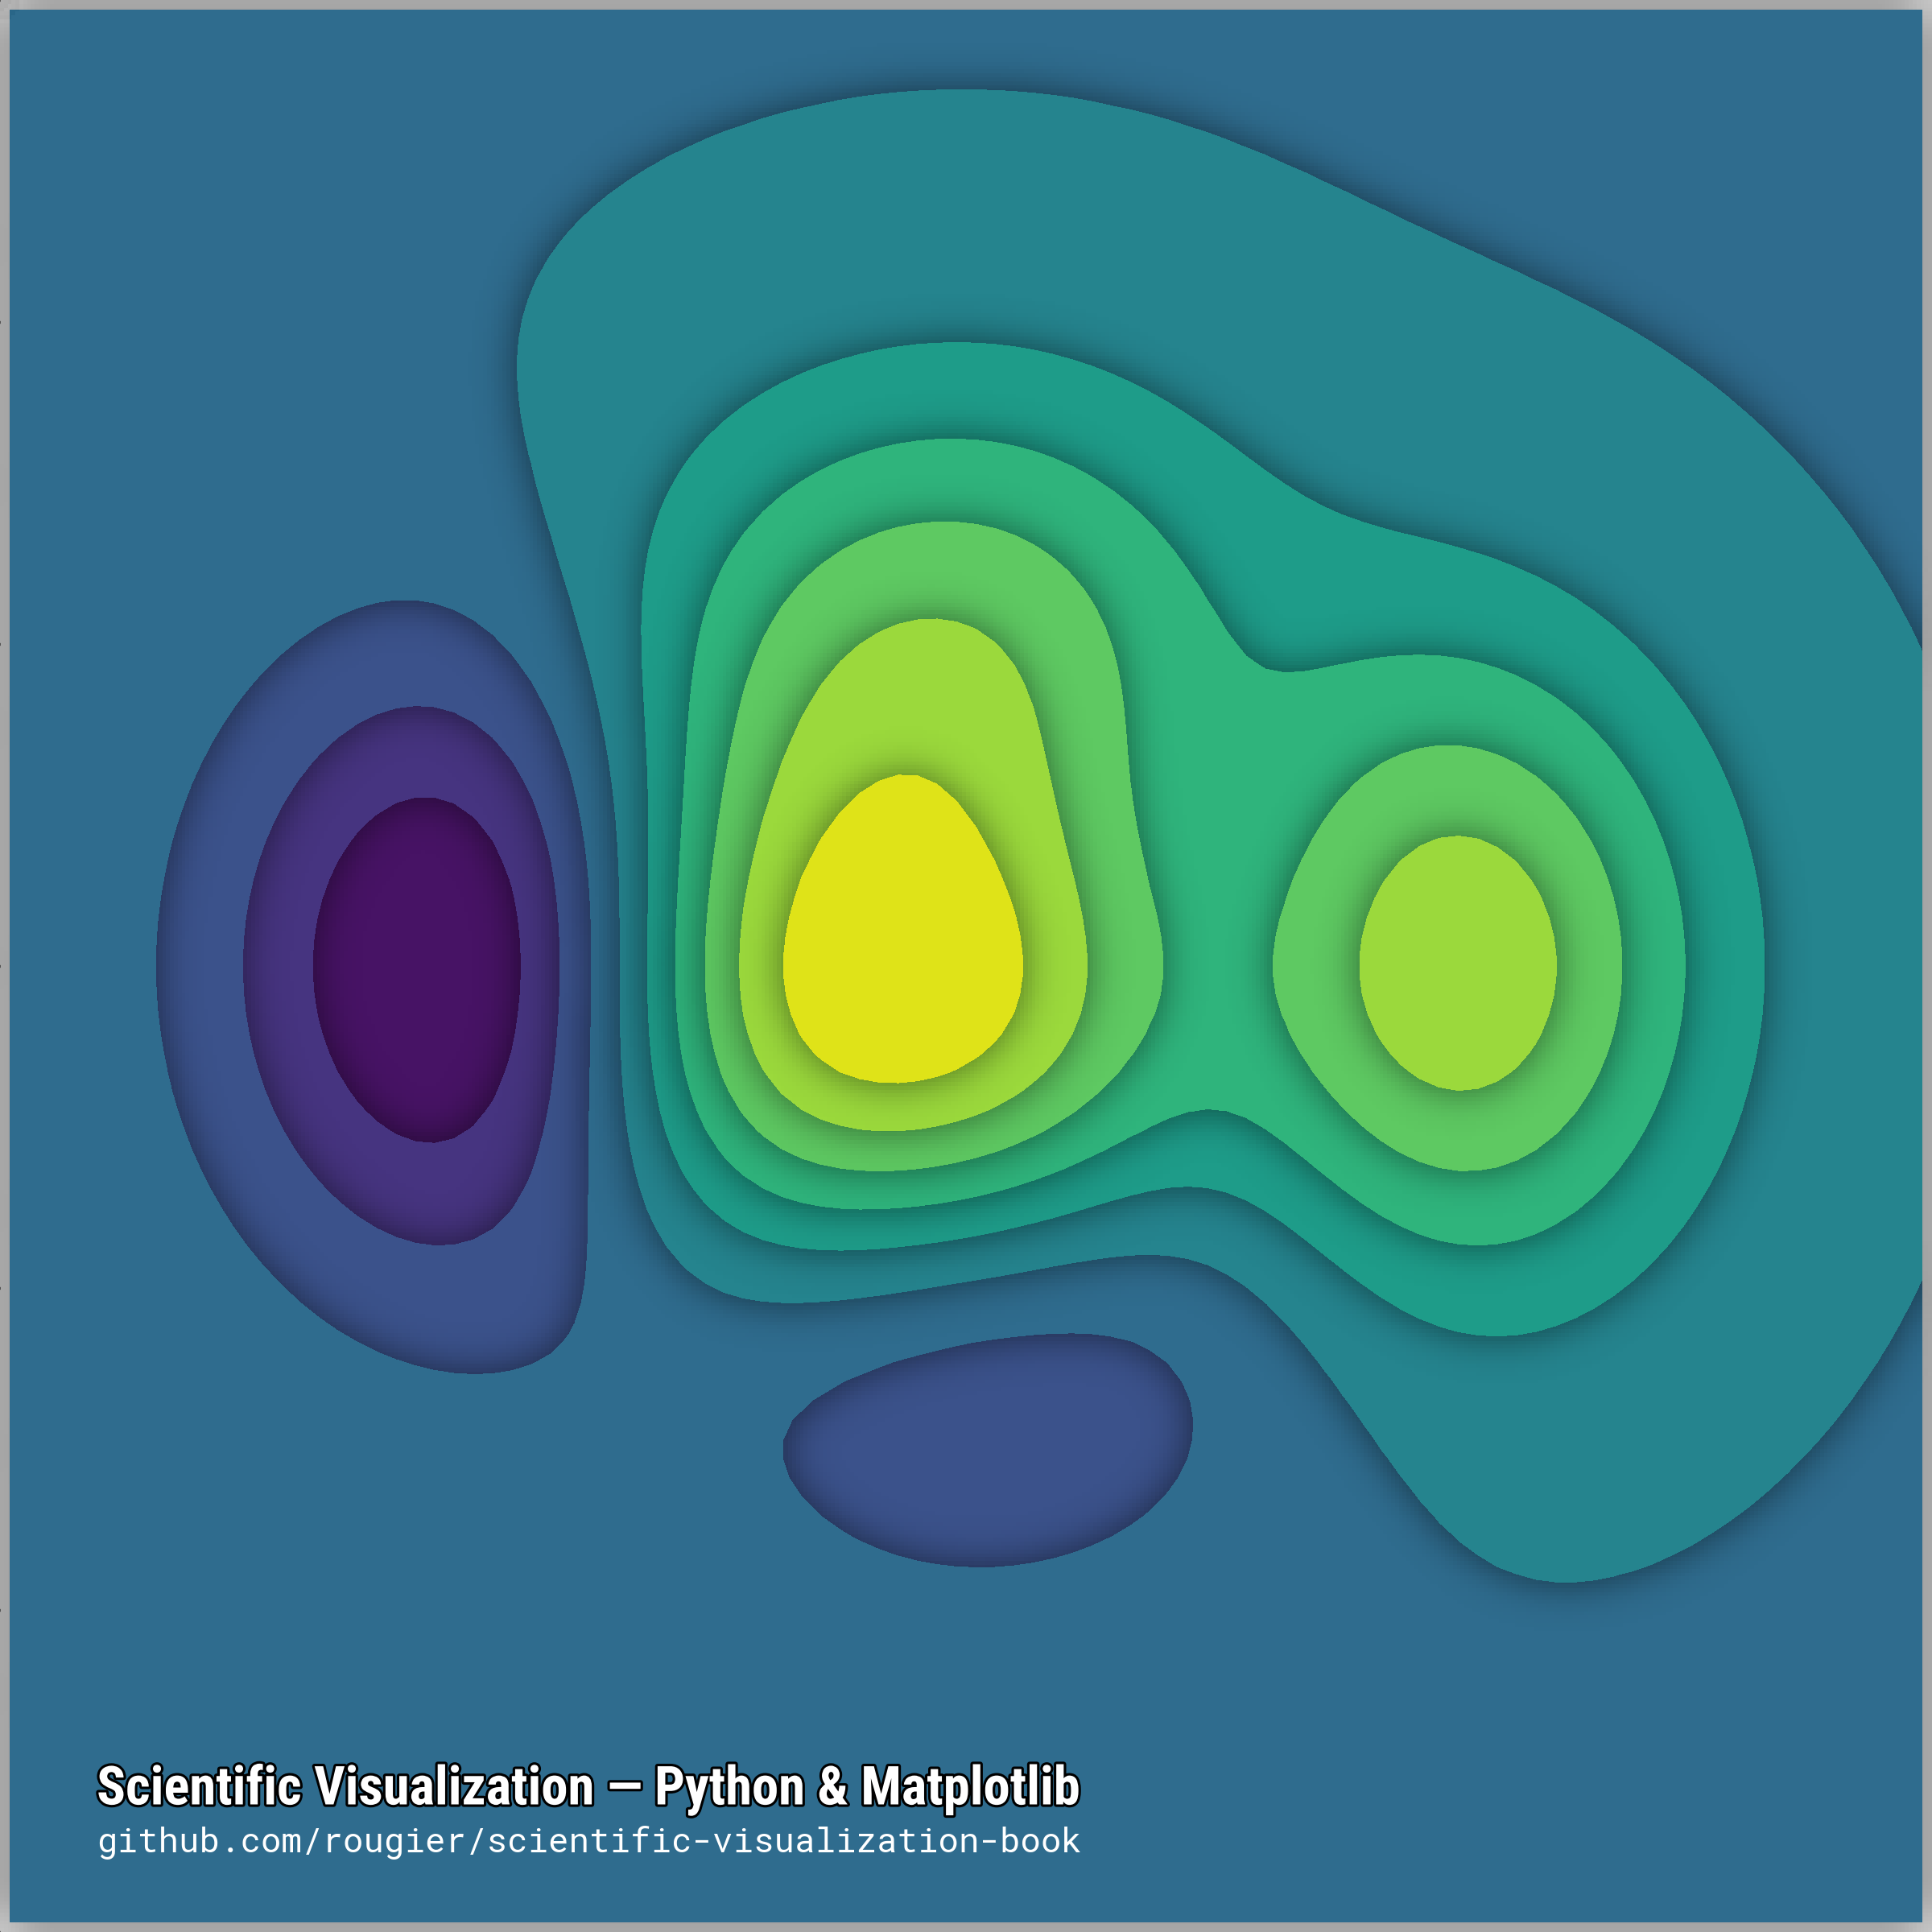
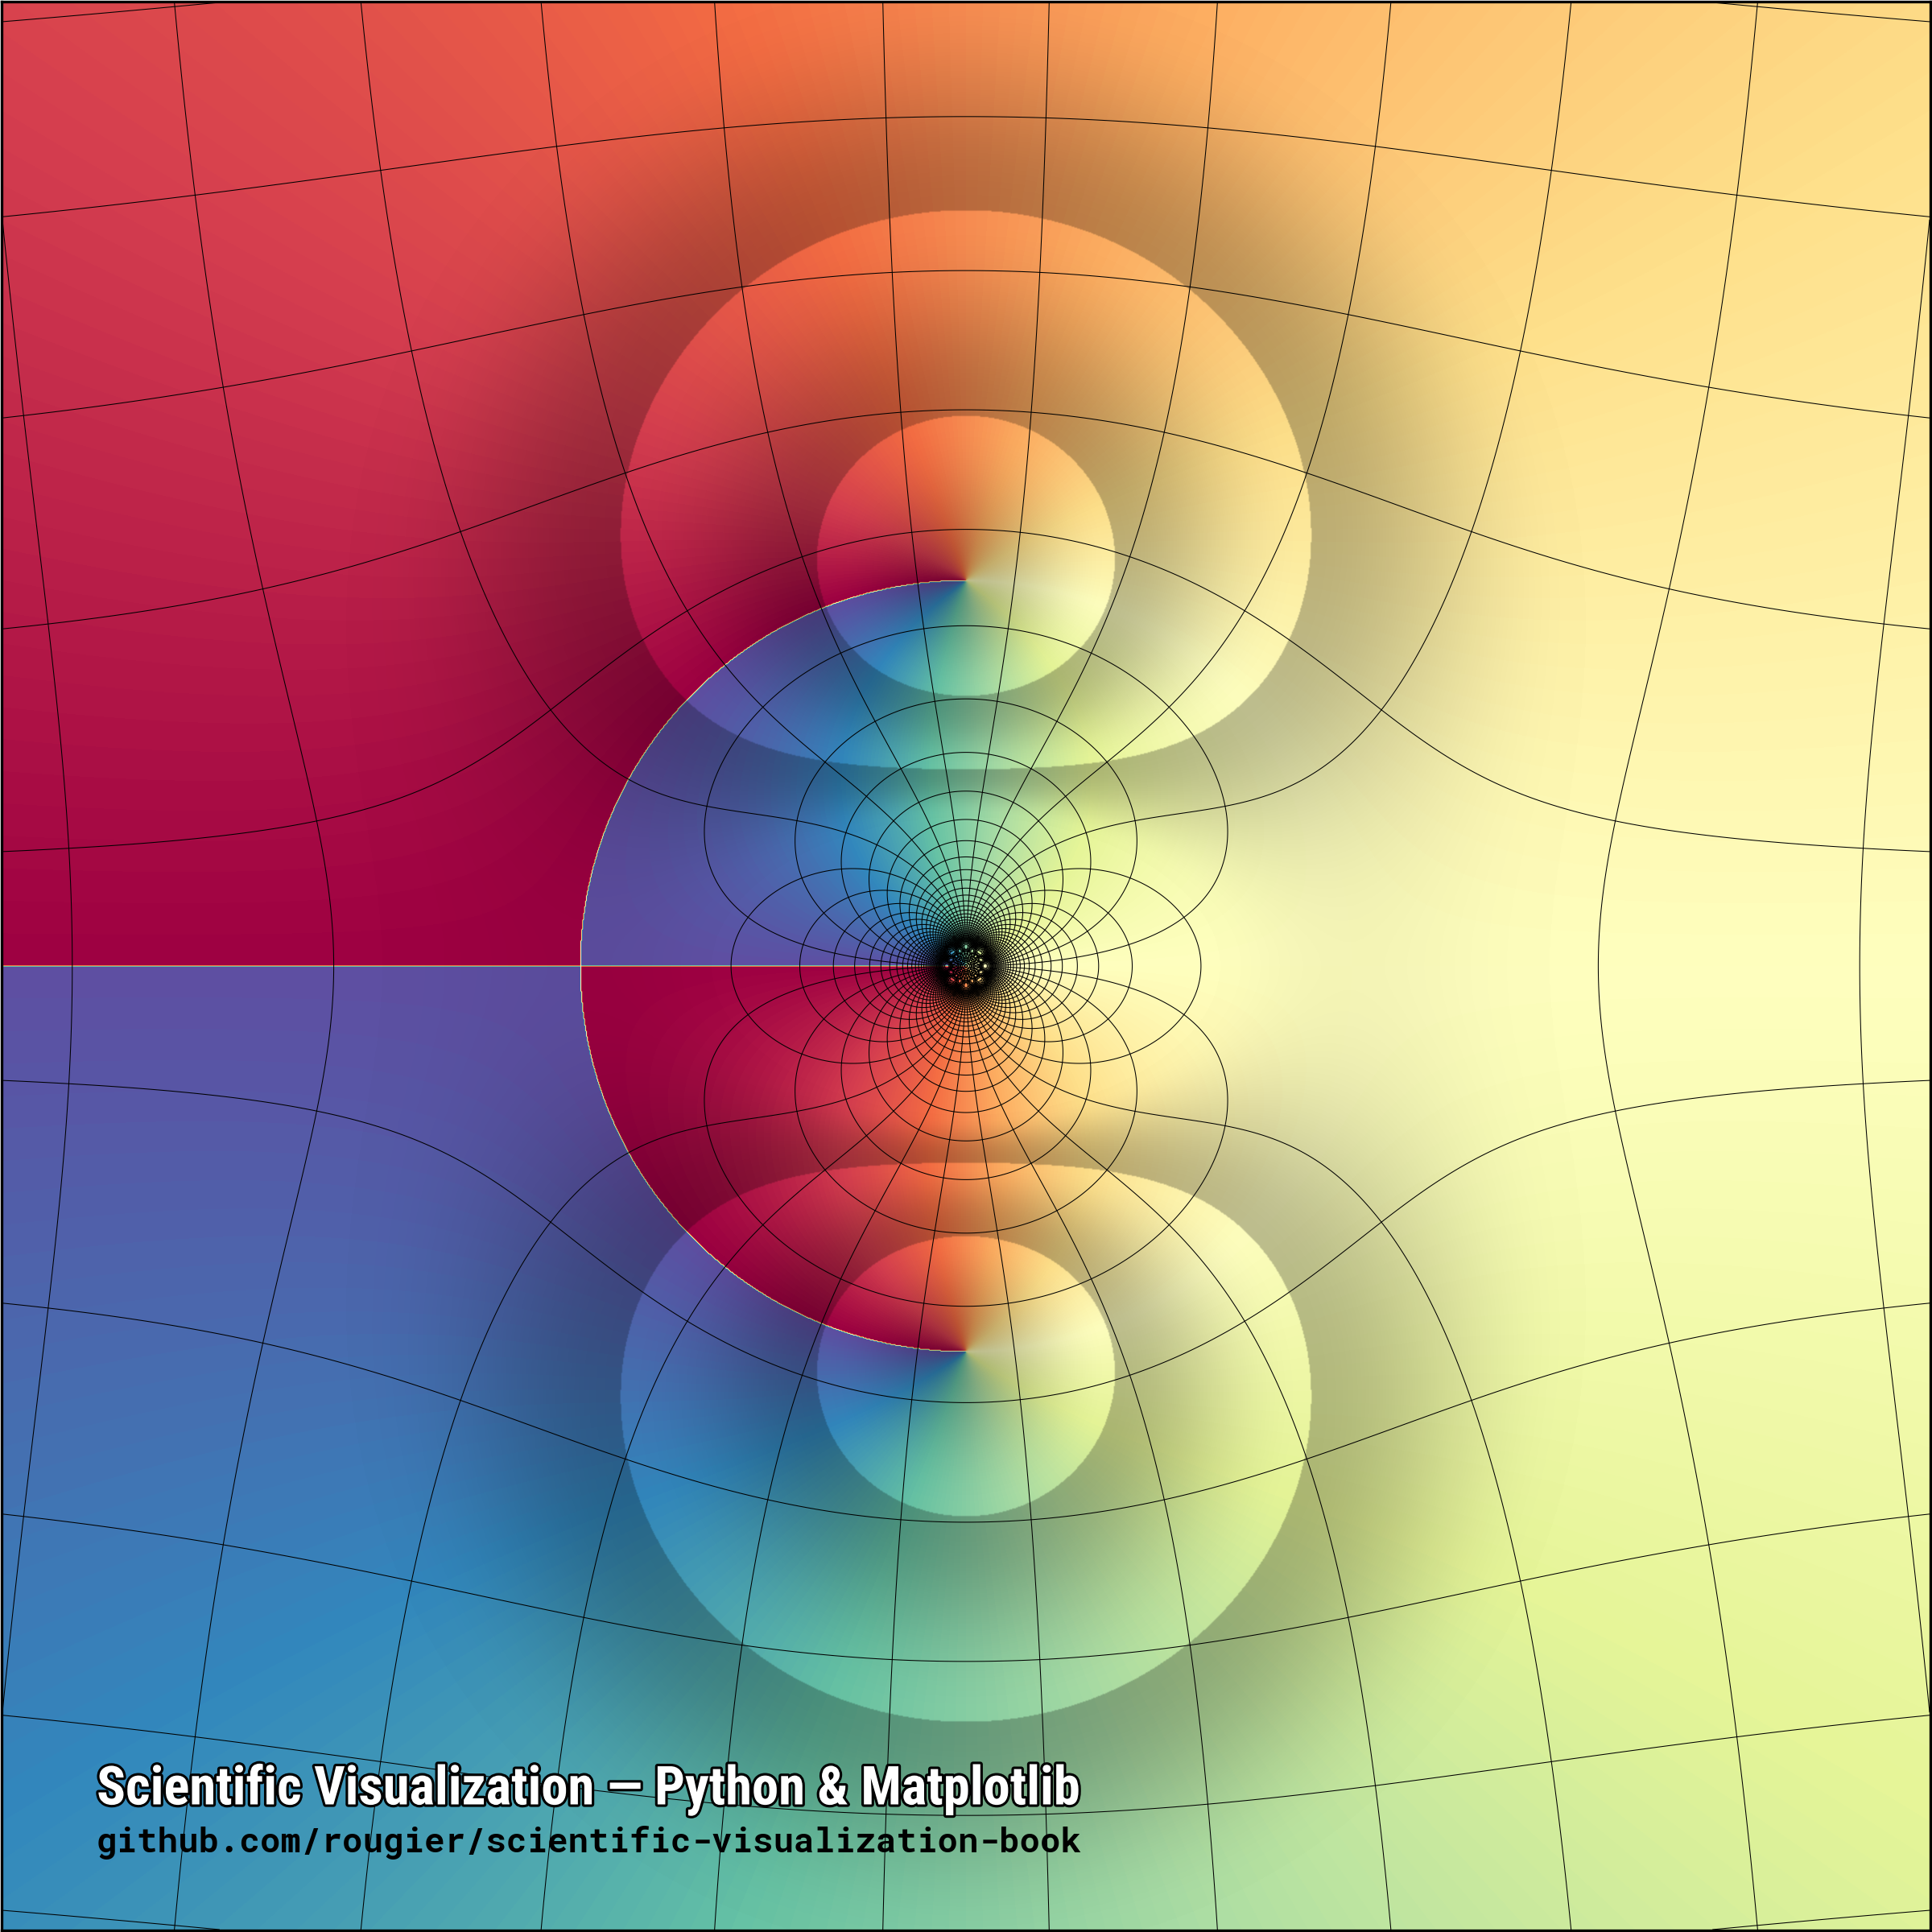
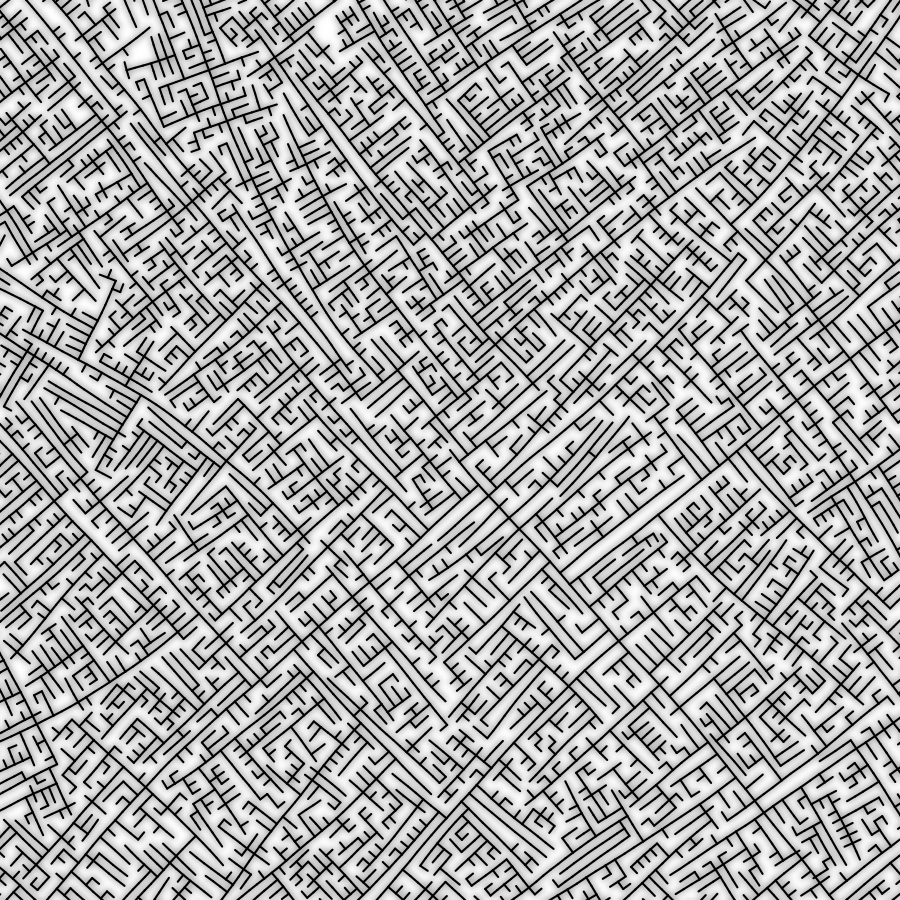
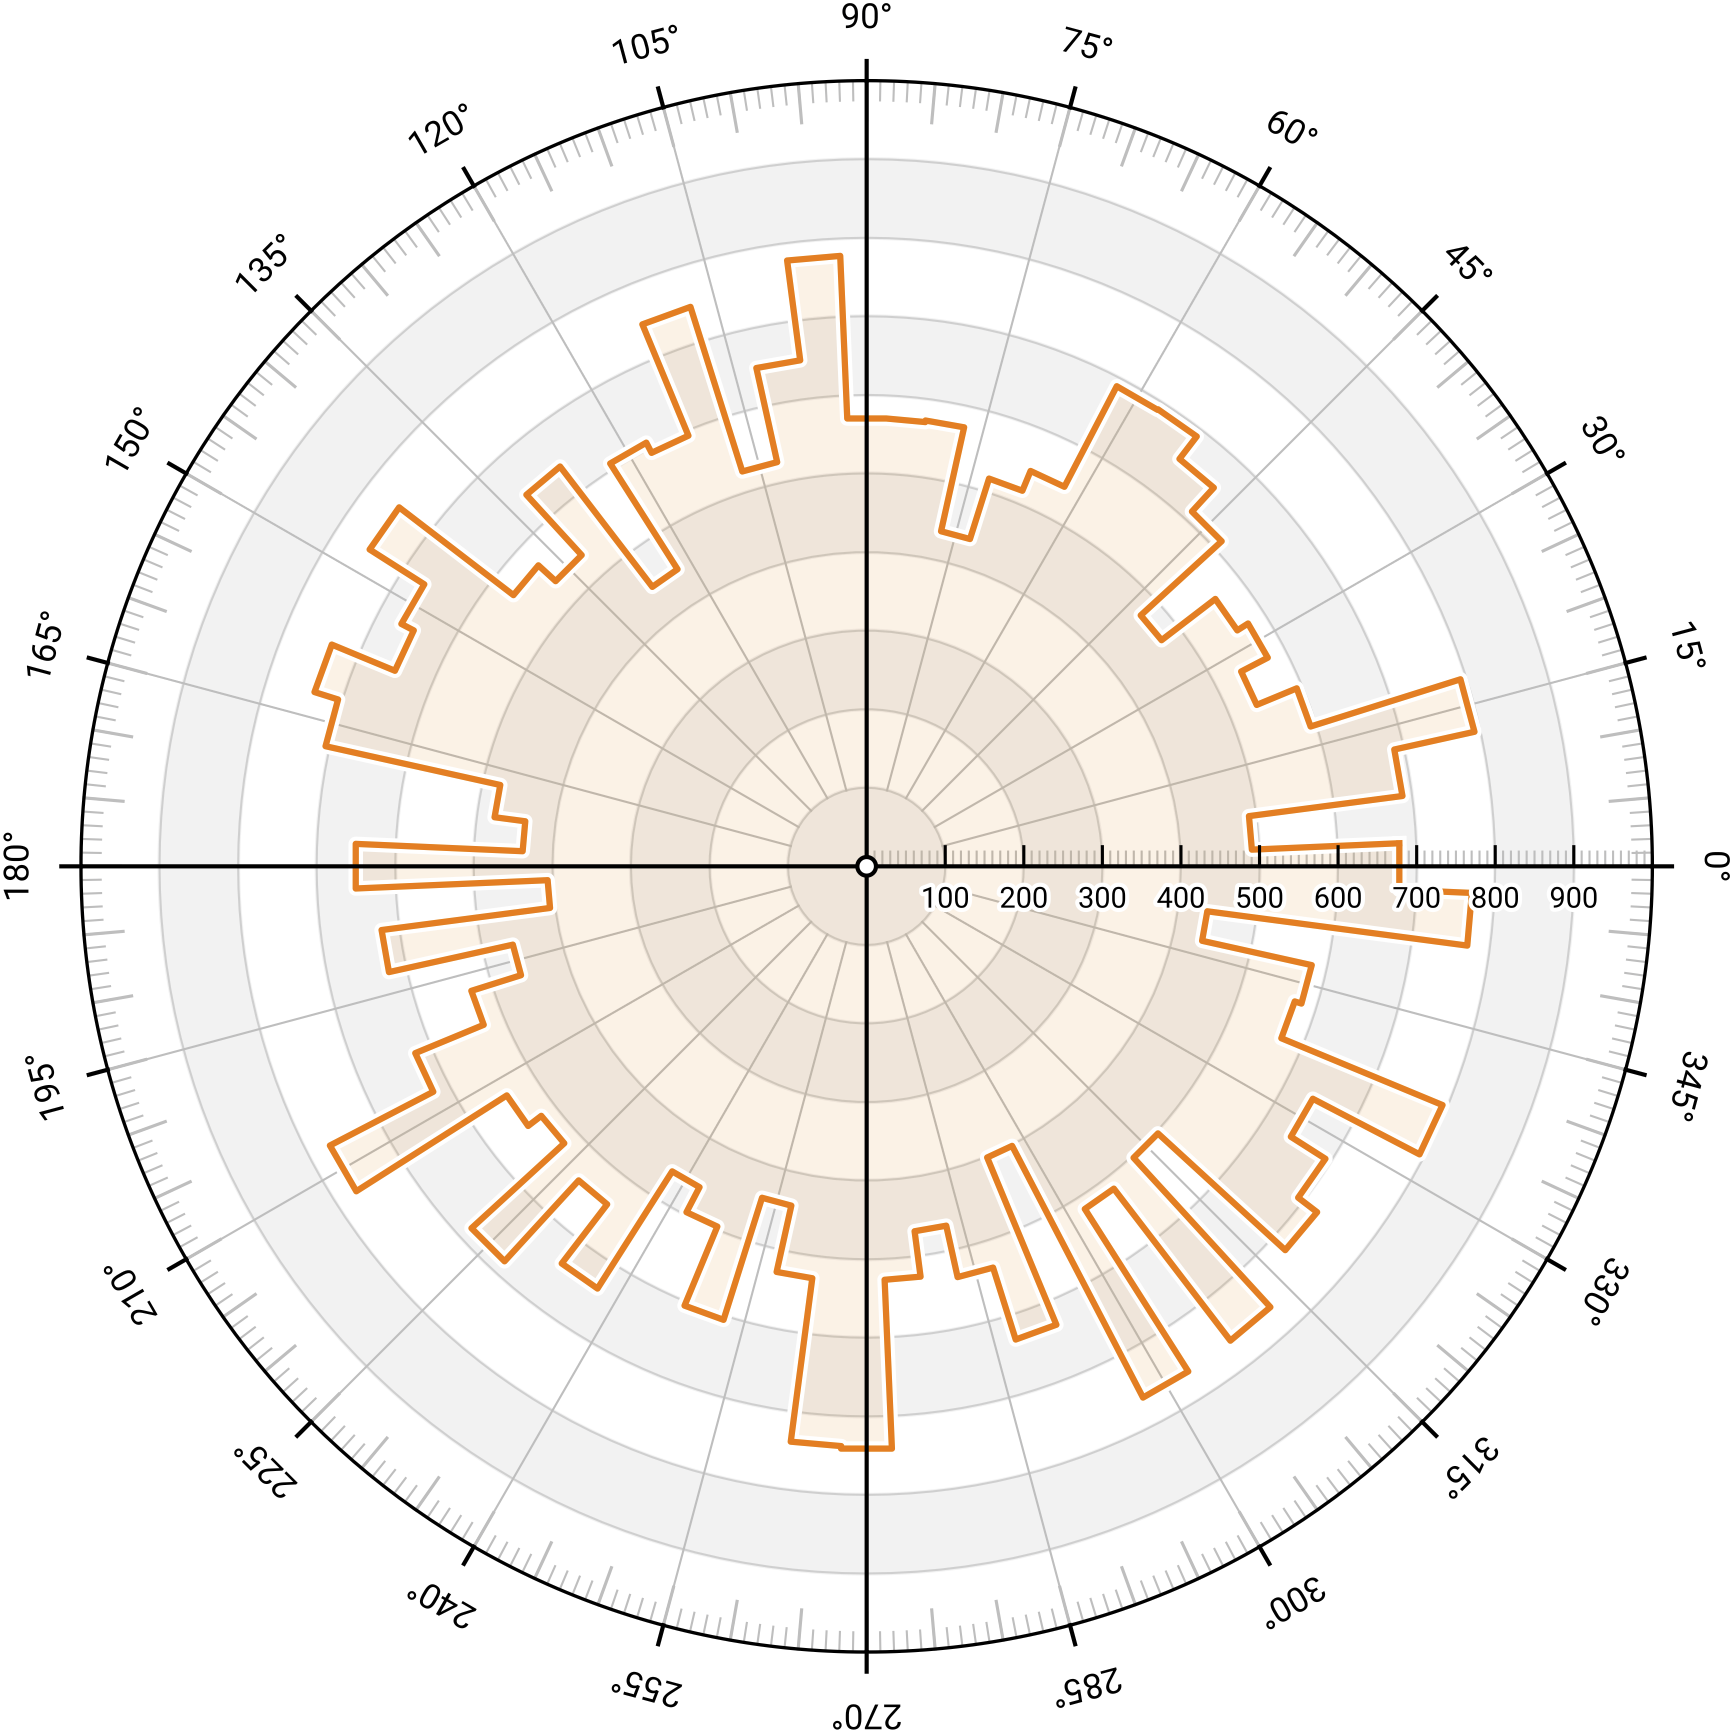
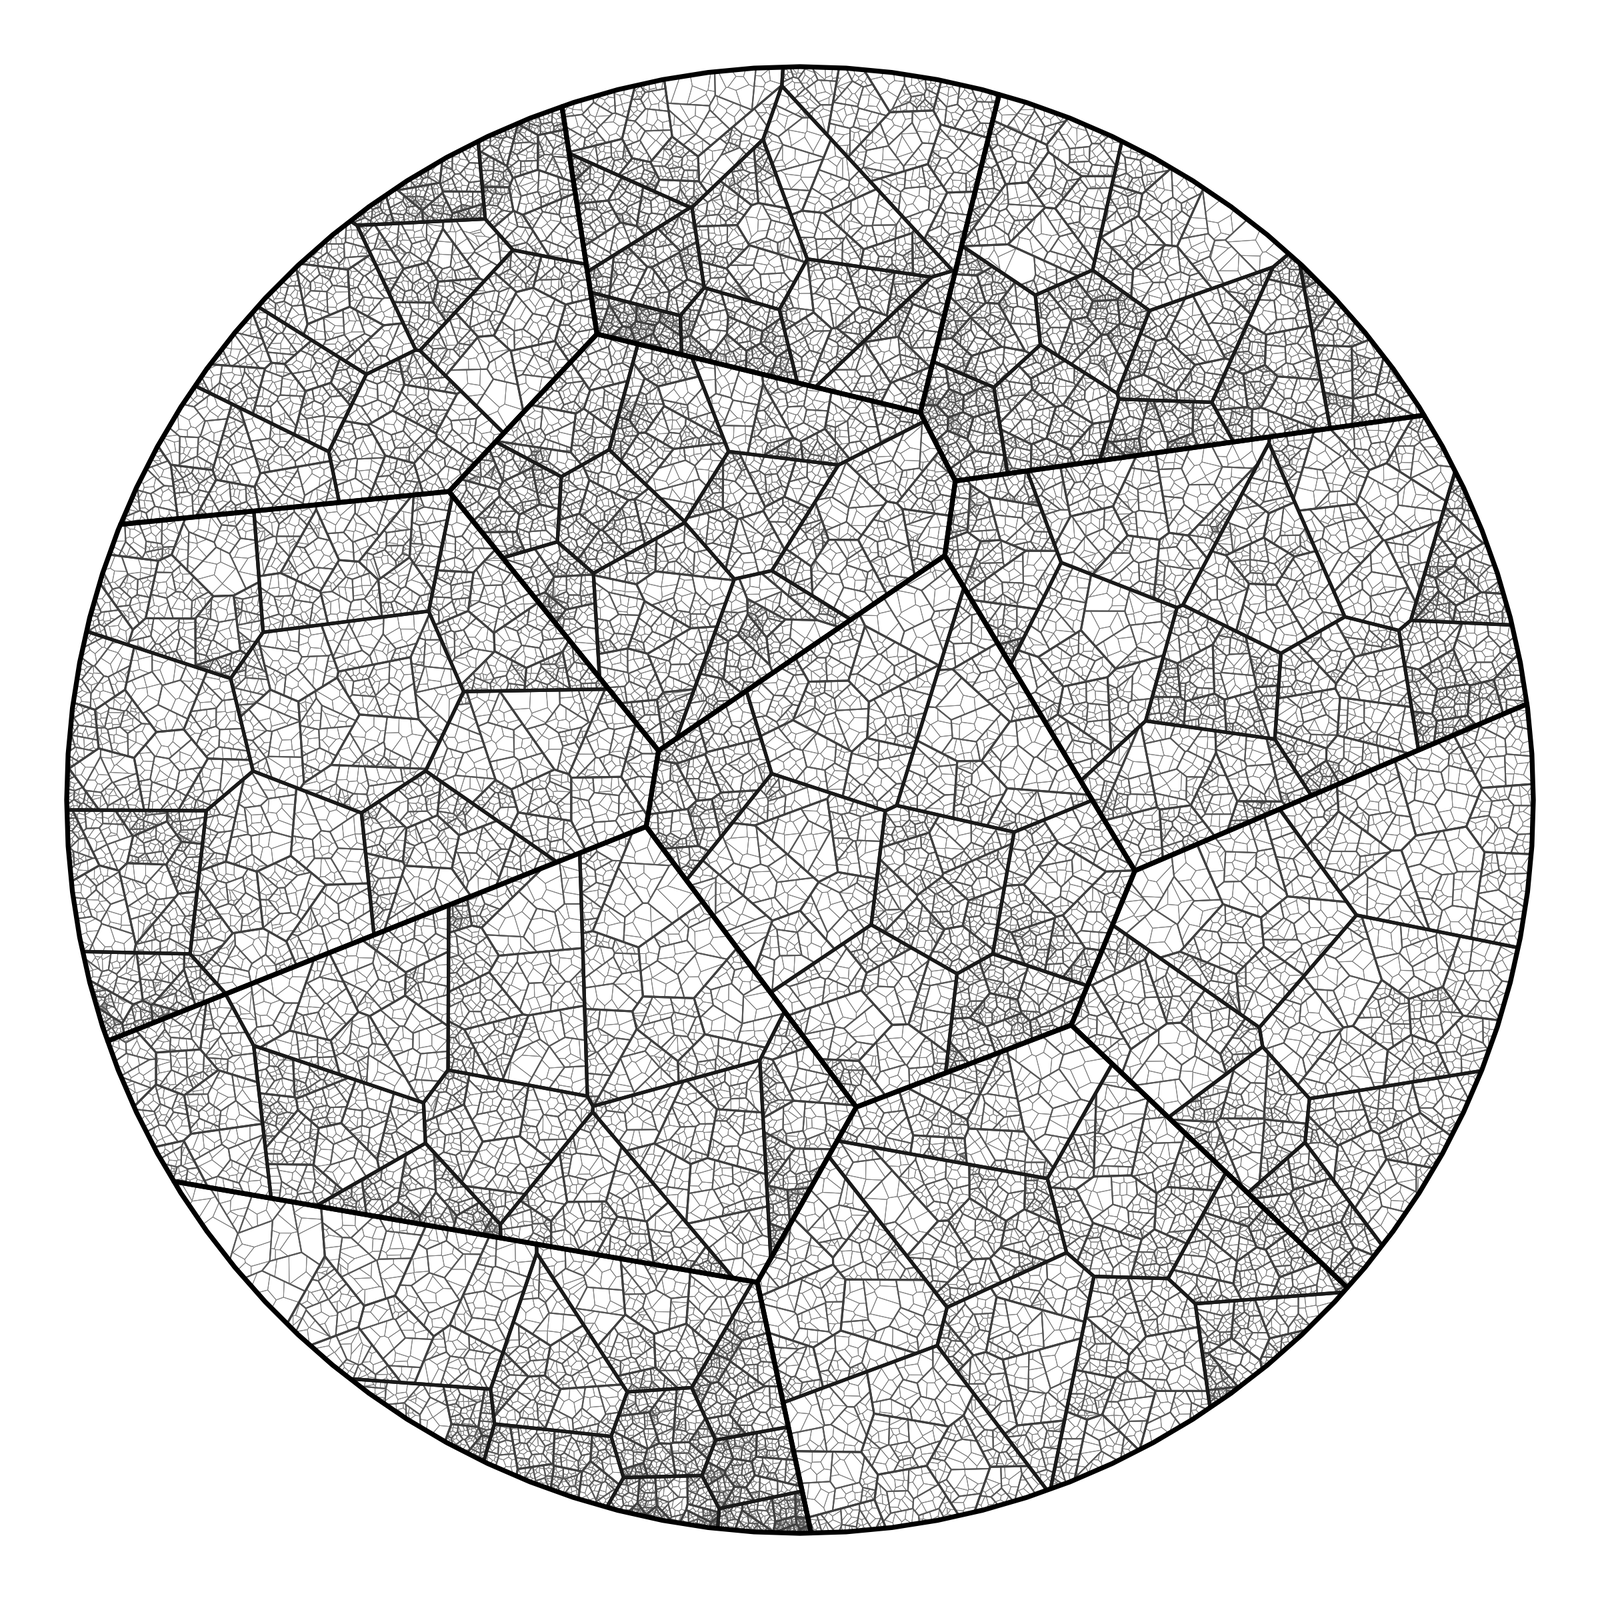
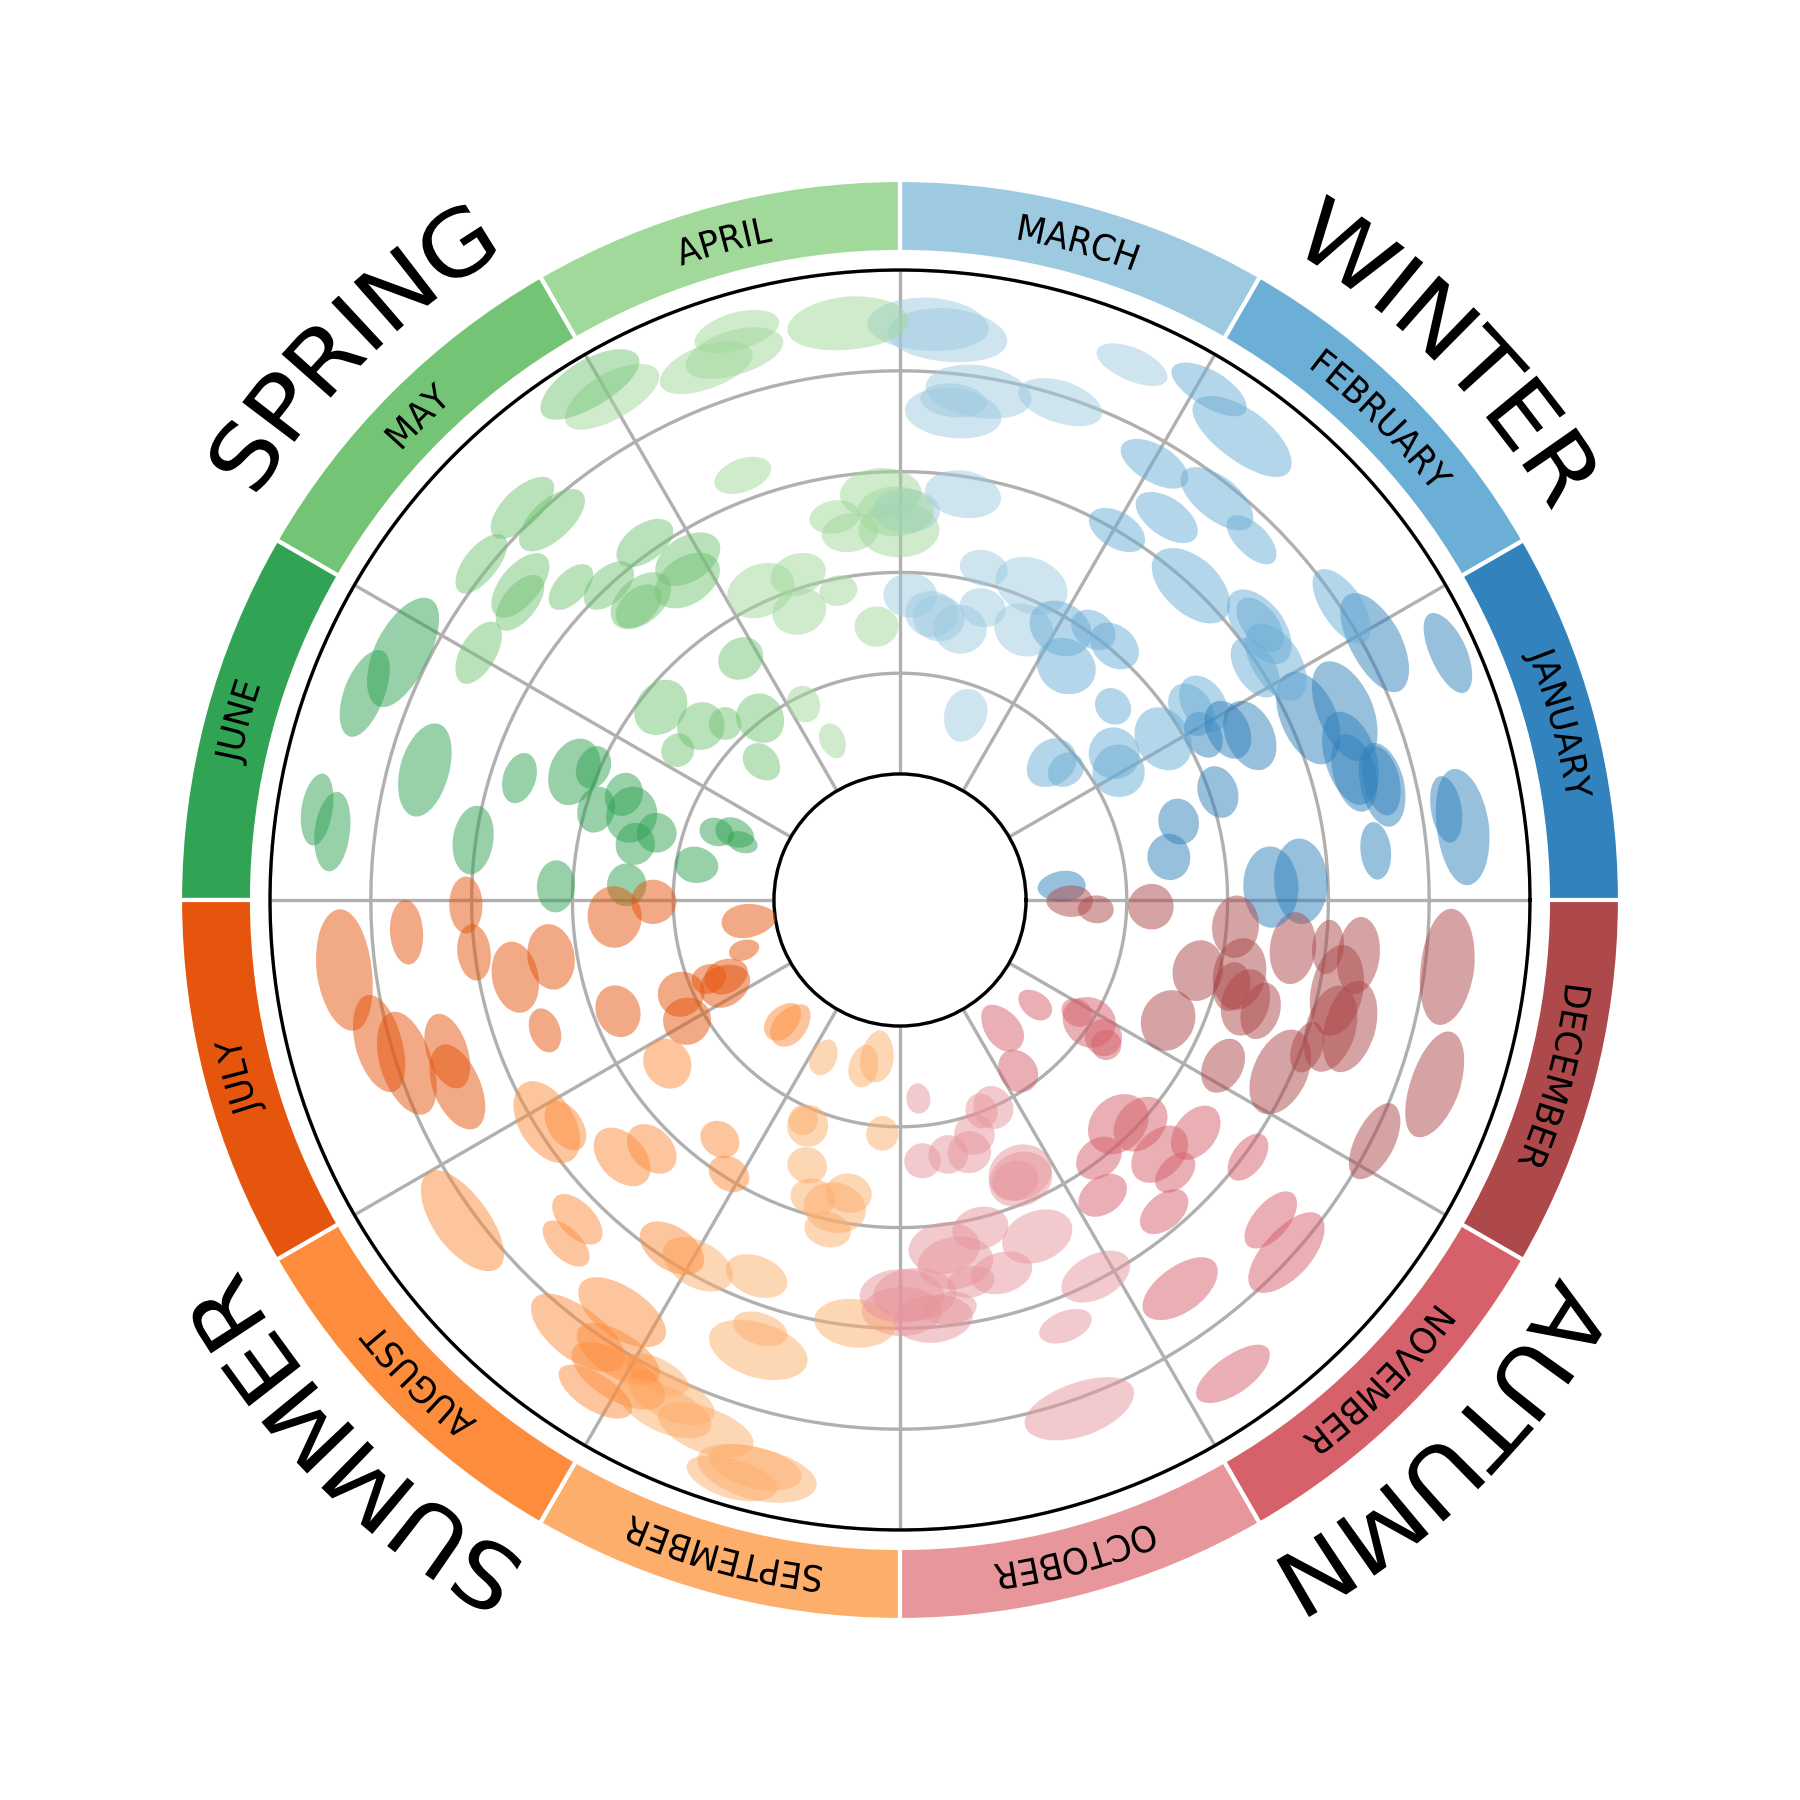
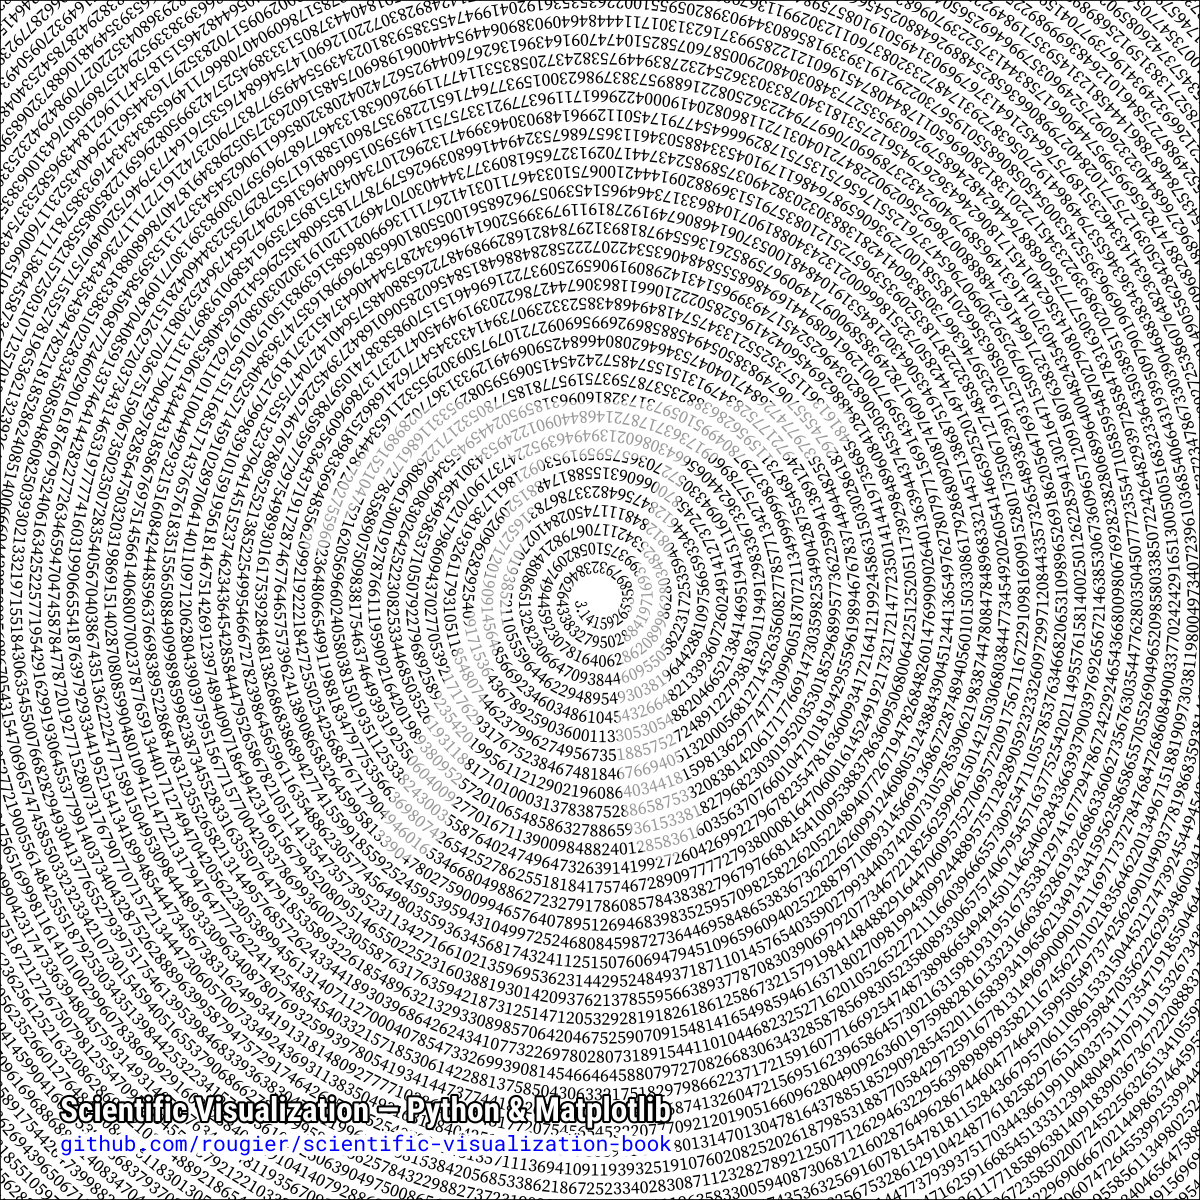
 这是一本开放获取的图书,使用 Matplotlib 讲授 Python 科学可视化,内容涵盖从核心原理到三维图形、动画以及作品展示画廊的全部内容。
这是一本书还是一个代码库?这是一本书(附带配套源代码和图形示例),而不是可以导入到自己项目中的代码库。
这是一本书(附带配套源代码和图形示例),而不是可以导入到自己项目中的代码库。我该怎么阅读?可以阅读托管在 HAL(开放获取文献库)上的免费 PDF,或从 GitHub 仓库获取最新版本;也可以在亚马逊上以 49 美元购买纸质版。
可以阅读托管在 HAL(开放获取文献库)上的免费 PDF,或从 GitHub 仓库获取最新版本;也可以在亚马逊上以 49 美元购买纸质版。除了 Python 和 Matplotlib,我还需要其他东西才能跟着学吗?本书围绕标准的 Python 科学计算生态构建:Python、Matplotlib 和 NumPy 是贯穿全书示例的核心工具。
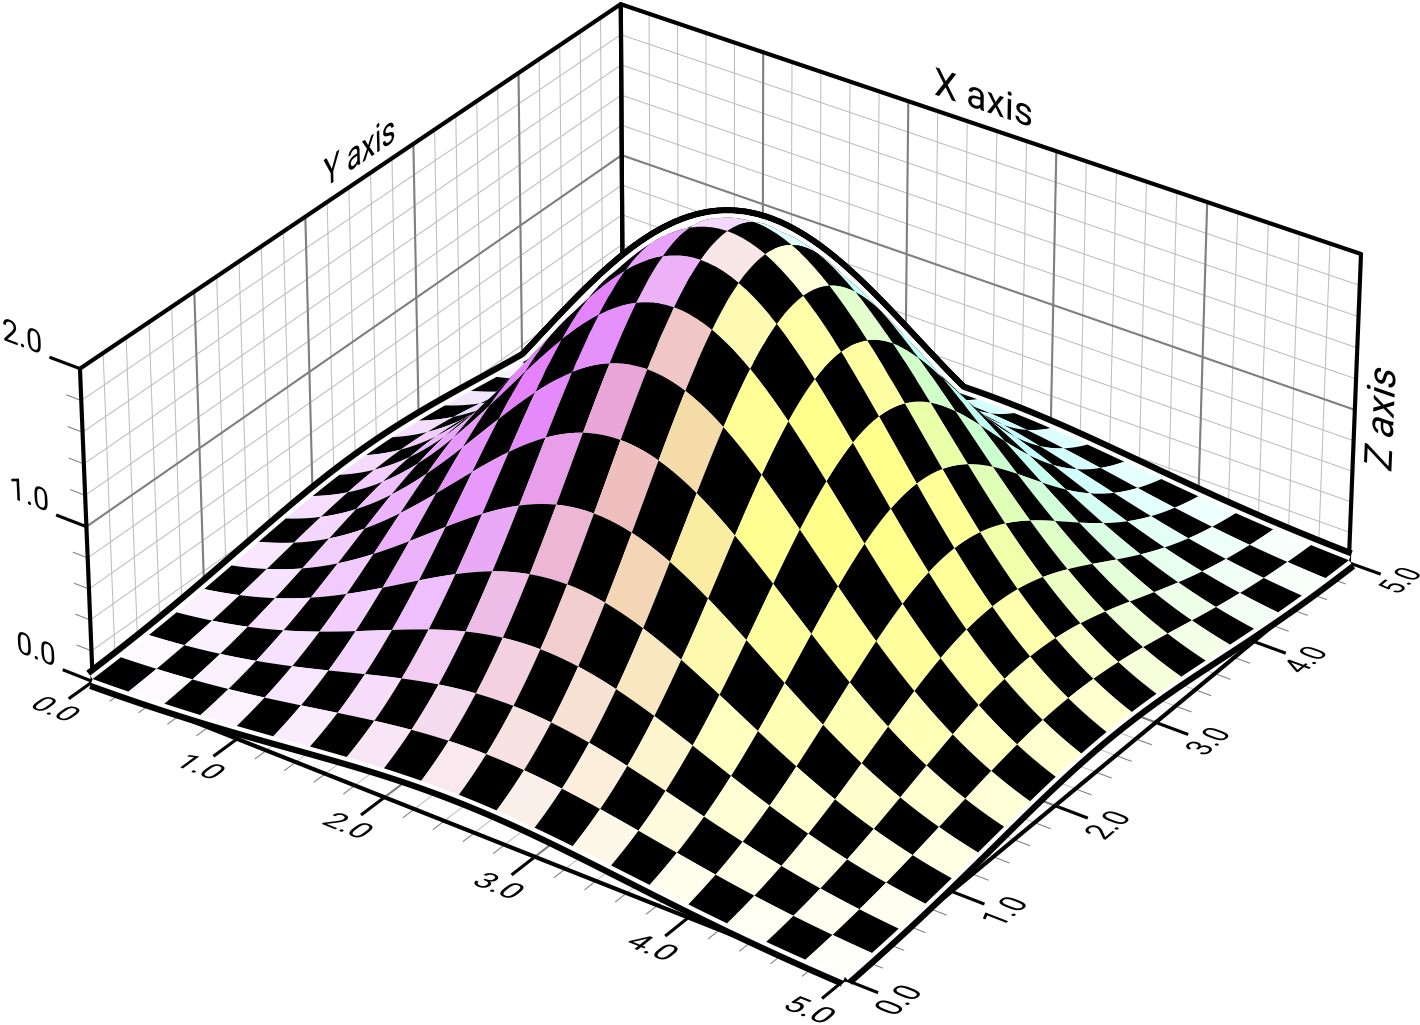
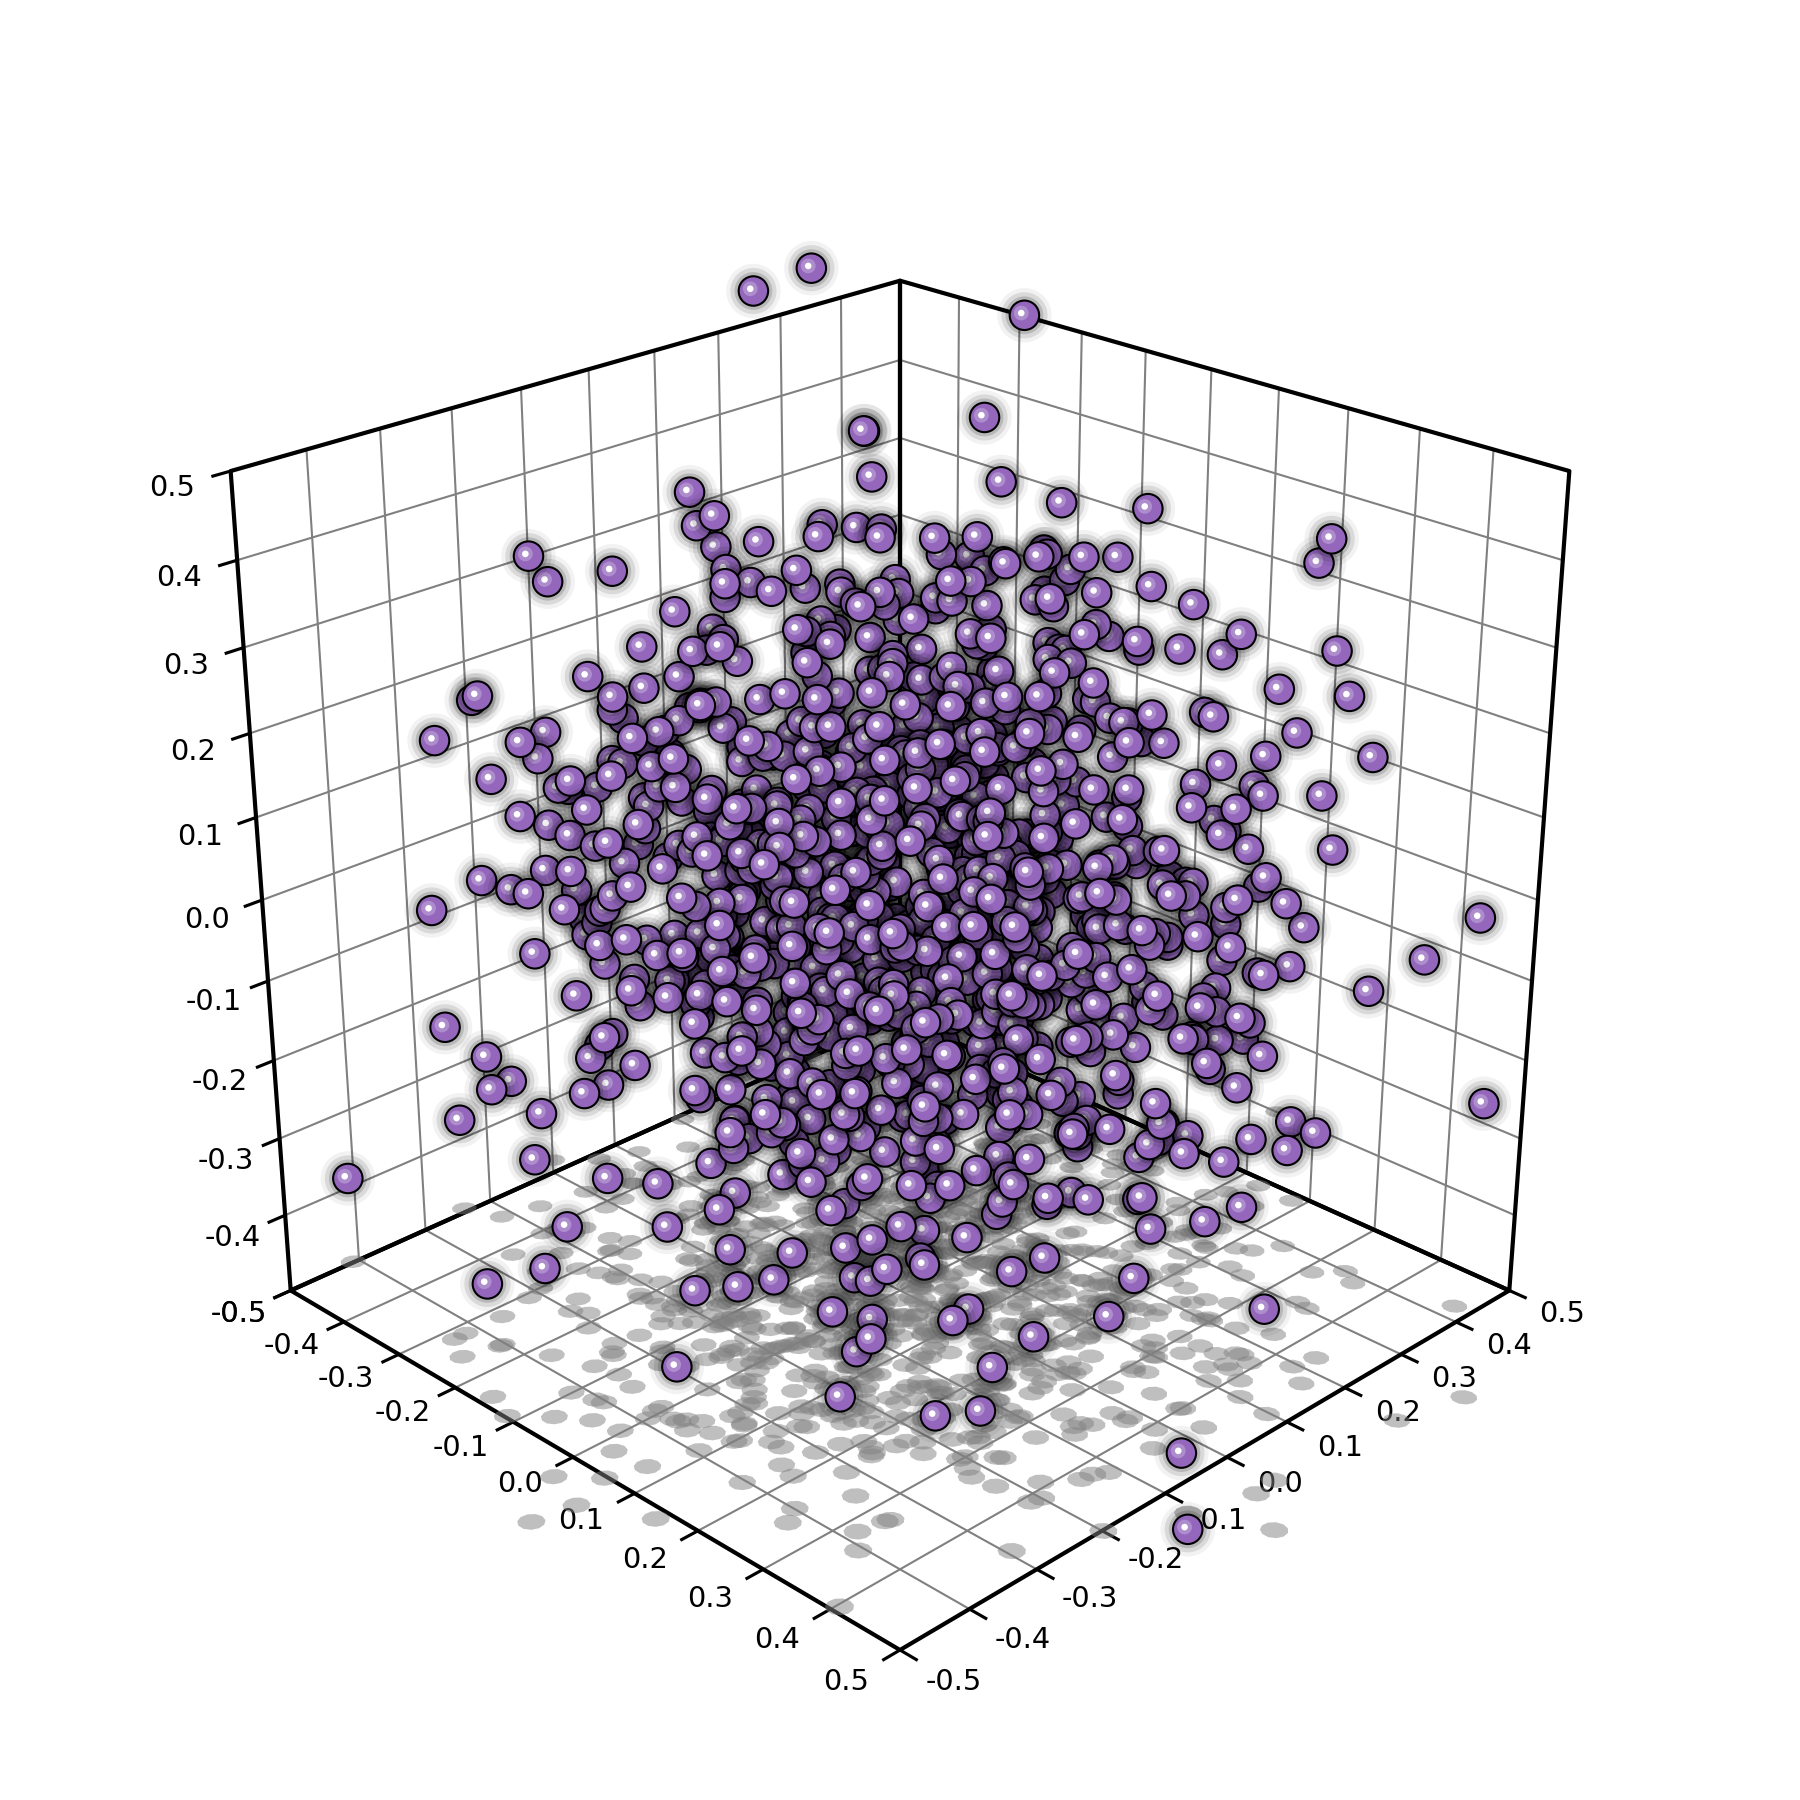
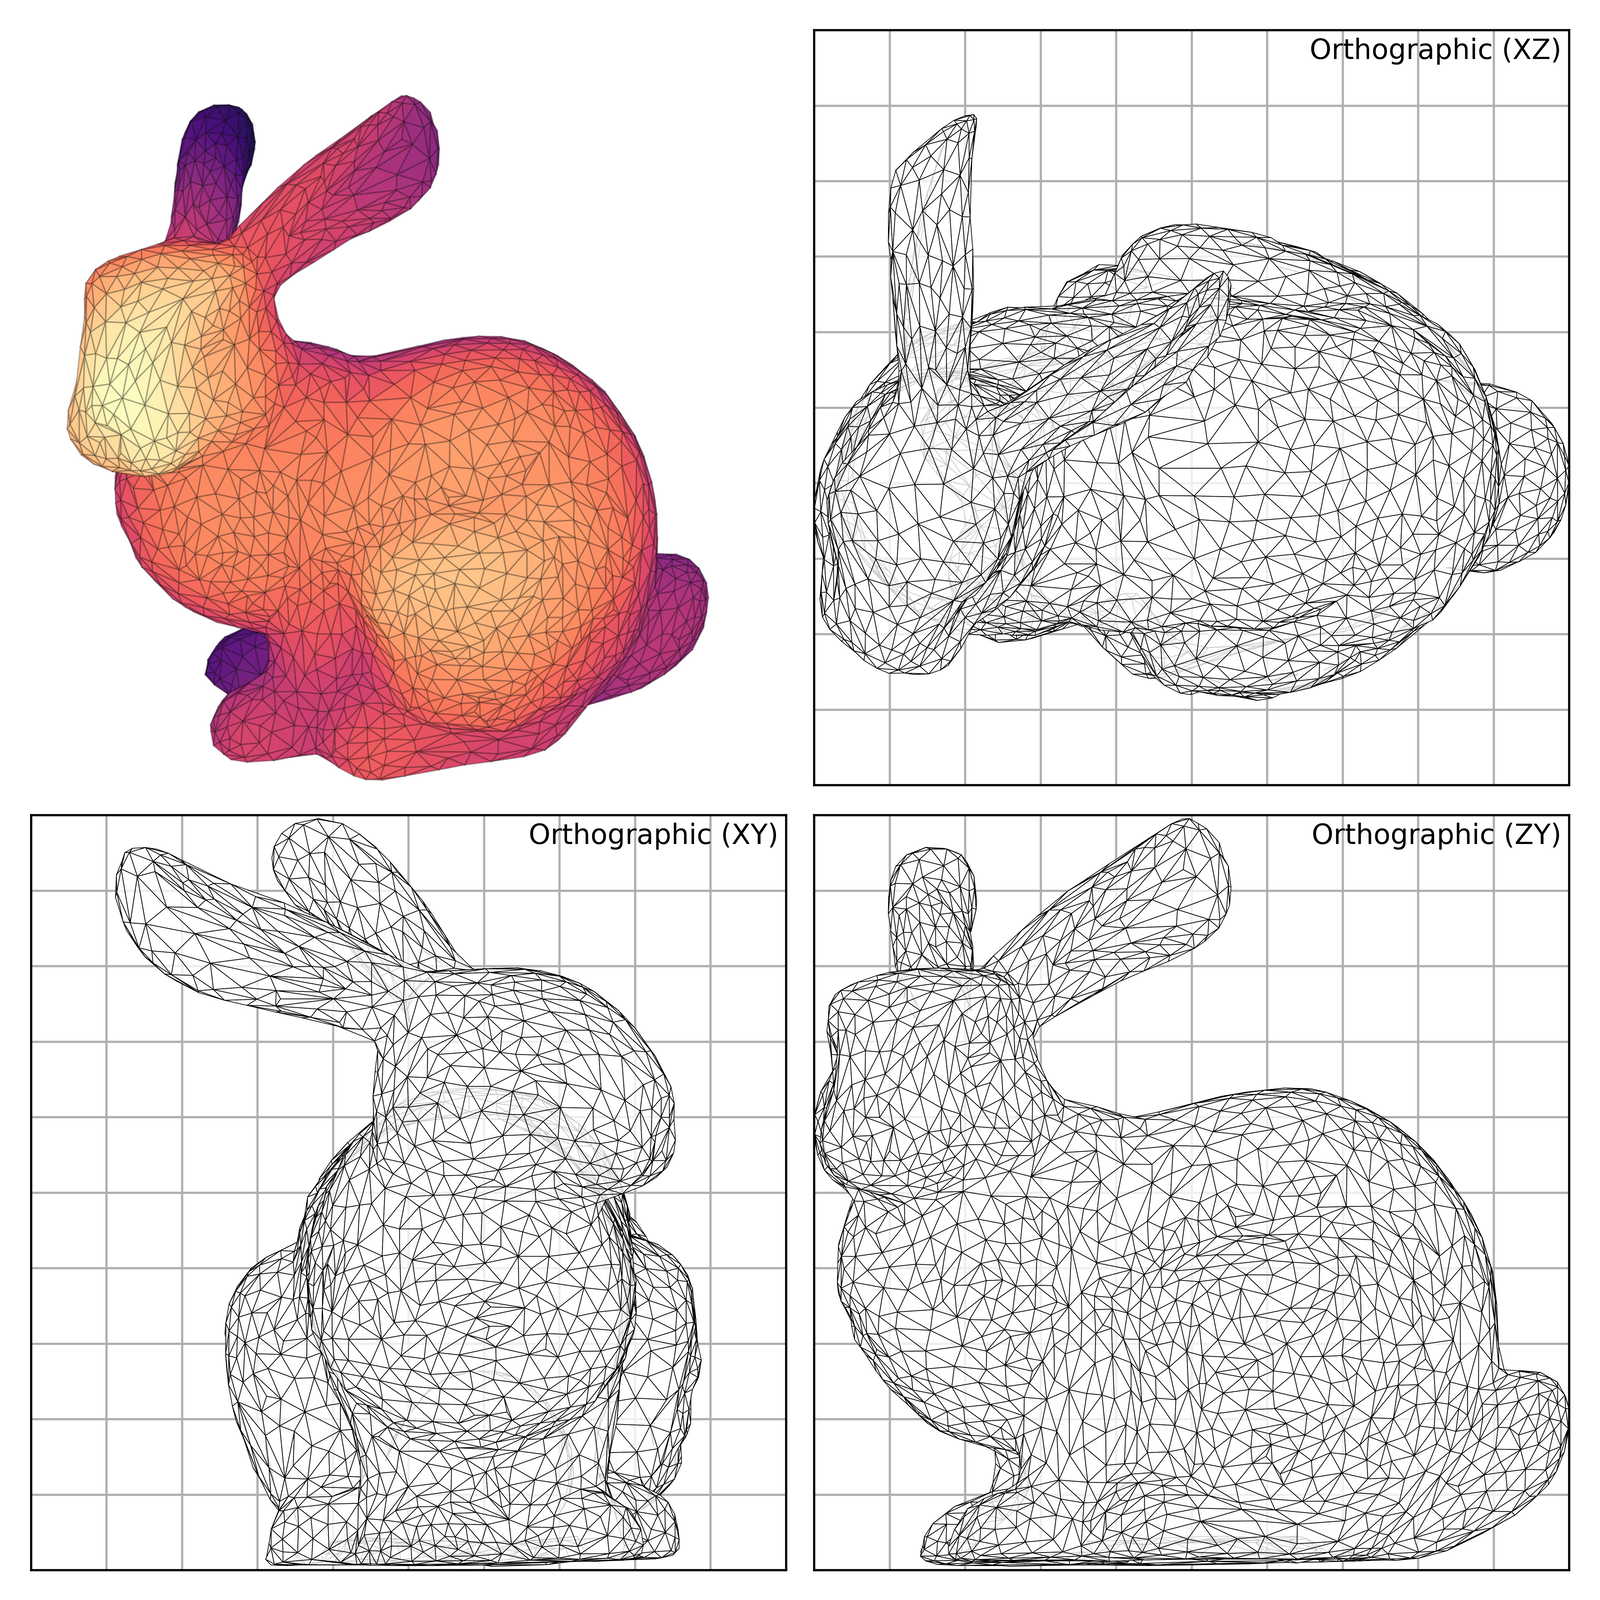
本书围绕标准的 Python 科学计算生态构建:Python、Matplotlib 和 NumPy 是贯穿全书示例的核心工具。这只讲二维绘图吗?还是也涵盖三维和动画?它不止于基础的二维绘图:有一个专门的部分讲解高级主题,包括三维图形、优化和动画,最后还有一个作品展示部分。
它不止于基础的二维绘图:有一个专门的部分讲解高级主题,包括三维图形、优化和动画,最后还有一个作品展示部分。这本书是为谁写的?面向希望用 Matplotlib 制作可用于发表的图形的科学工作者和研究人员,从学习基础的初学者到想掌握进阶技巧的读者都适用。
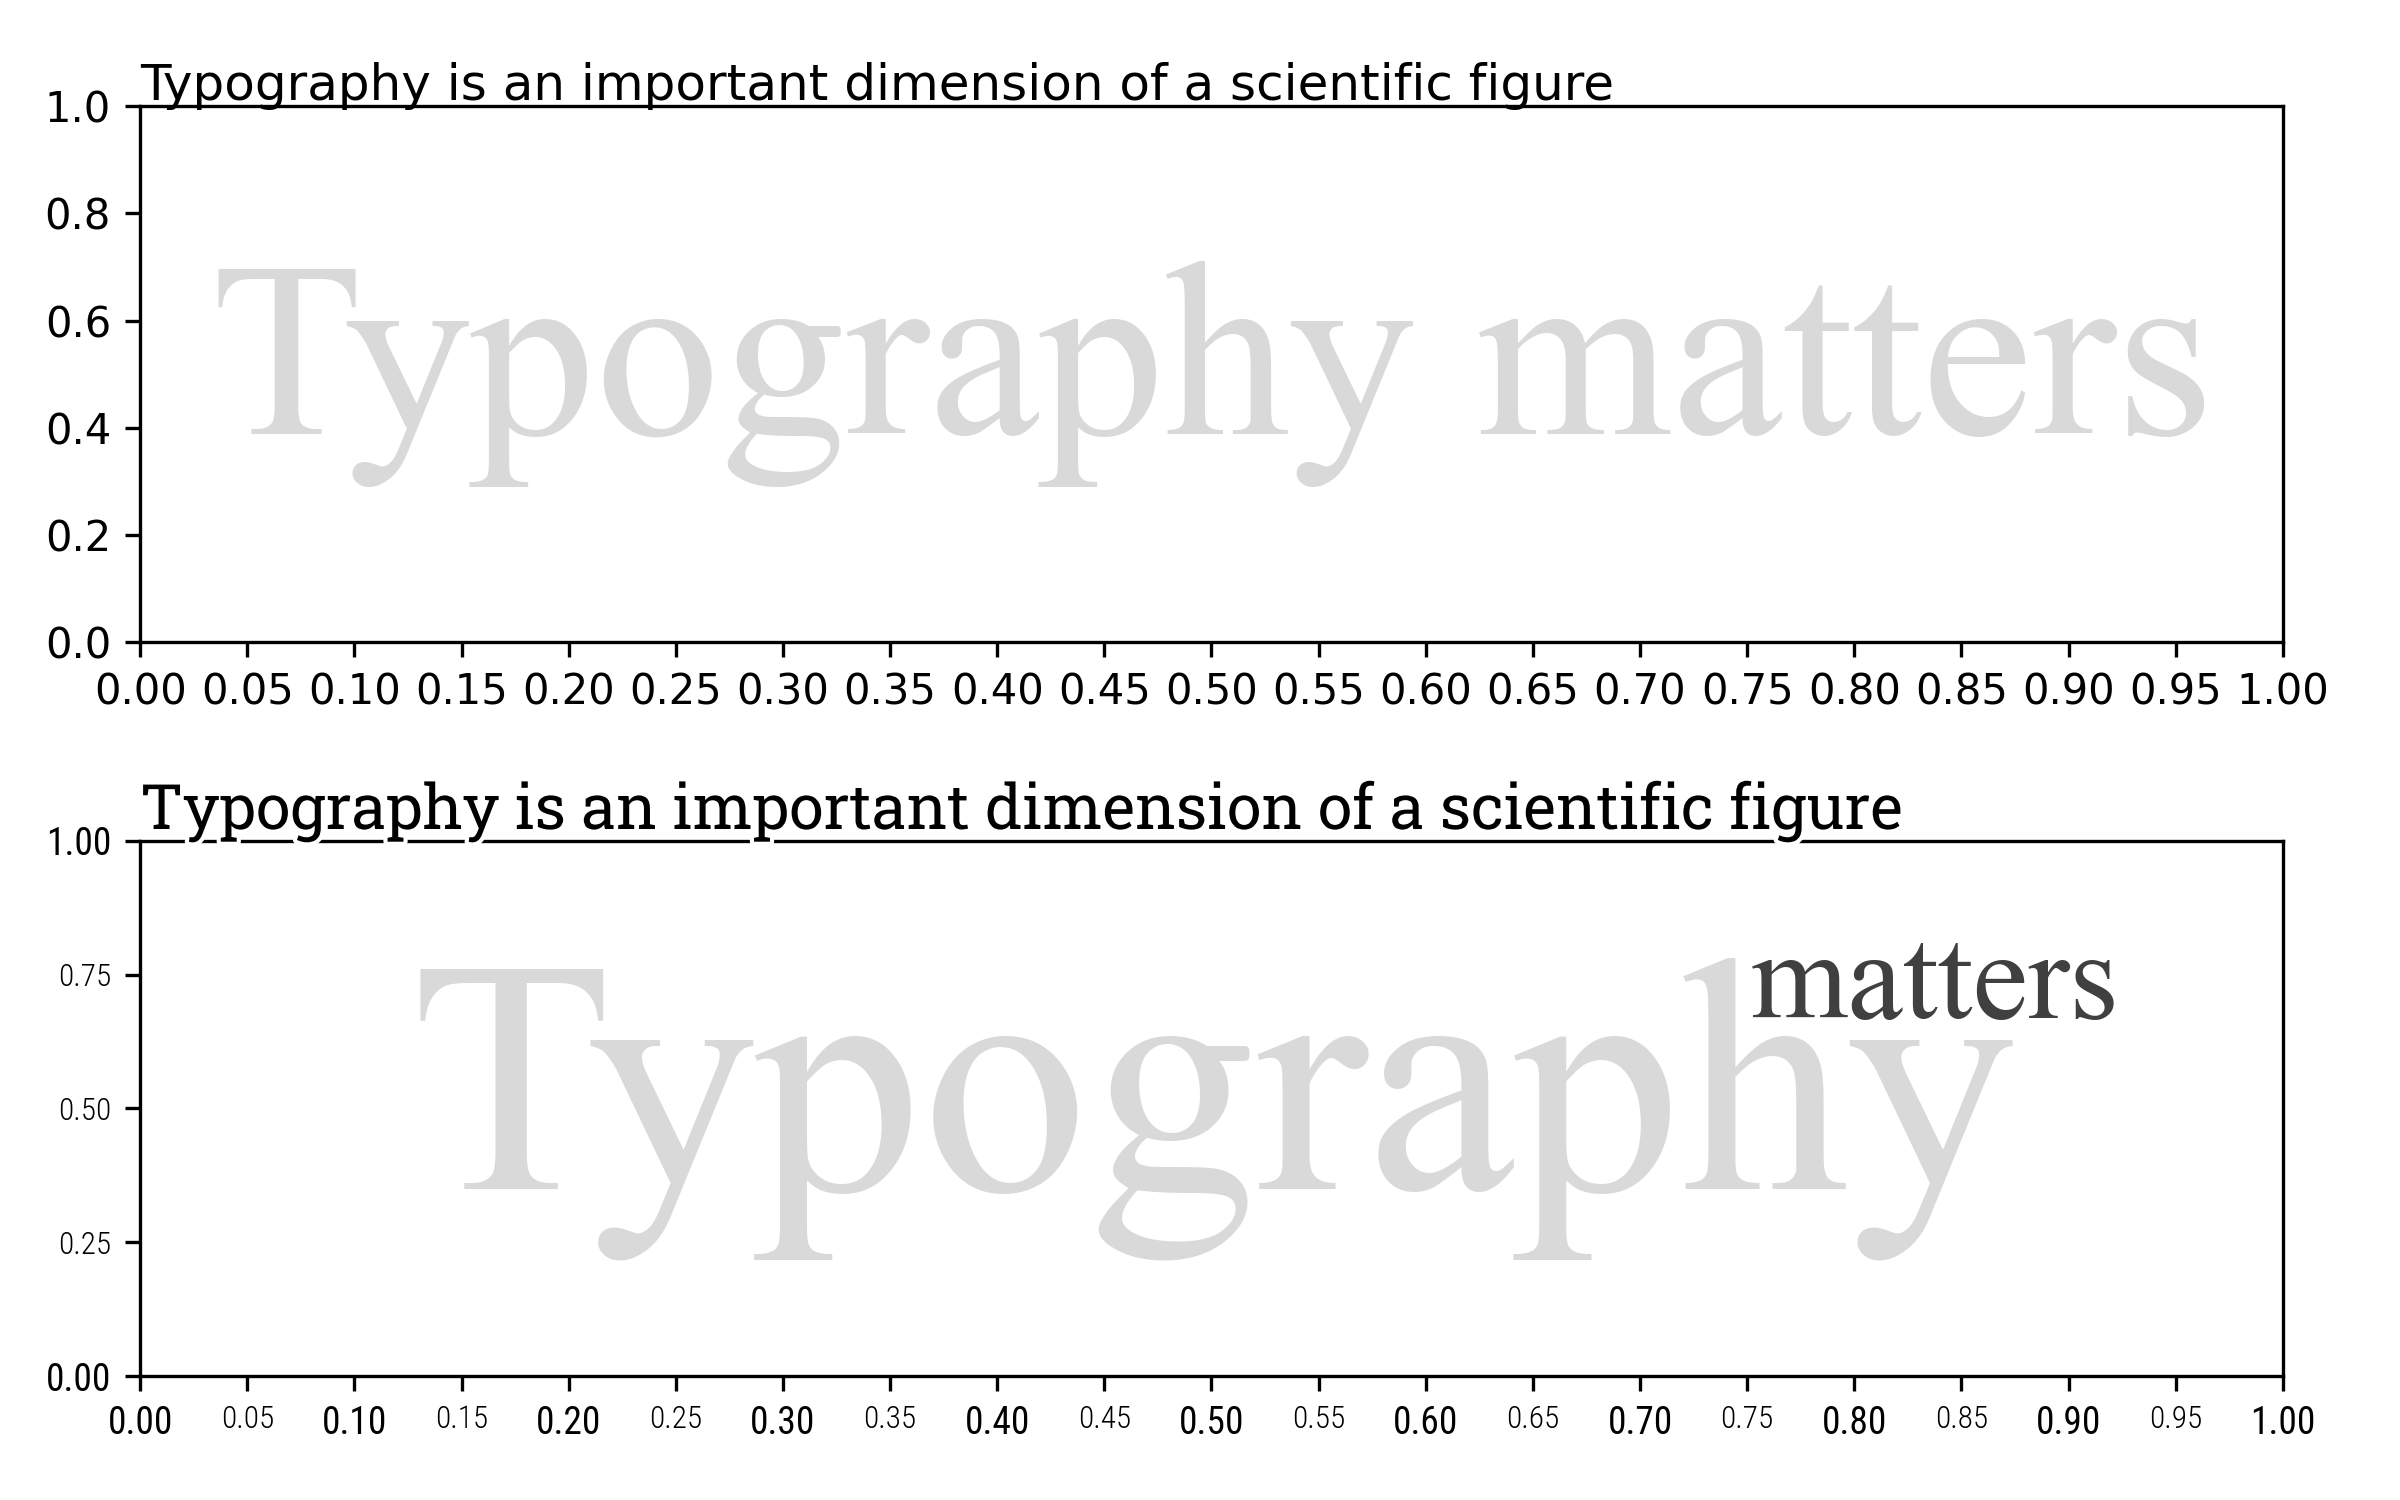
面向希望用 Matplotlib 制作可用于发表的图形的科学工作者和研究人员,从学习基础的初学者到想掌握进阶技巧的读者都适用。这本书是如何组织的?全书分为四个部分:Matplotlib 基本原理(图形结构、坐标系统、排版、颜色)、图形设计实践(默认设置、样式、布局、图表类型、装饰元素)、高级概念(三维、优化、动画),以及最后的作品展示画廊。
全书分为四个部分:Matplotlib 基本原理(图形结构、坐标系统、排版、颜色)、图形设计实践(默认设置、样式、布局、图表类型、装饰元素)、高级概念(三维、优化、动画),以及最后的作品展示画廊。作者为什么特别强调 Matplotlib?作者指出,在庞大的 Python 可视化工具生态中,Matplotlib 之所以突出,是因为它功能全面、强大,提供直观的面向对象接口,可以调整图形的任何部分,并且既适用于科学图形,也适用于非科学图形。
作者指出,在庞大的 Python 可视化工具生态中,Matplotlib 之所以突出,是因为它功能全面、强大,提供直观的面向对象接口,可以调整图形的任何部分,并且既适用于科学图形,也适用于非科学图形。我能不免费阅读,而是支持作者吗?可以,你可以在亚马逊上以 49 美元购买纸质版,或通过 PayPal、GitHub 或 Liberapay 赞助作者未来的 Python/Emacs 相关工作。
可以,你可以在亚马逊上以 49 美元购买纸质版,或通过 PayPal、GitHub 或 Liberapay 赞助作者未来的 Python/Emacs 相关工作。What are similar projects?pydata-book, word_cloud, data-science-ipython-notebooks, matplotlib, 100-Days-Of-ML-Code, mlcourse.ai, PythonDataScienceHandbook, abu
pydata-book, word_cloud, data-science-ipython-notebooks, matplotlib, 100-Days-Of-ML-Code, mlcourse.ai, PythonDataScienceHandbook, abuWhich topics is it in?dataviz, plotting, matplotlib, numpy, visualization, data-visualization, data-science, book, learning, tutorial, research, education
dataviz, plotting, matplotlib, numpy, visualization, data-visualization, data-science, book, learning, tutorial, research, education