


What is this?
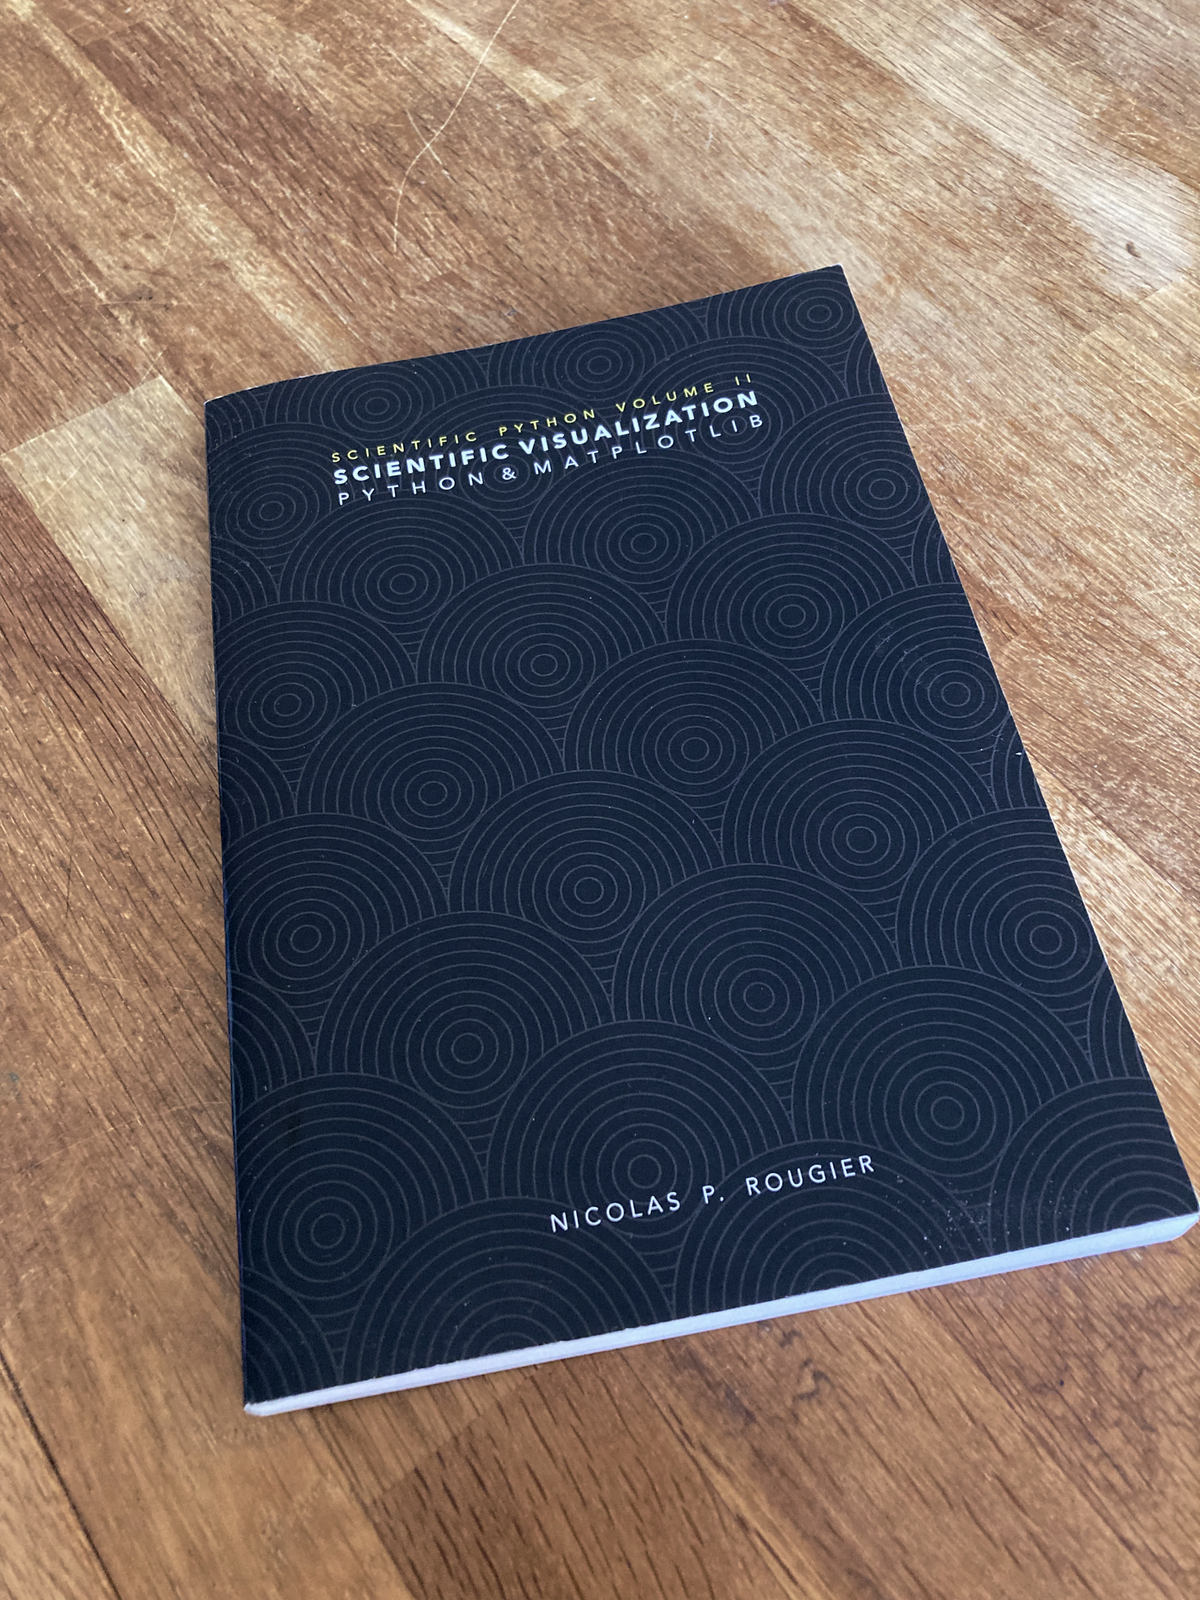
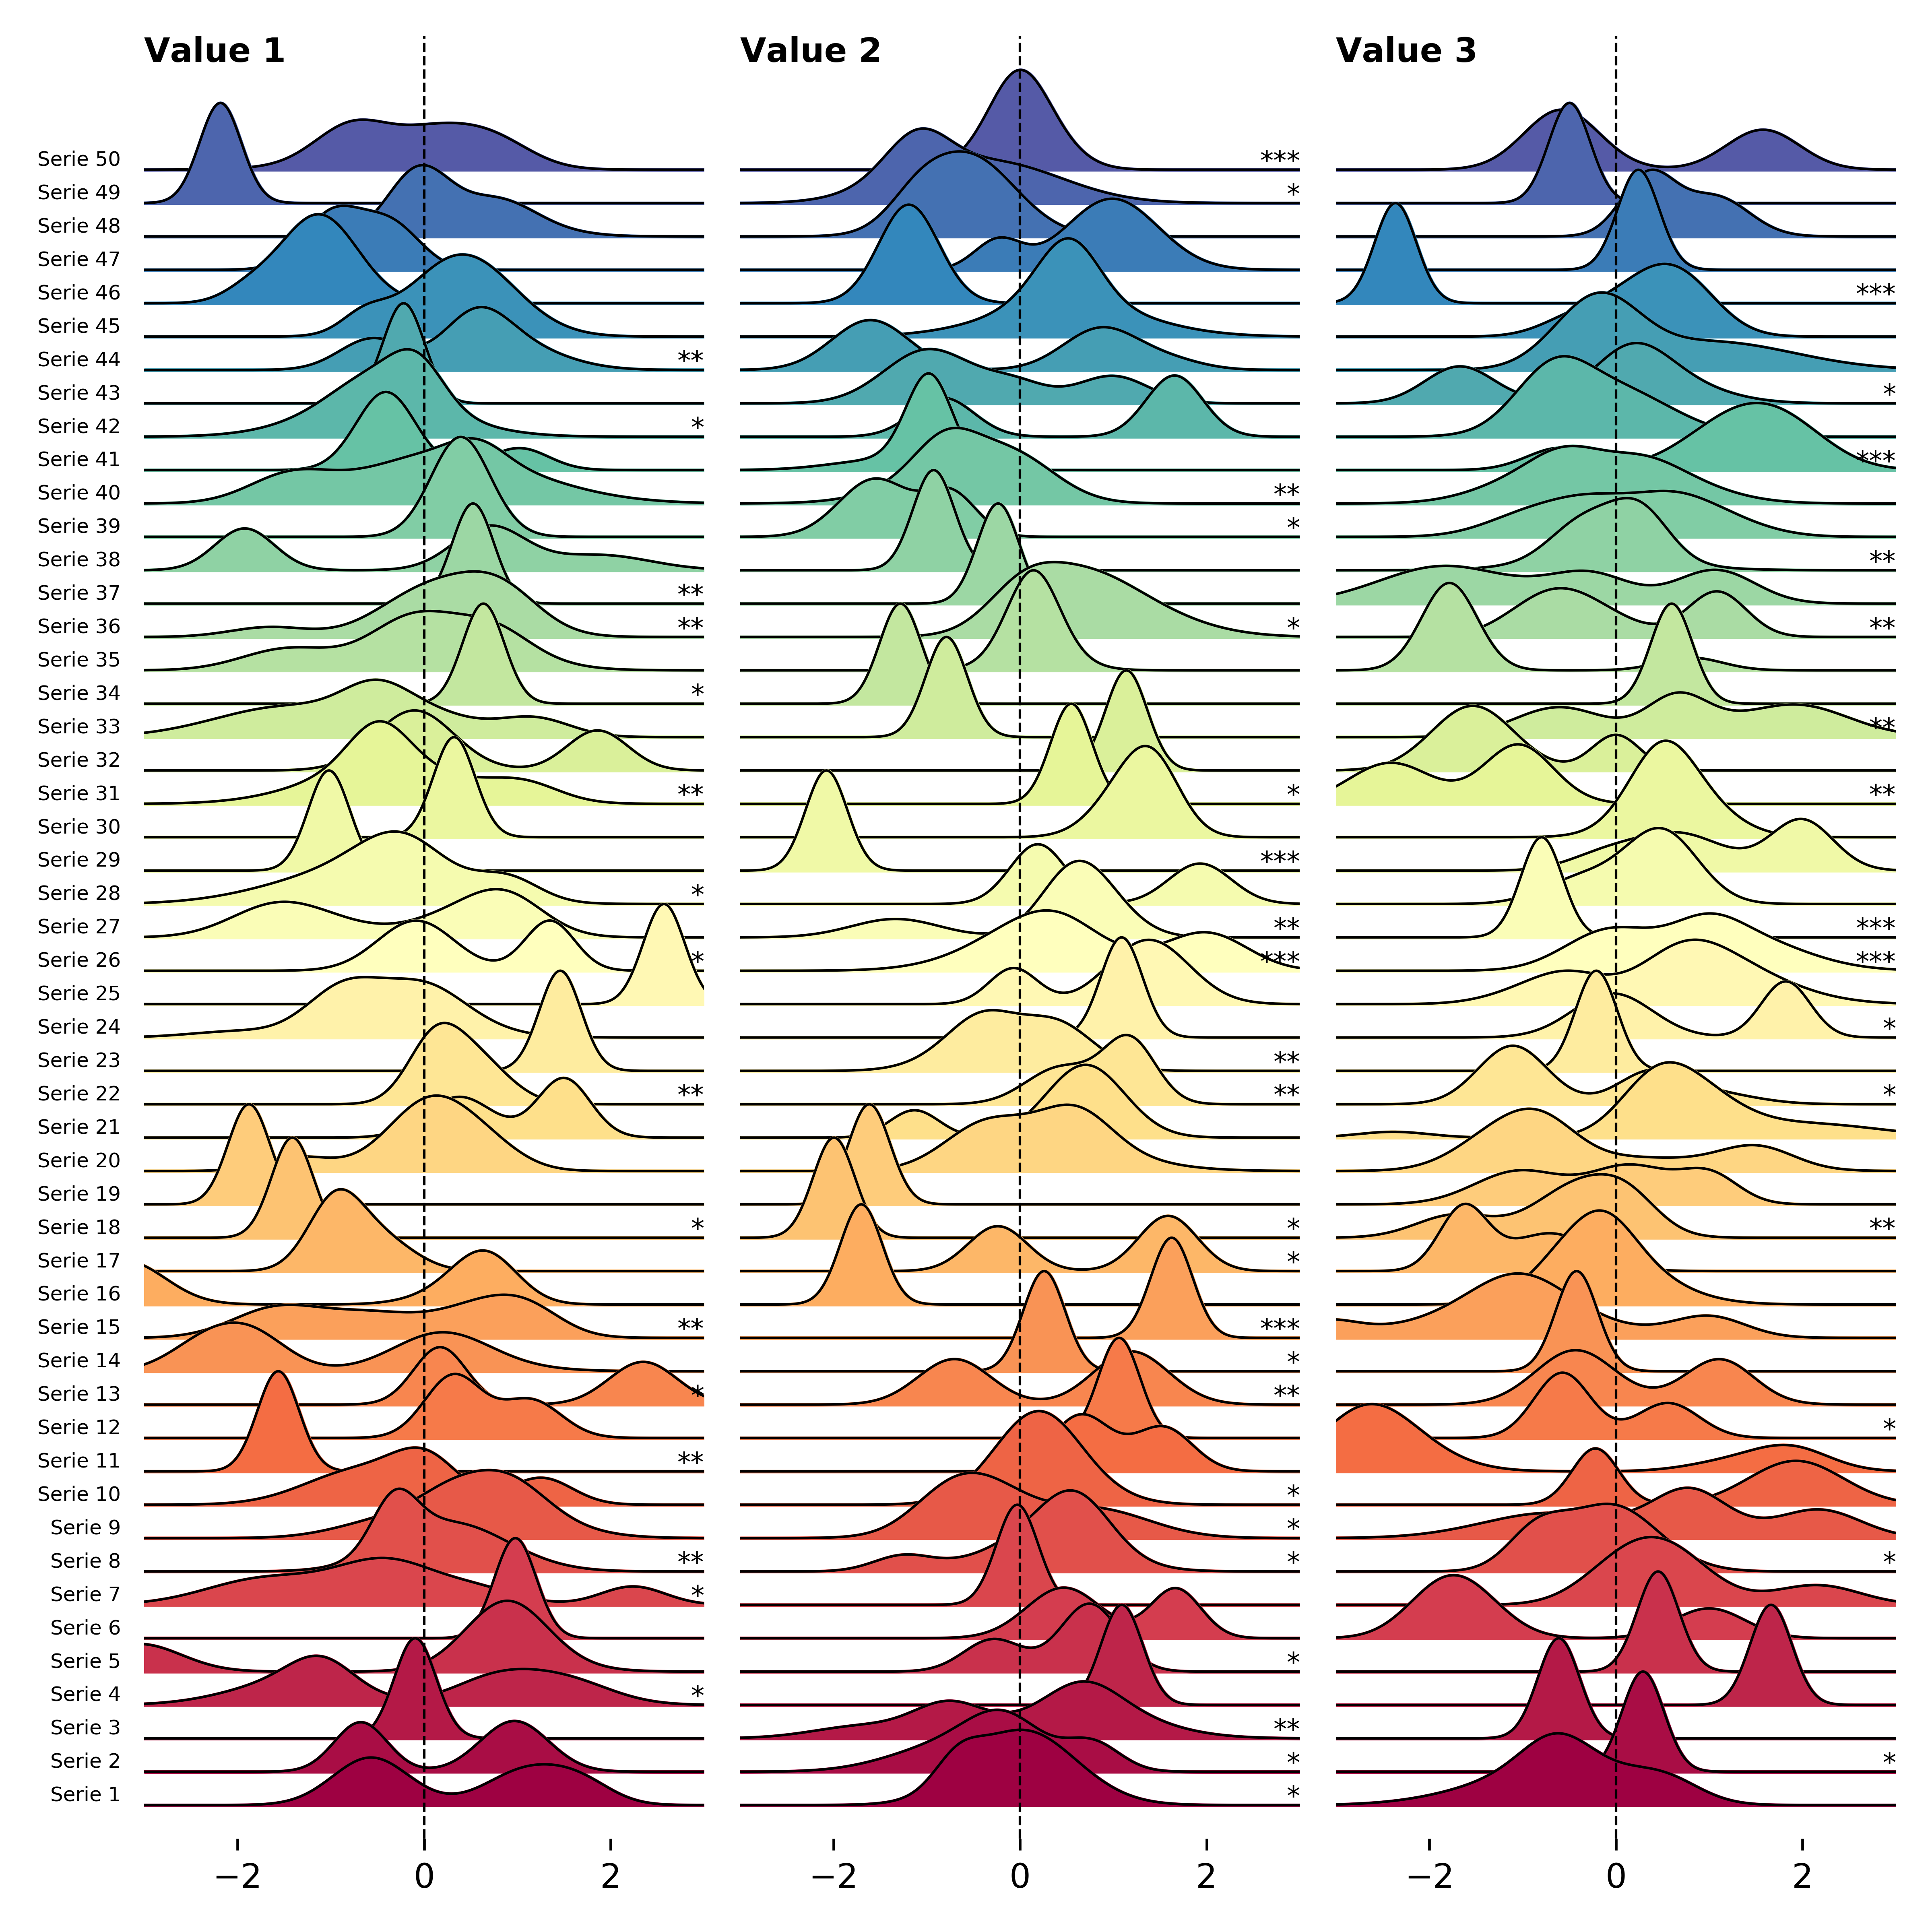
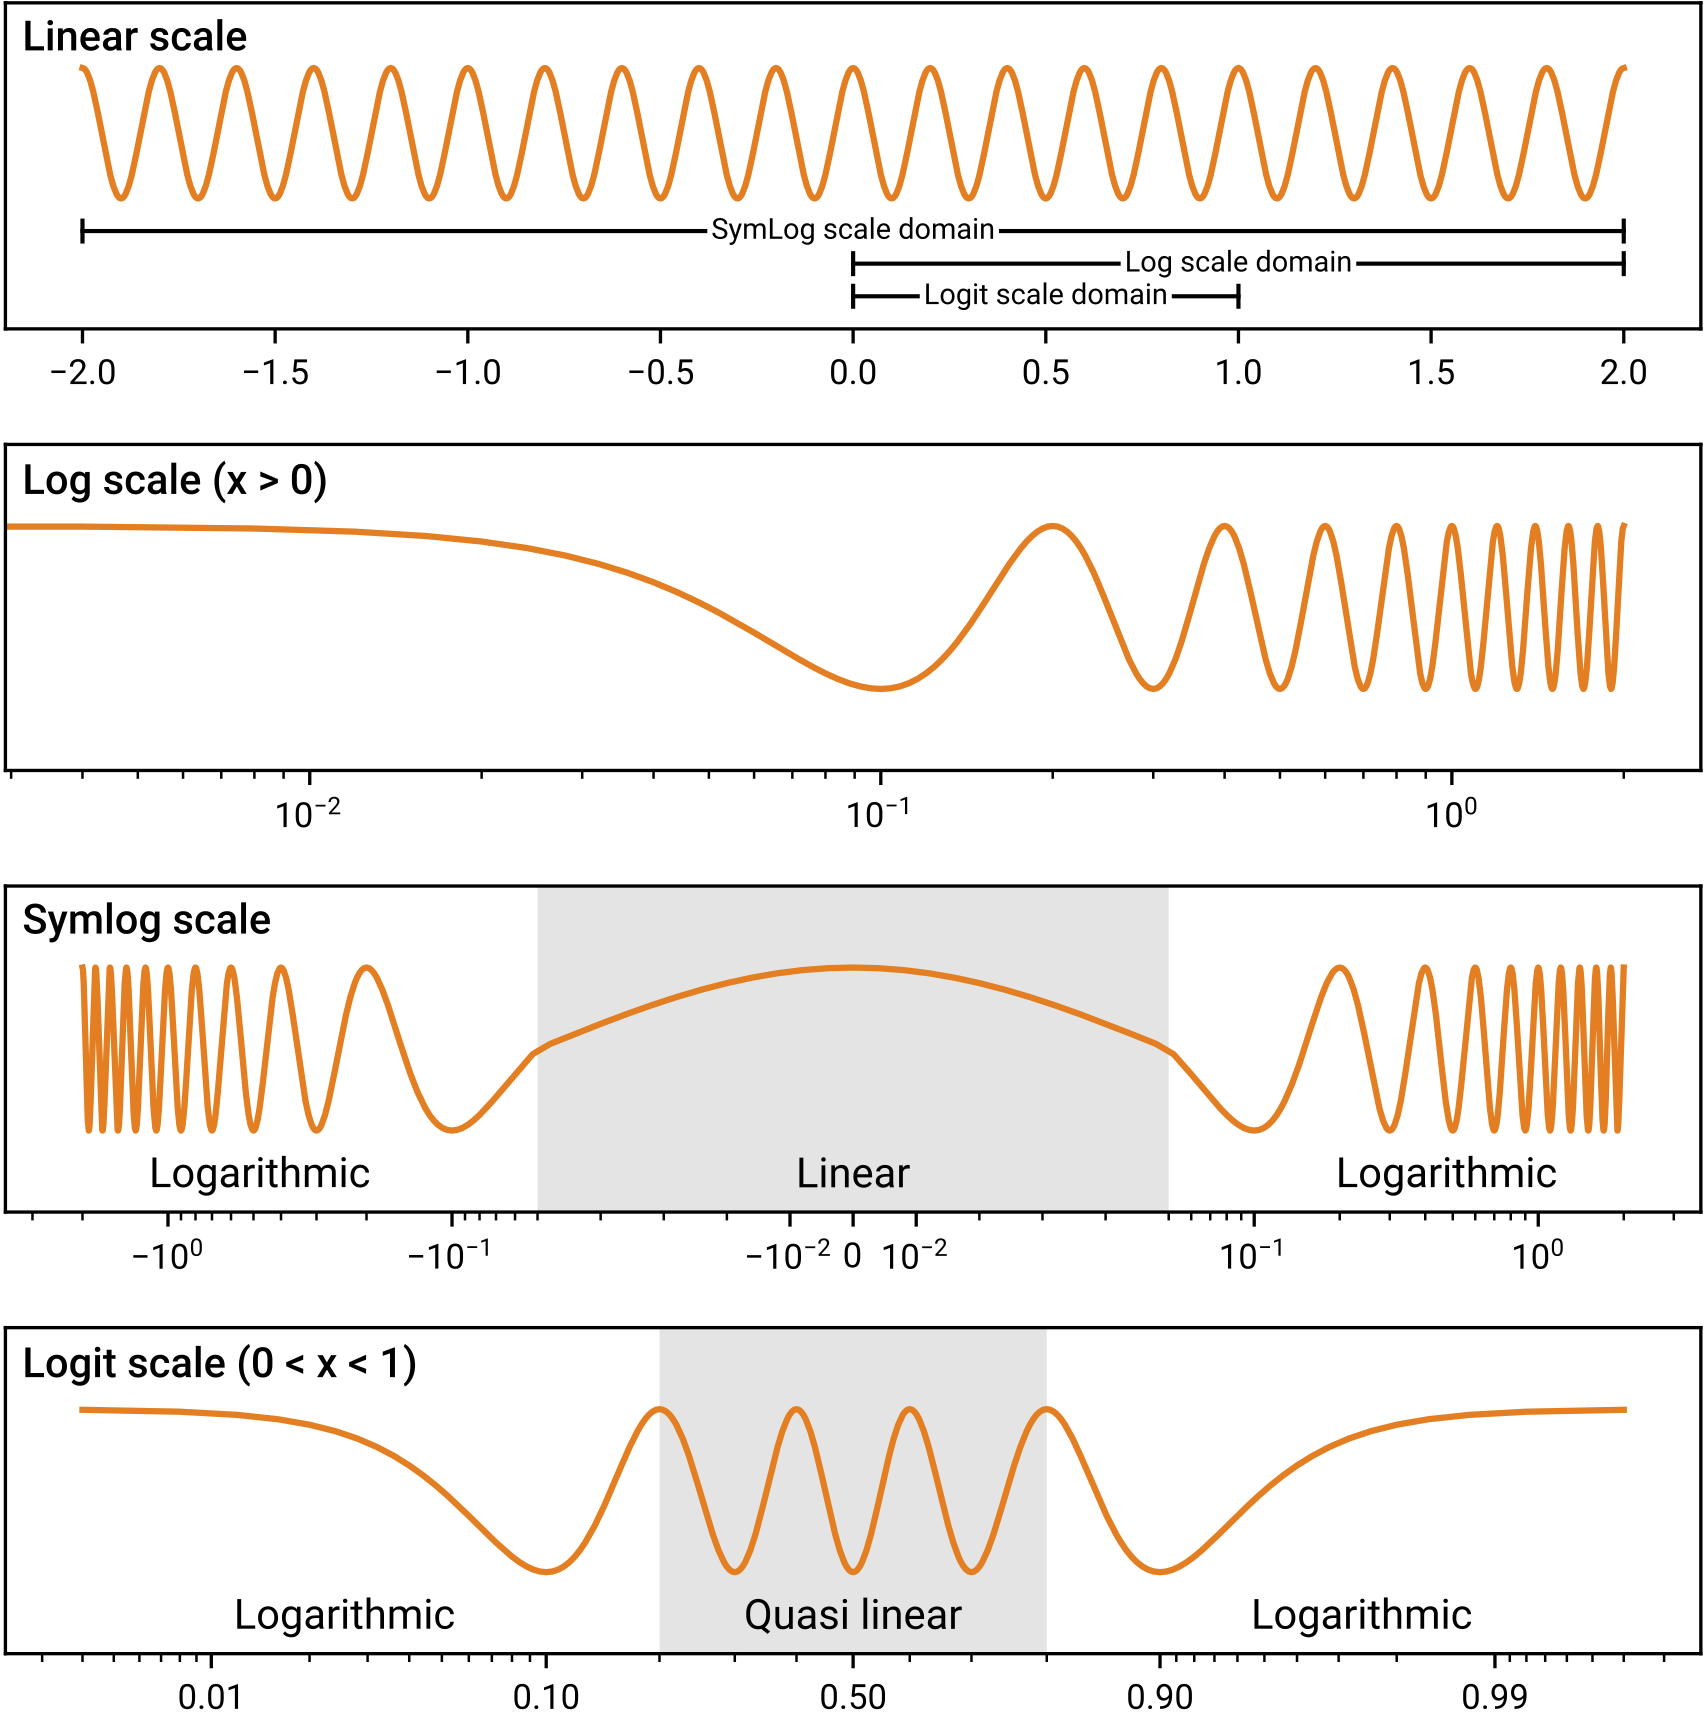
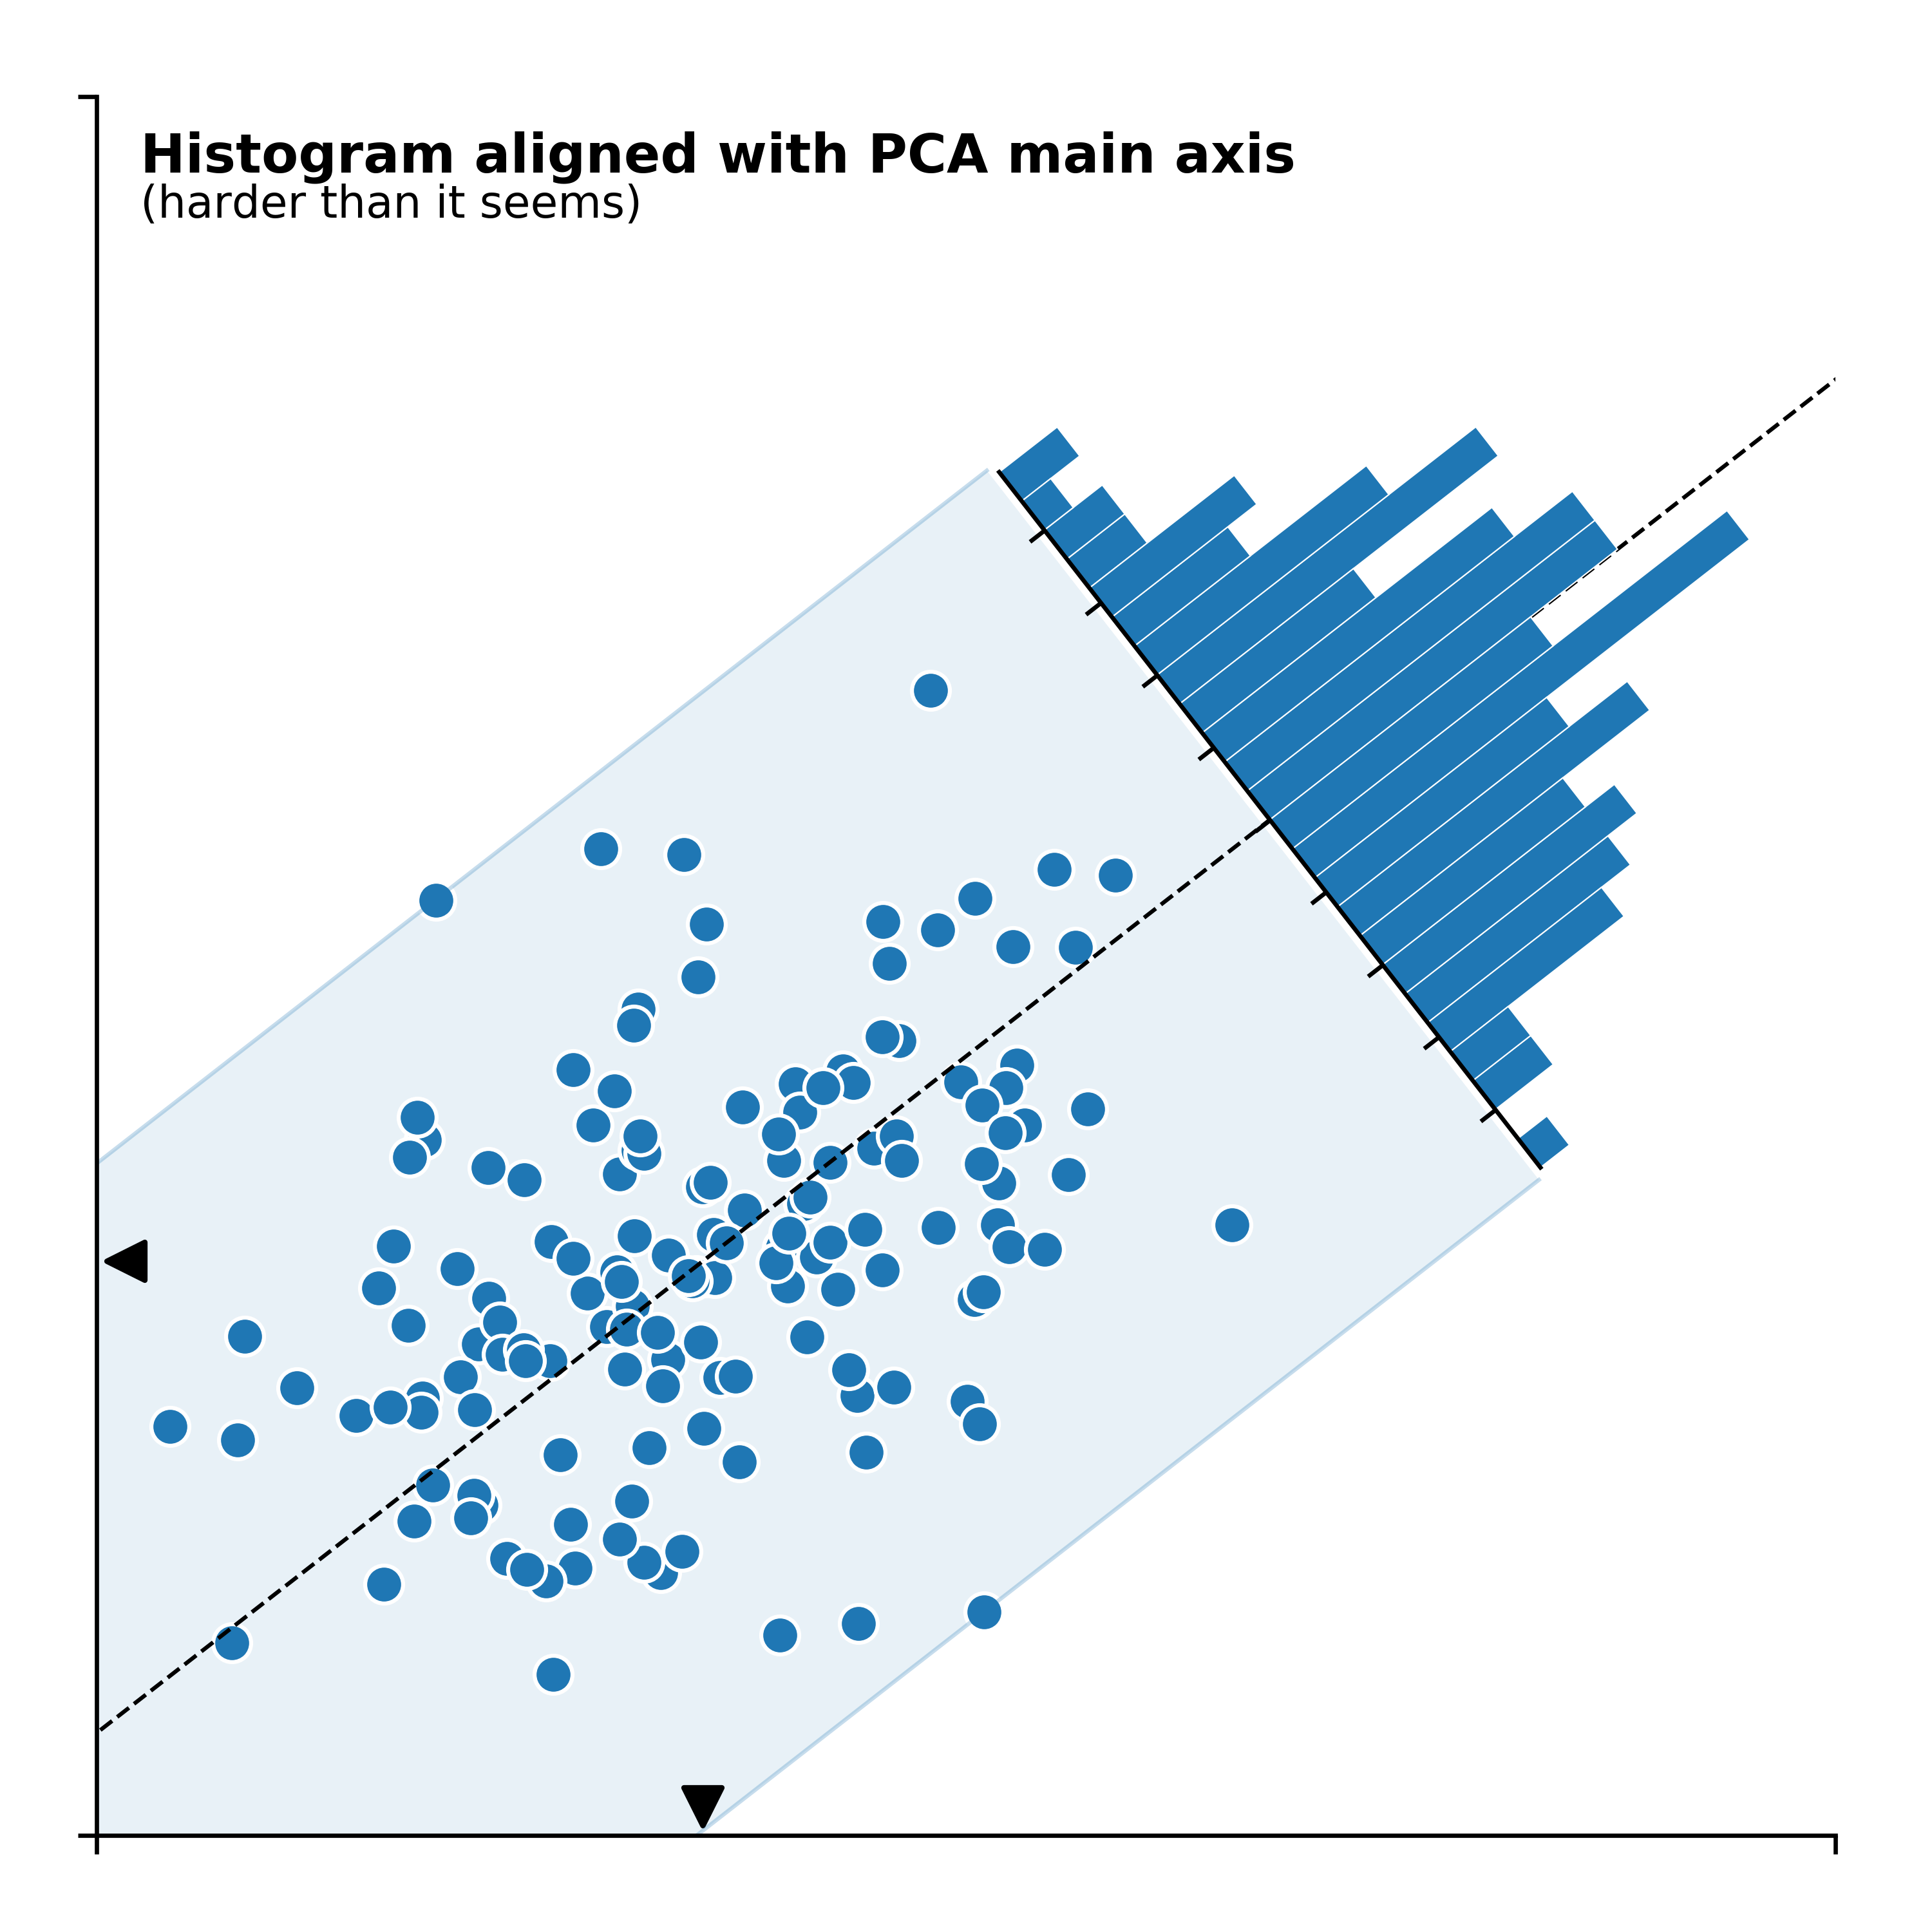
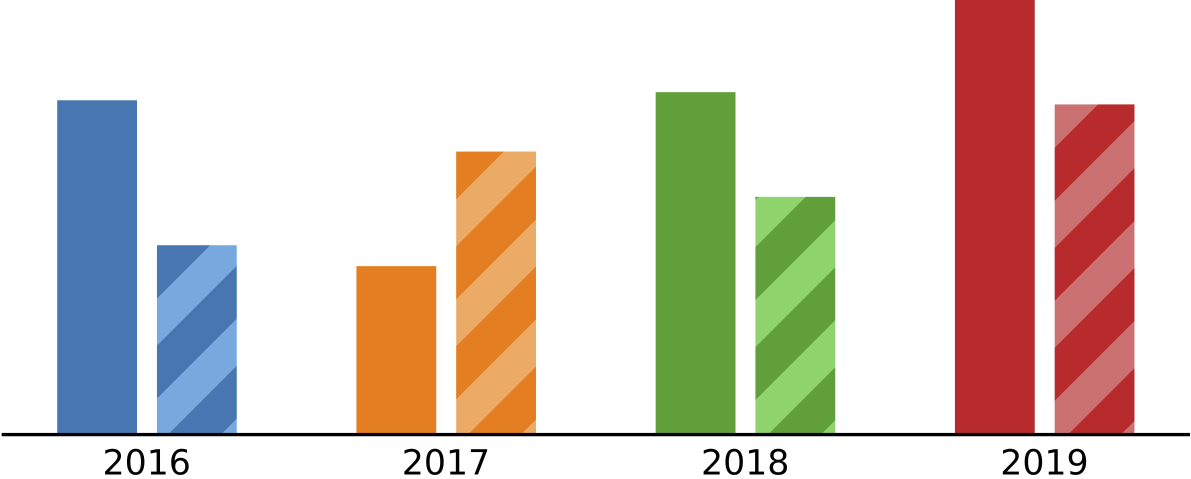
 This is an open access book that teaches scientific visualization in Python using Matplotlib, covering everything from core principles to 3D figures, animation, and a showcase gallery.
This is an open access book that teaches scientific visualization in Python using Matplotlib, covering everything from core principles to 3D figures, animation, and a showcase gallery.Is this a book or a code library?It is a book (with accompanying source code and figure examples), not a library you import into your own project.
It is a book (with accompanying source code and figure examples), not a library you import into your own project.How do I read it?Read the free PDF hosted on HAL (the open access archive), or get the up-to-date version from the GitHub repo; a printed edition can also be bought on Amazon for $49.
Read the free PDF hosted on HAL (the open access archive), or get the up-to-date version from the GitHub repo; a printed edition can also be bought on Amazon for $49.Do I need anything beyond Python and Matplotlib to follow along?The book is built around the standard Python scientific stack: Python, Matplotlib, and NumPy are the core tools used throughout the examples.
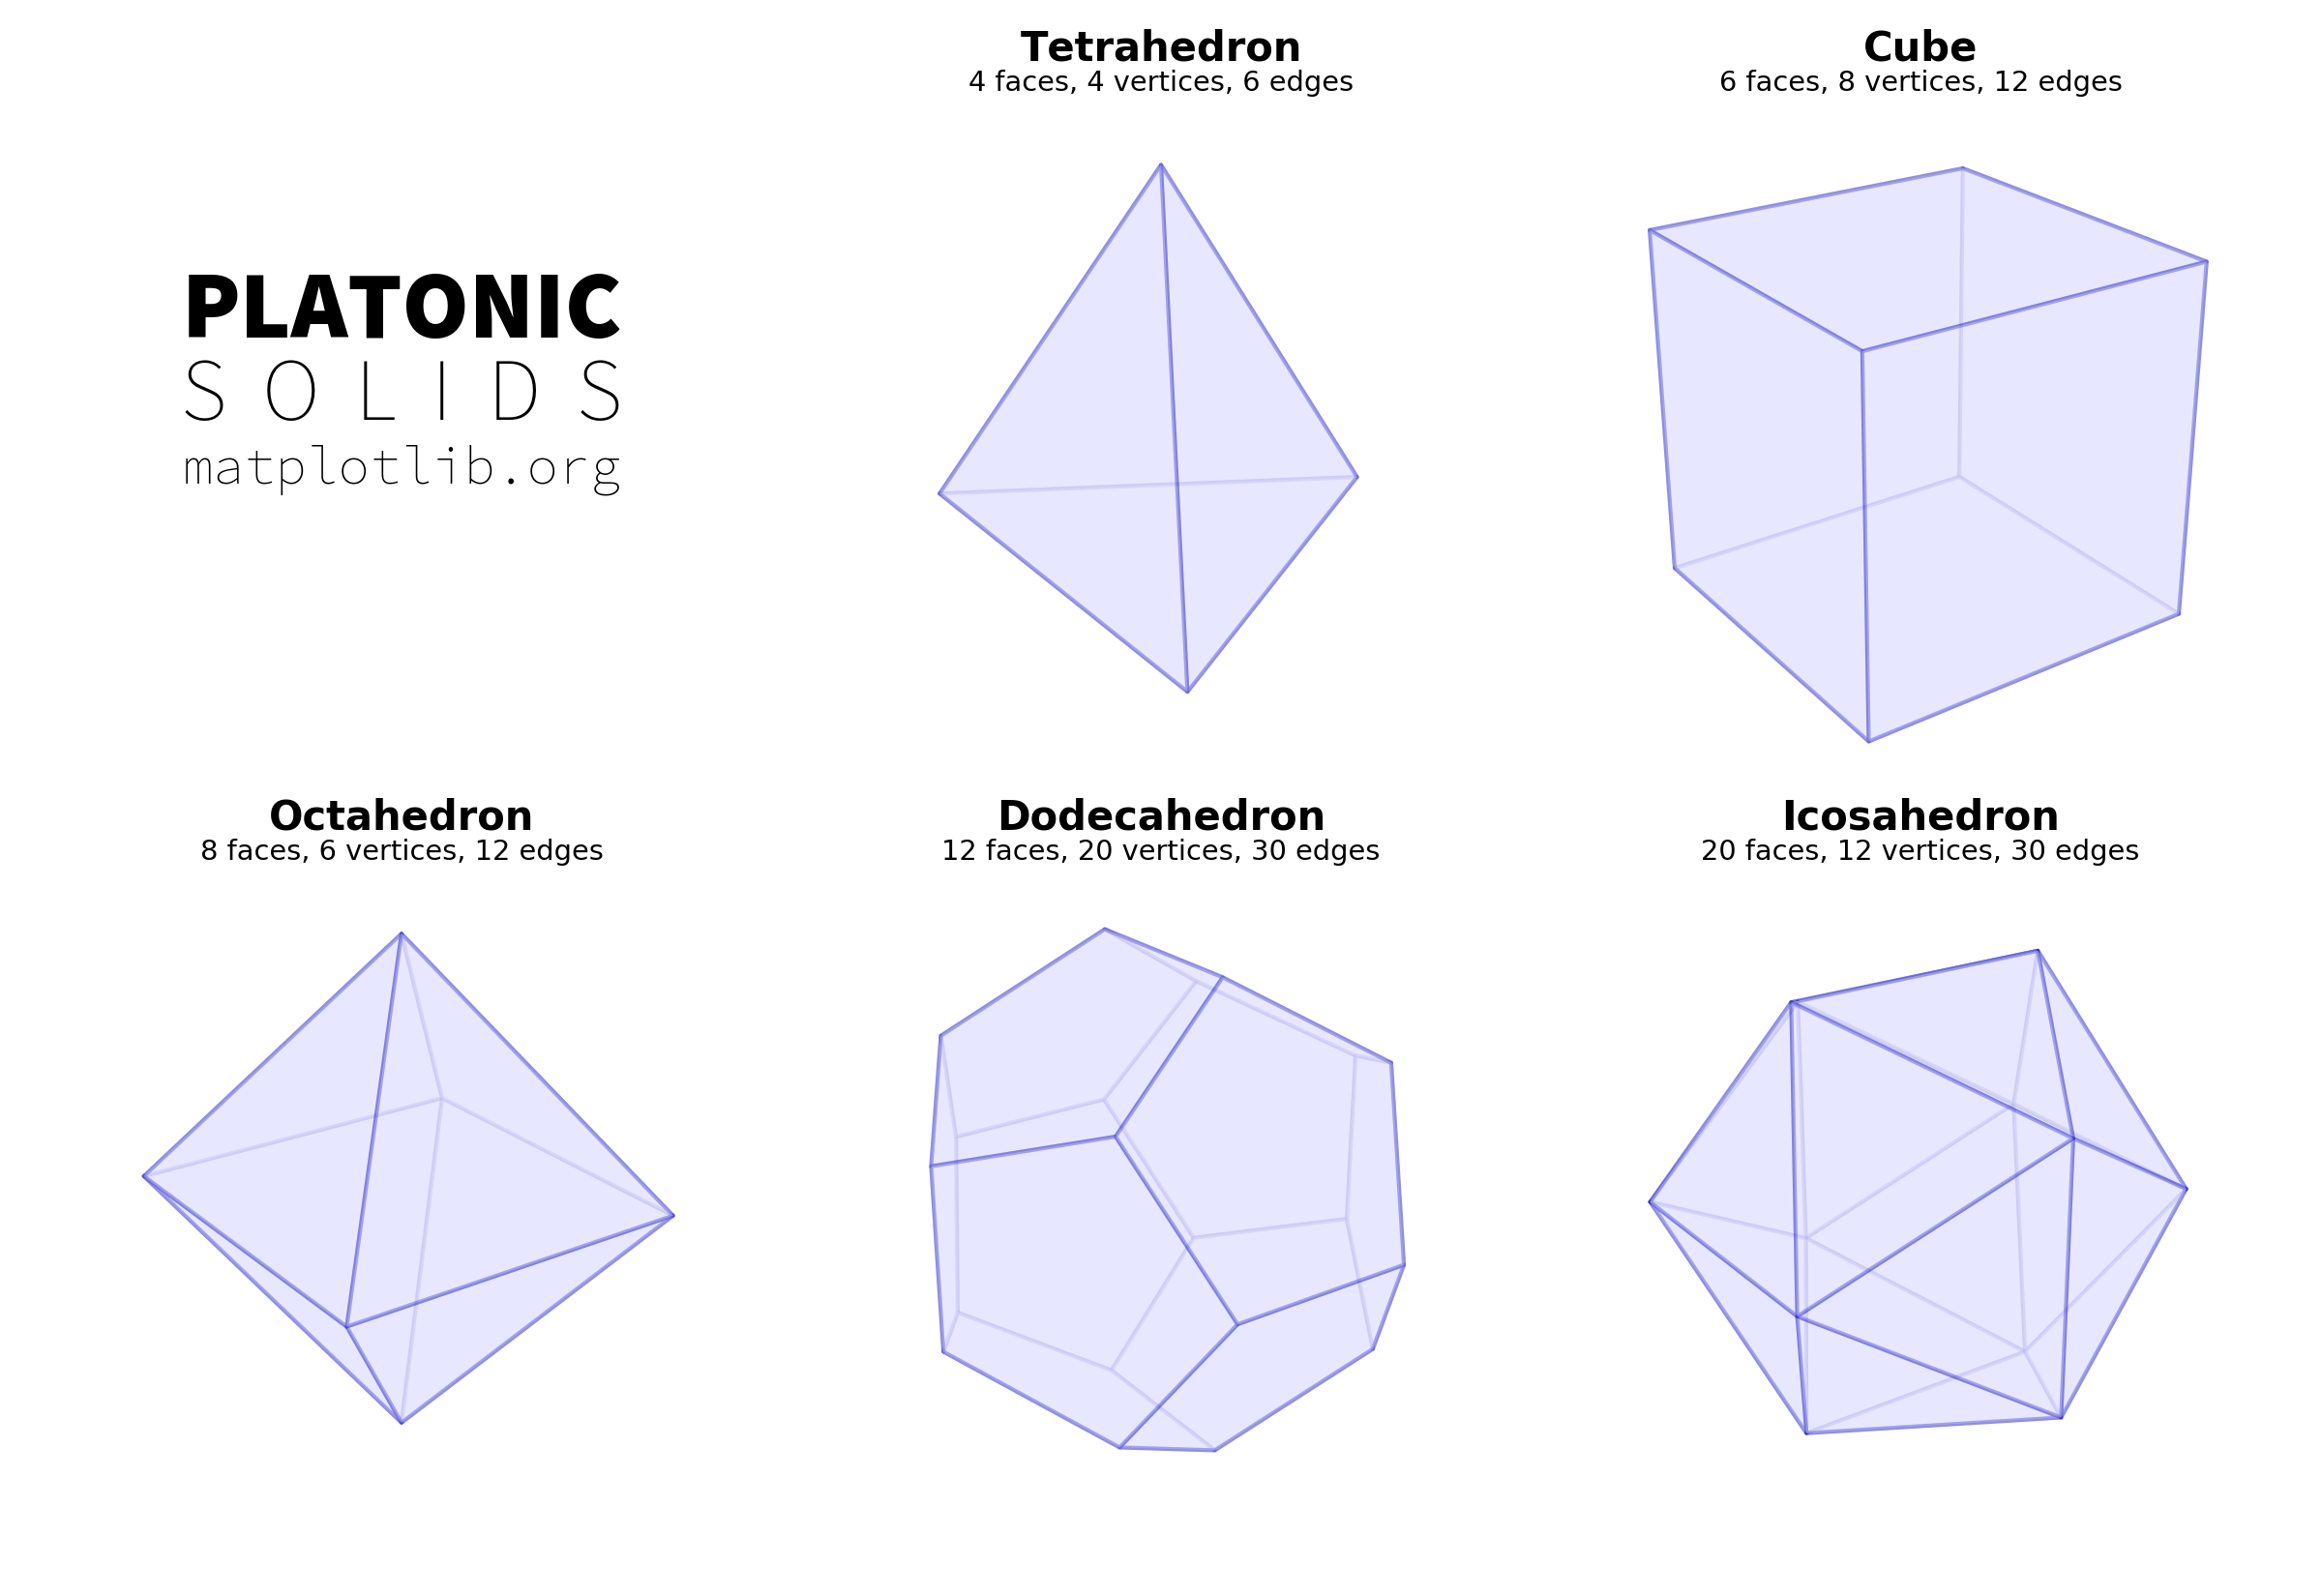
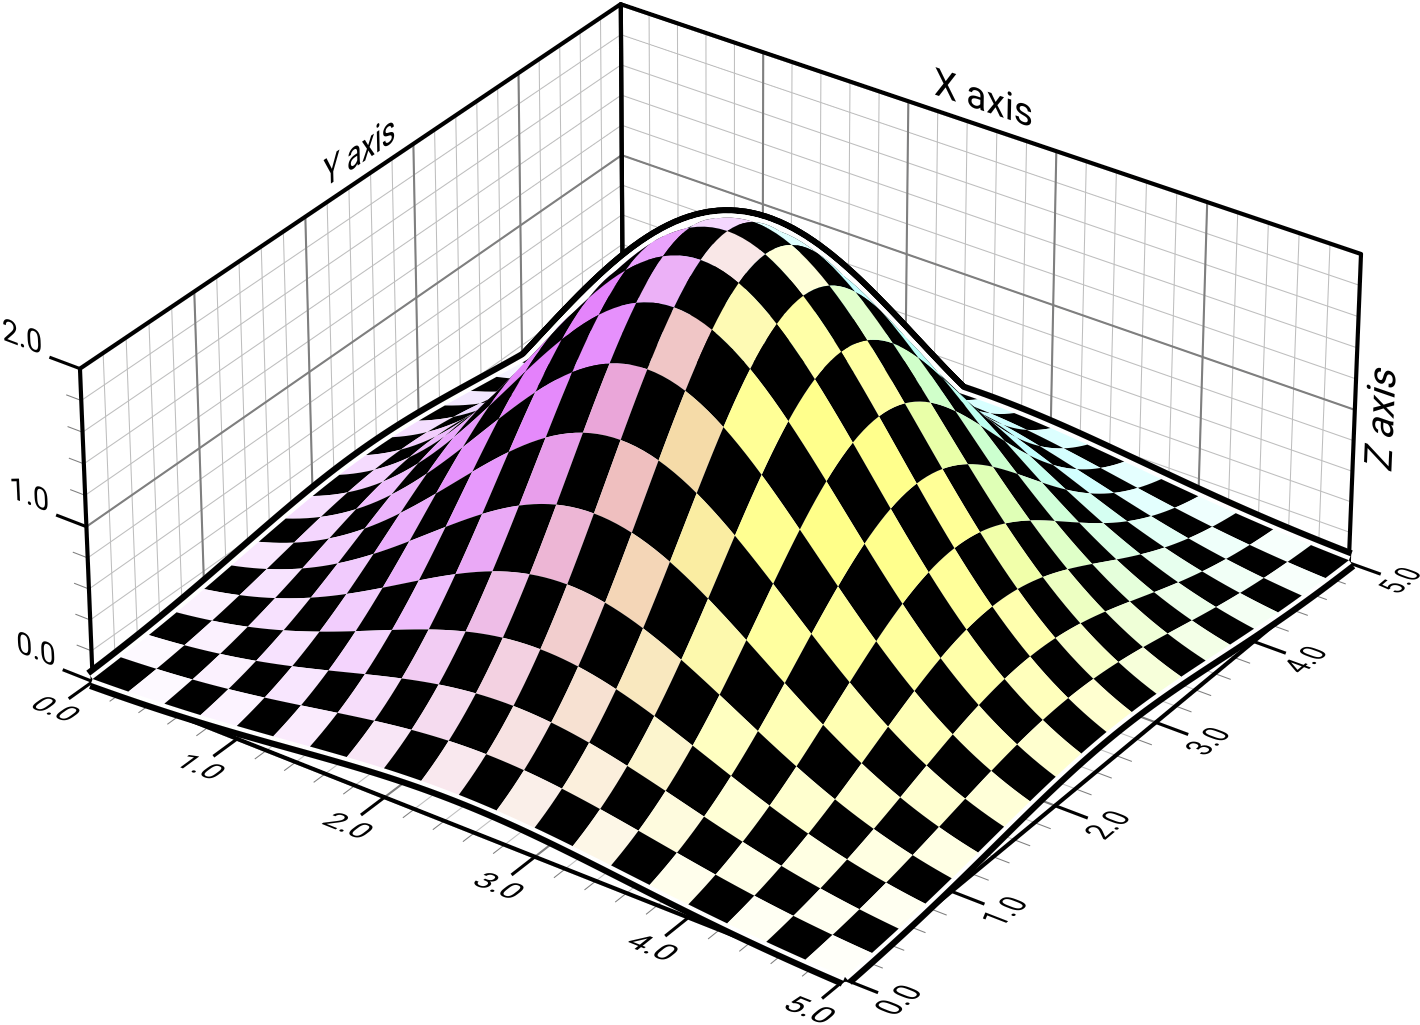
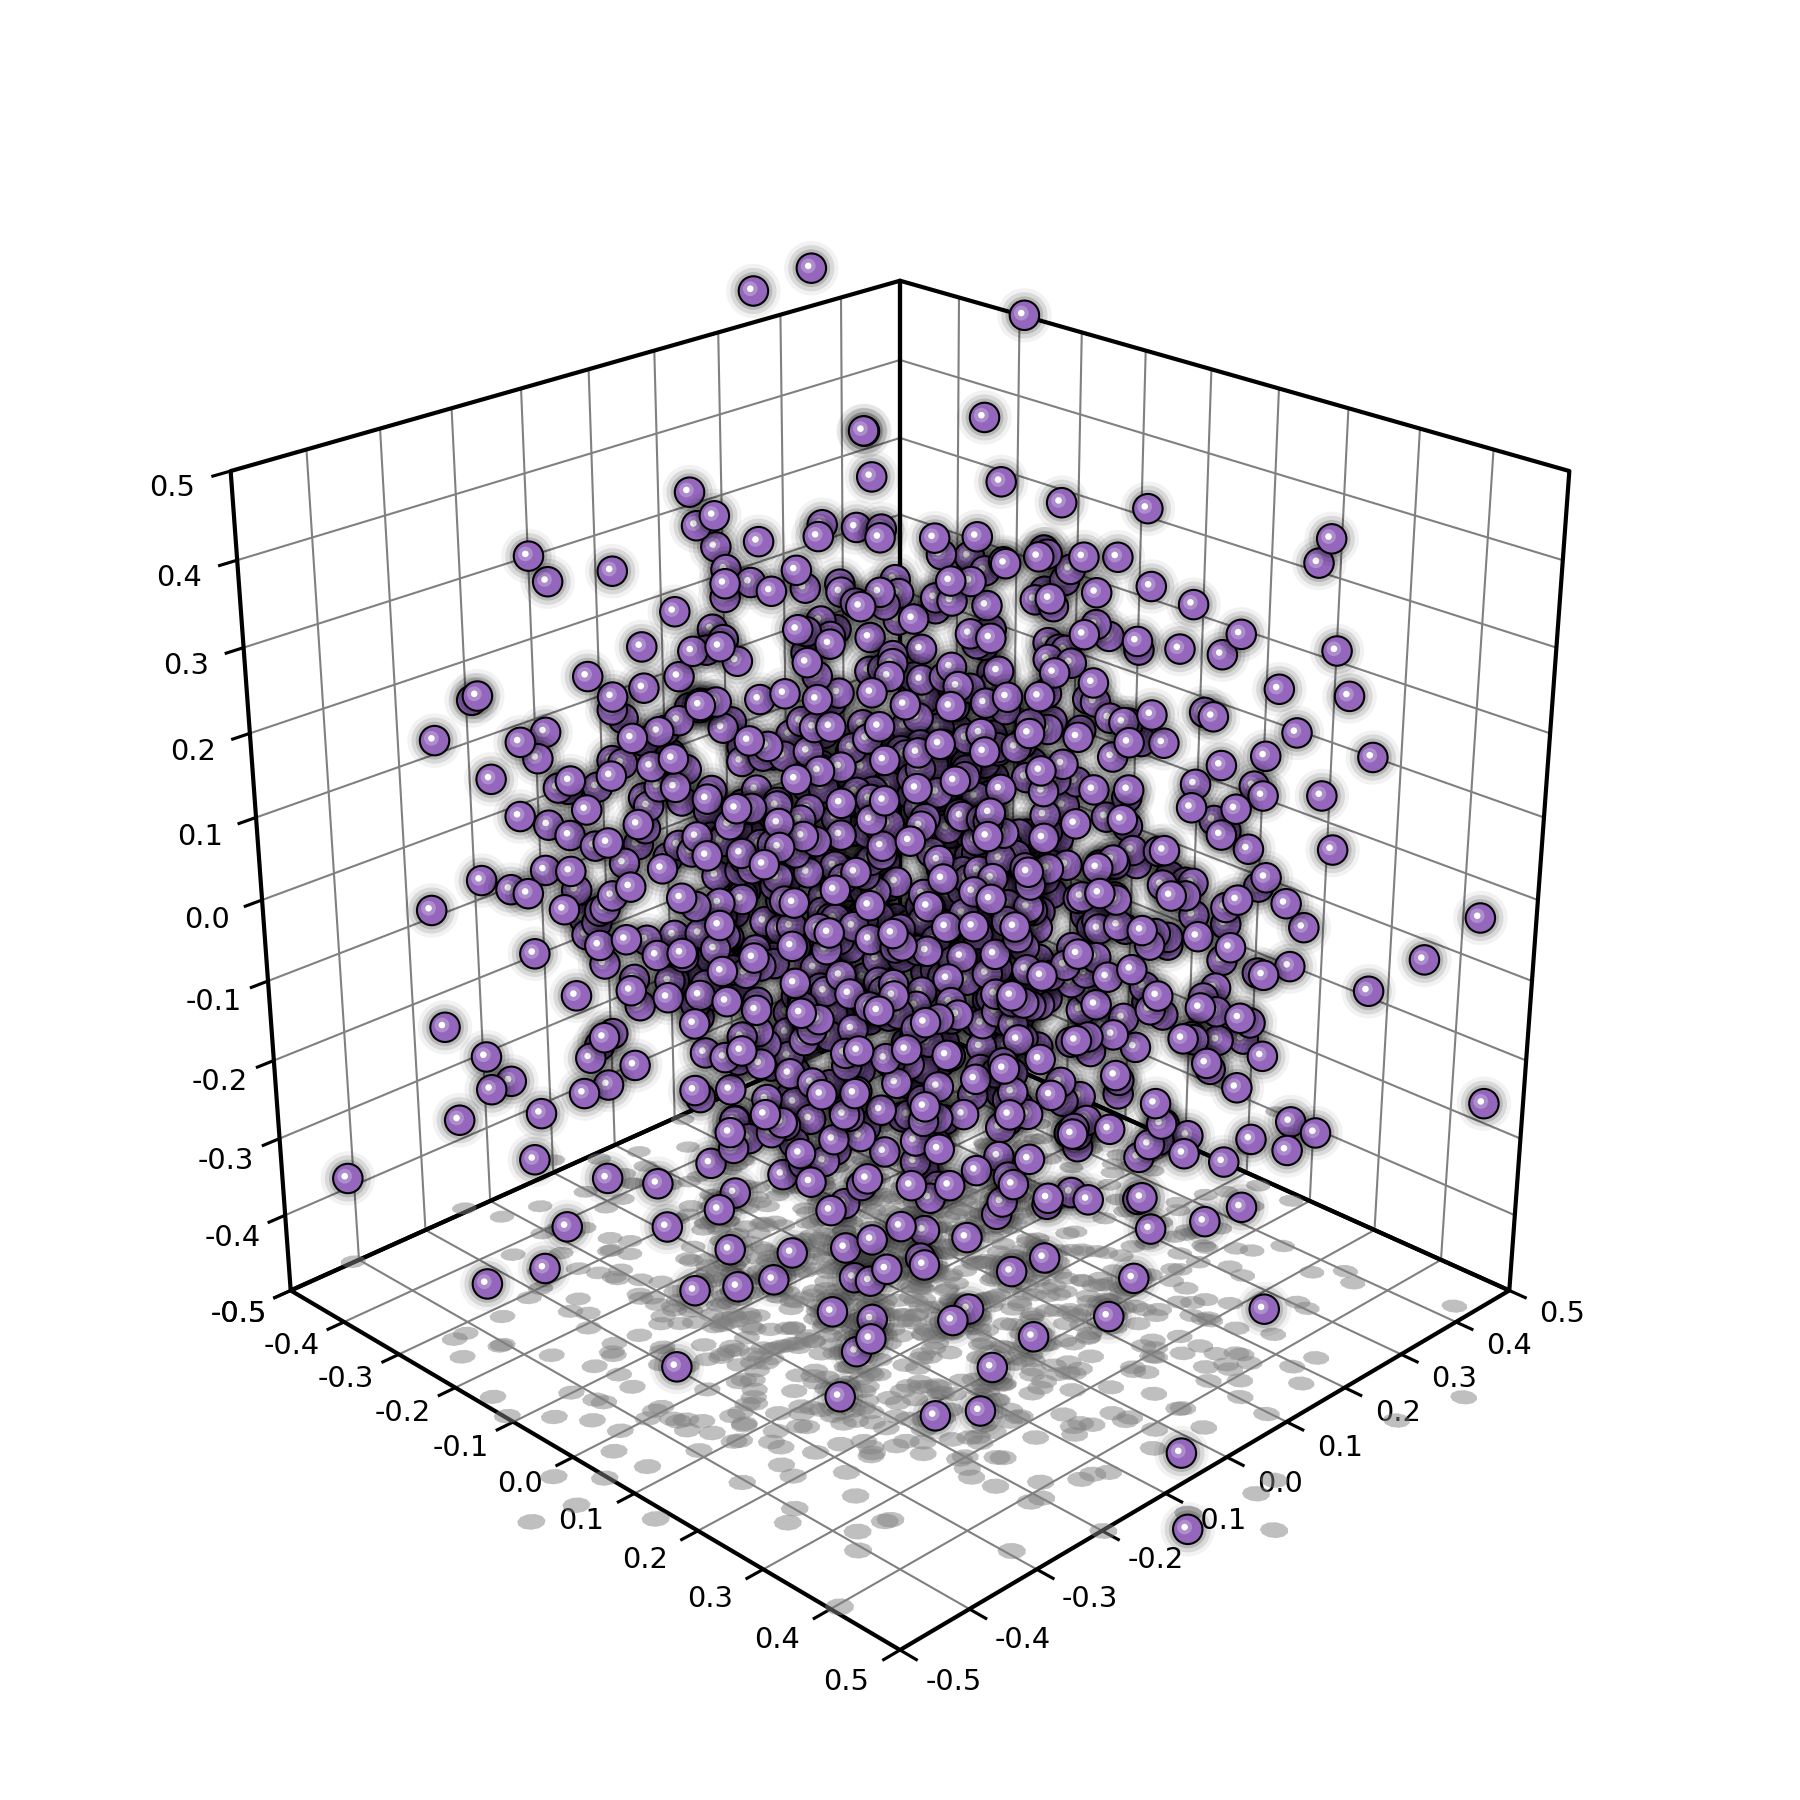
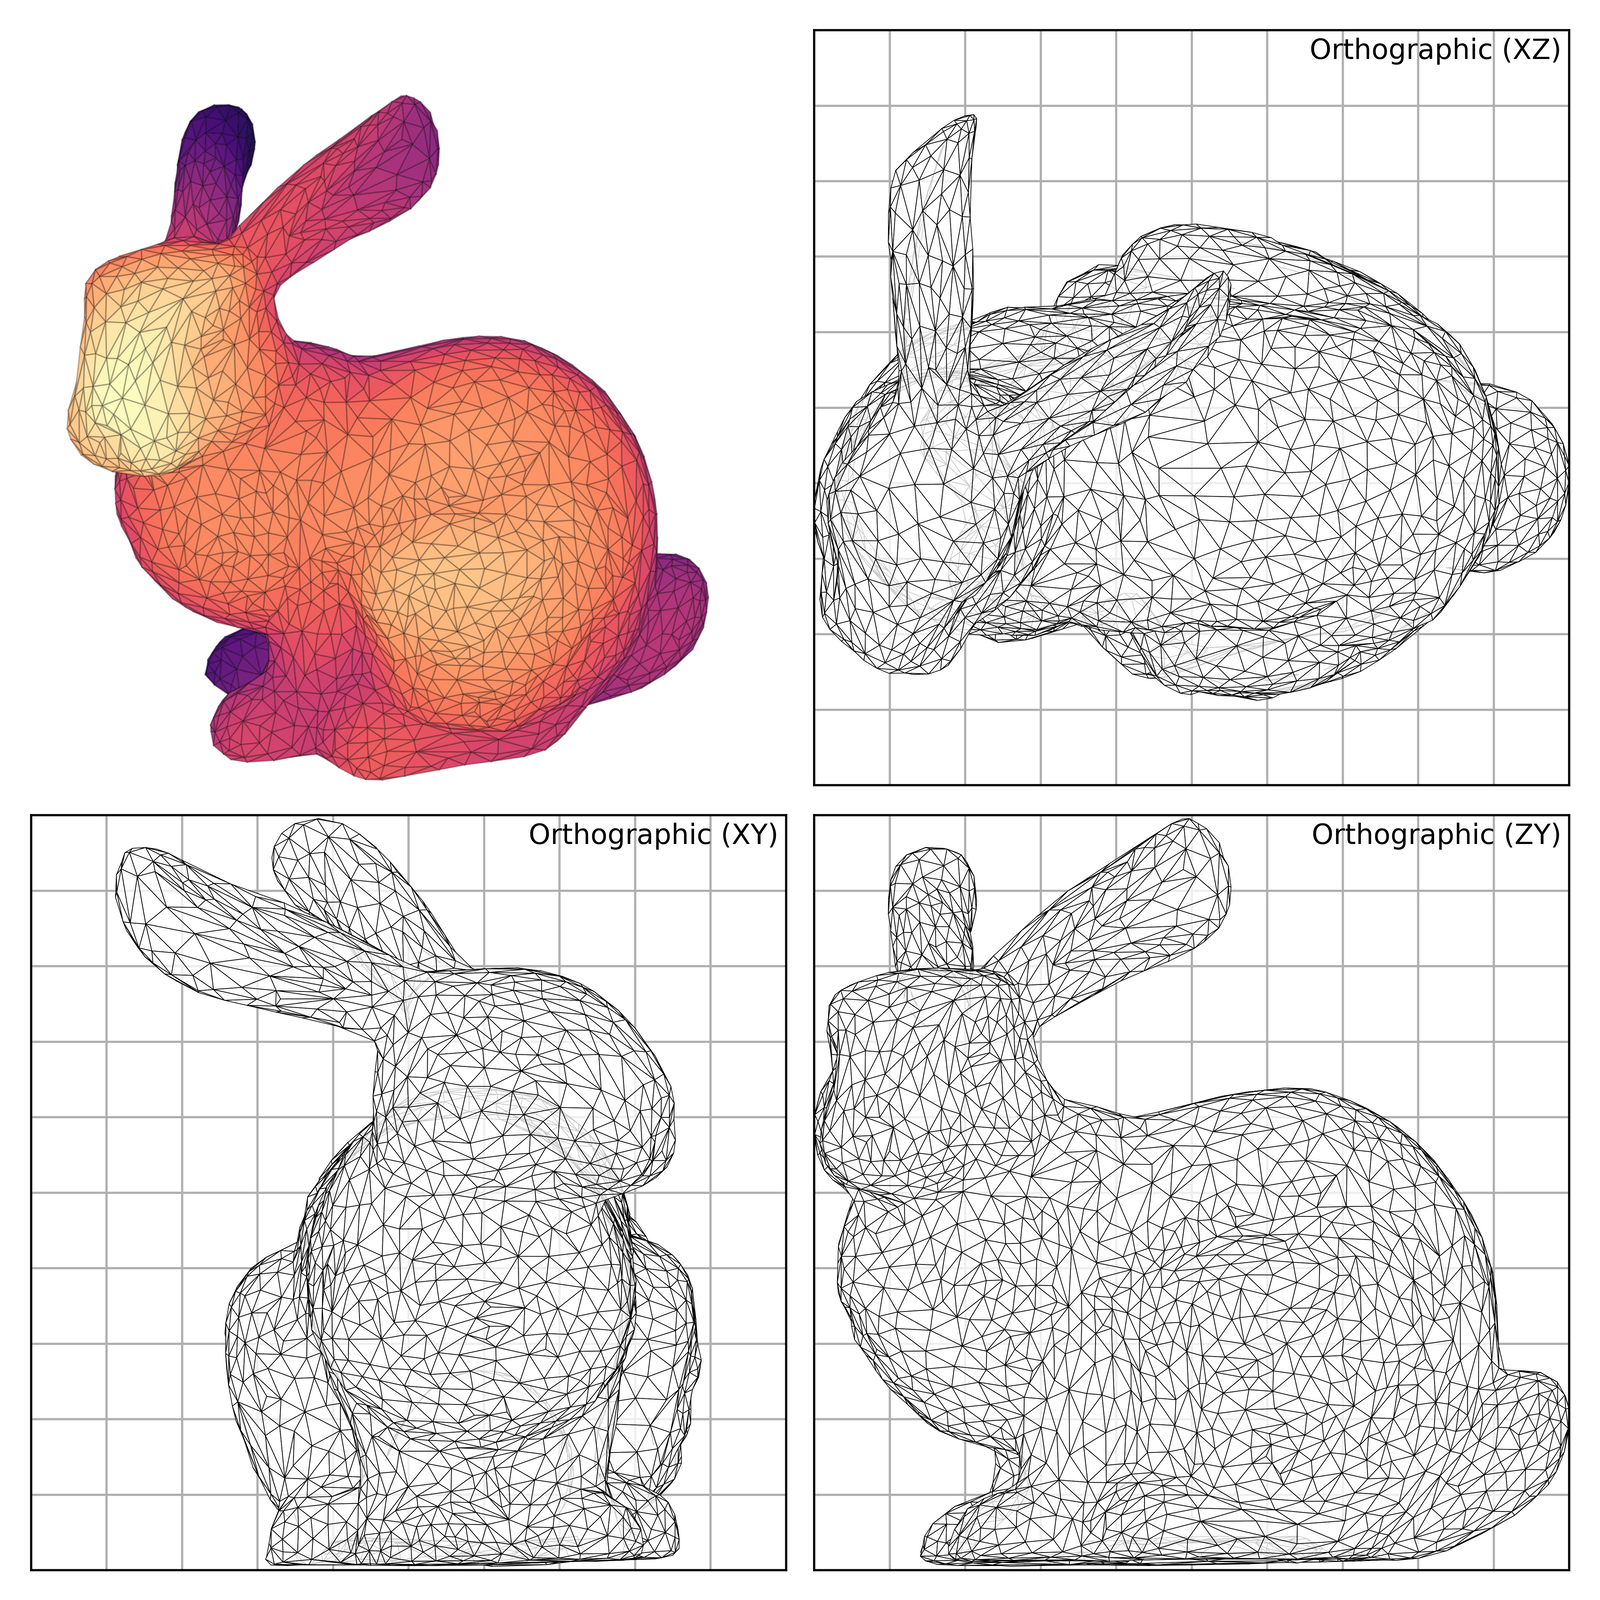
The book is built around the standard Python scientific stack: Python, Matplotlib, and NumPy are the core tools used throughout the examples.Is this only for 2D plots, or does it cover 3D and animation too?It covers more than basic 2D plotting: a dedicated part is devoted to advanced topics including 3D figures, optimization, and animation, plus a final showcase section.
It covers more than basic 2D plotting: a dedicated part is devoted to advanced topics including 3D figures, optimization, and animation, plus a final showcase section.Who is this book written for?It's aimed at scientists and researchers who want to produce publication-quality figures with Matplotlib, from beginners learning the basics to those wanting advanced techniques.
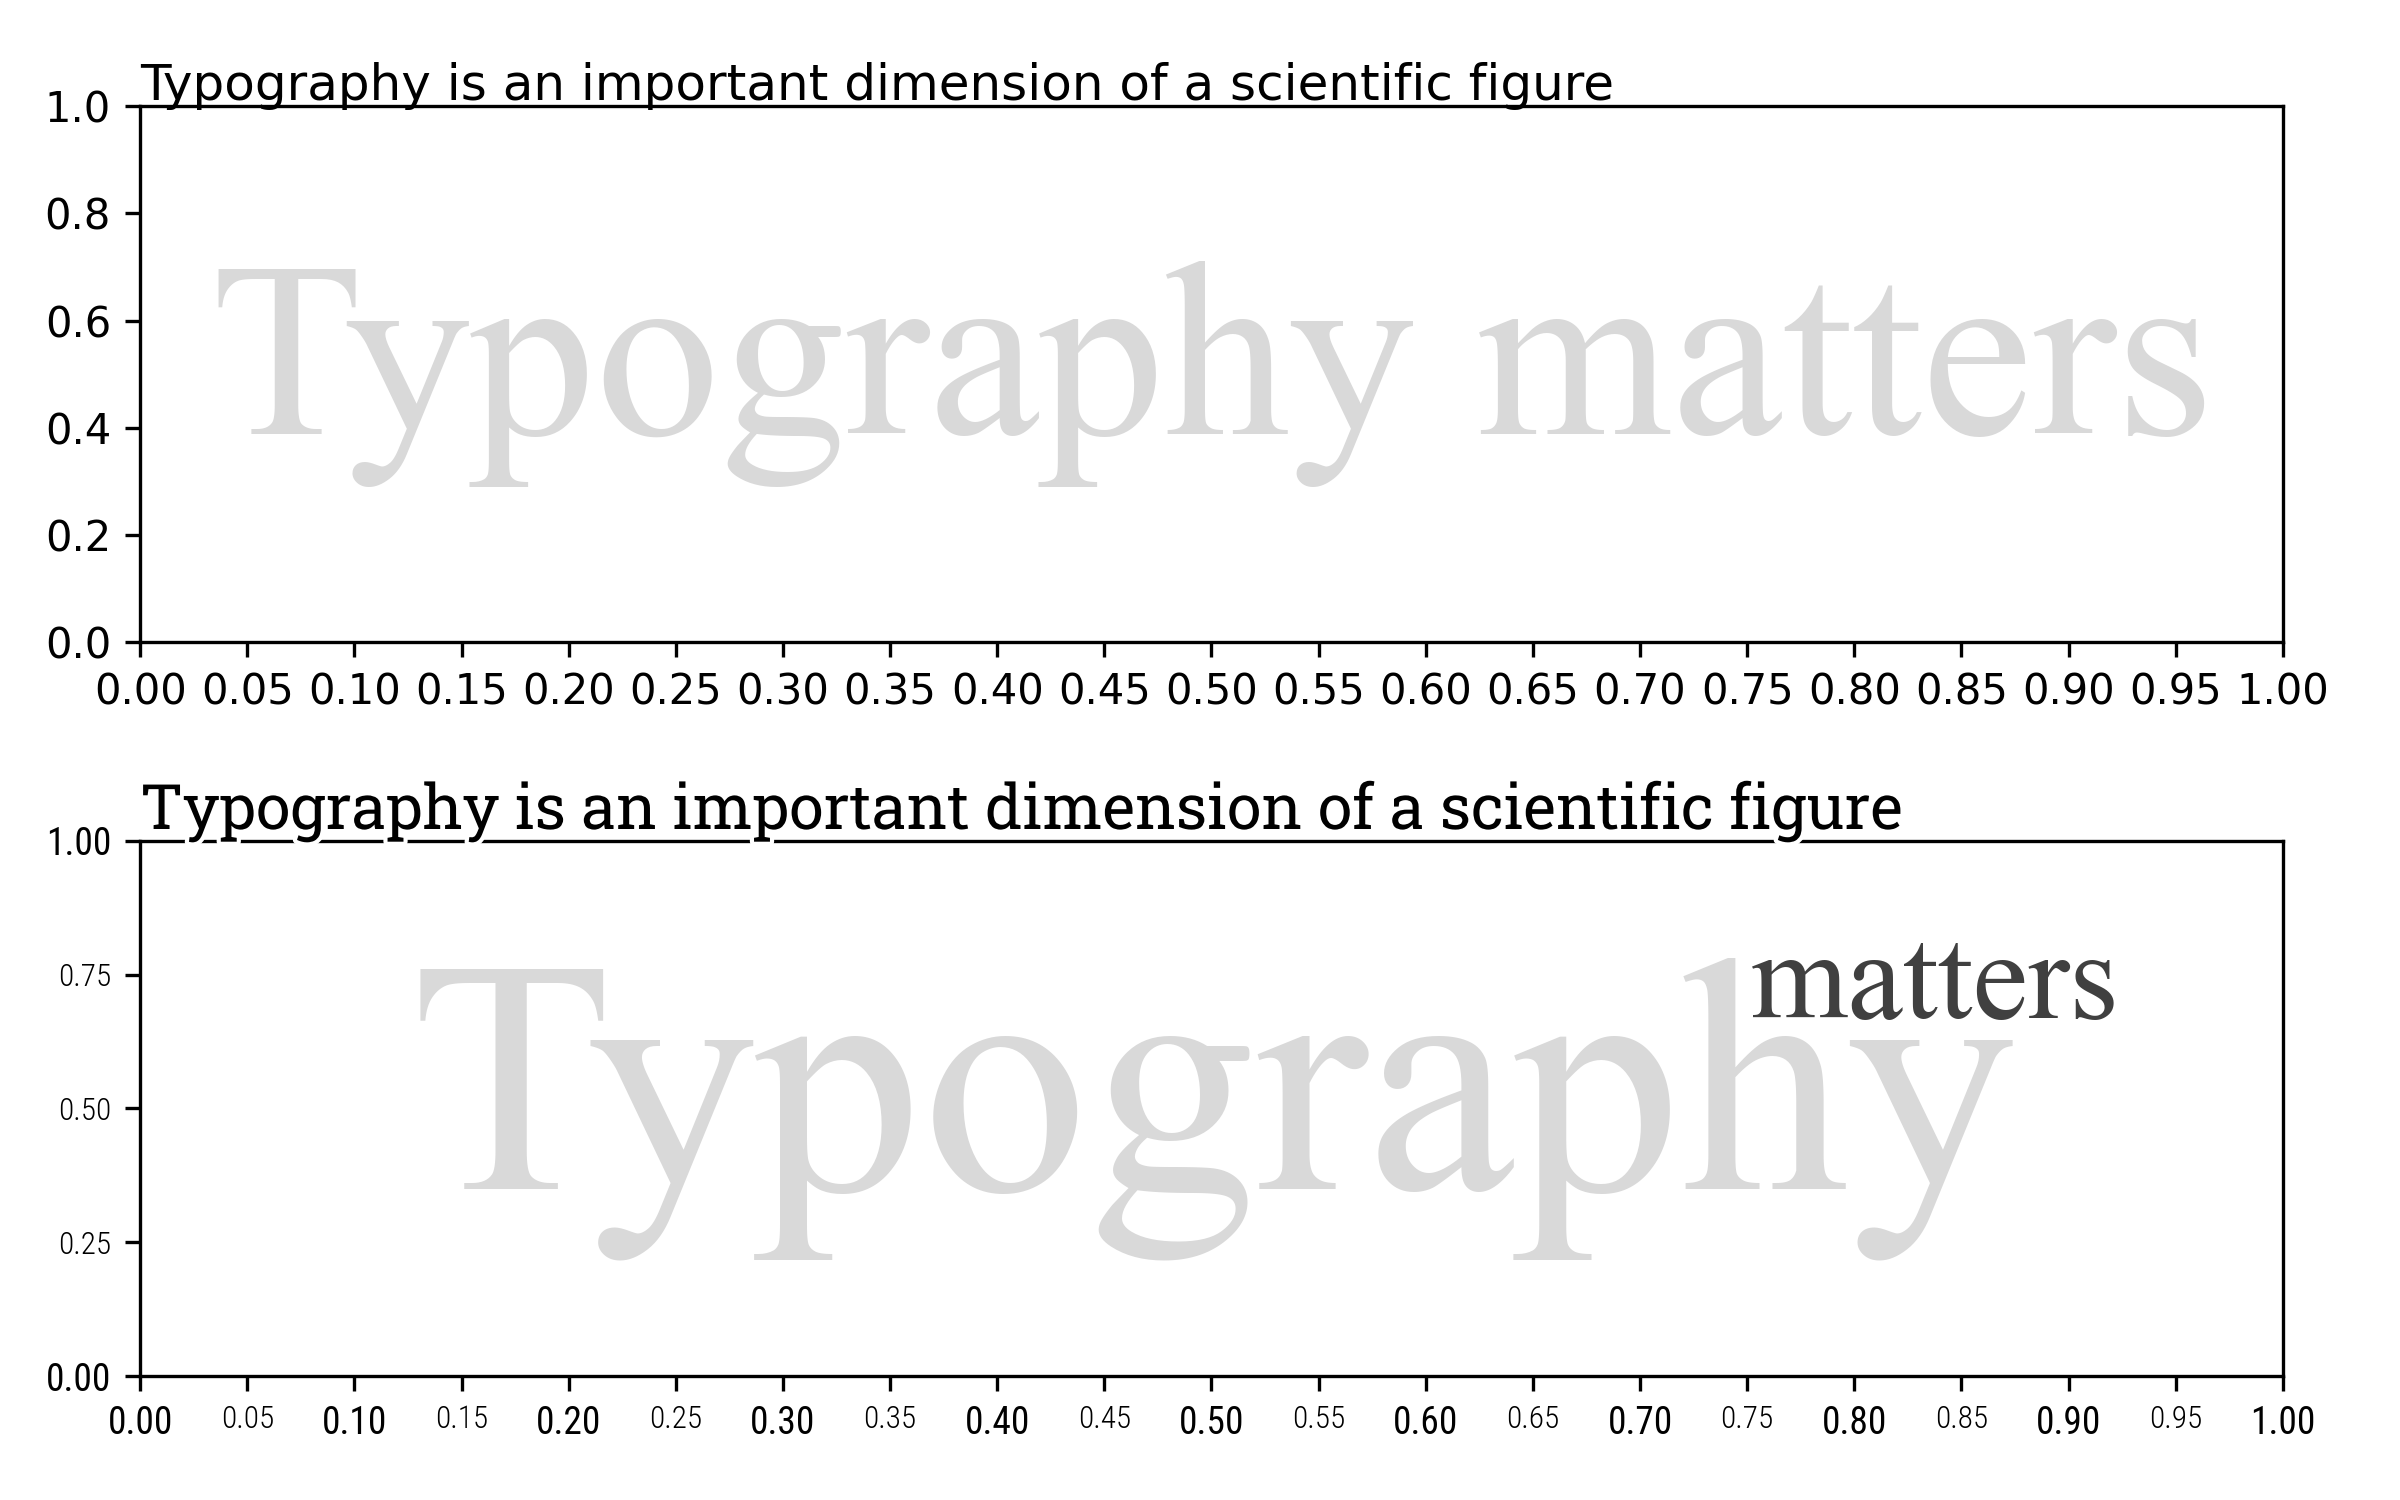
It's aimed at scientists and researchers who want to produce publication-quality figures with Matplotlib, from beginners learning the basics to those wanting advanced techniques.How is the book organized?It has four parts: fundamental Matplotlib principles (figure anatomy, coordinate systems, typography, color), actual figure design (defaults, styling, layout, plot types, ornaments), advanced concepts (3D, optimization, animation), and a final showcase gallery.
It has four parts: fundamental Matplotlib principles (figure anatomy, coordinate systems, typography, color), actual figure design (defaults, styling, layout, plot types, ornaments), advanced concepts (3D, optimization, animation), and a final showcase gallery.Why does the author highlight Matplotlib specifically?The author notes that among the huge Python visualization landscape, Matplotlib stands out for being versatile, powerful, offering an intuitive object-oriented interface that lets you tweak any part of a figure, and suitable for both scientific and non-scientific graphics.
The author notes that among the huge Python visualization landscape, Matplotlib stands out for being versatile, powerful, offering an intuitive object-oriented interface that lets you tweak any part of a figure, and suitable for both scientific and non-scientific graphics.Can I support the author instead of just reading it free?Yes, you can buy a printed edition on Amazon for $49, or sponsor the author's future Python/Emacs work via PayPal, GitHub, or Liberapay.
Yes, you can buy a printed edition on Amazon for $49, or sponsor the author's future Python/Emacs work via PayPal, GitHub, or Liberapay.What are similar projects?pydata-book, word_cloud, data-science-ipython-notebooks, matplotlib, 100-Days-Of-ML-Code, mlcourse.ai, abu, PythonDataScienceHandbook
pydata-book, word_cloud, data-science-ipython-notebooks, matplotlib, 100-Days-Of-ML-Code, mlcourse.ai, abu, PythonDataScienceHandbookWhich topics is it in?dataviz, plotting, matplotlib, numpy, visualization, data-visualization, data-science, book, learning, tutorial, research, education
dataviz, plotting, matplotlib, numpy, visualization, data-visualization, data-science, book, learning, tutorial, research, education