
Scalene: a Python CPU+GPU+memory profiler with AI-powered optimization proposals
by Emery Berger, Sam Stern, and Juan Altmayer Pizzorno.
 Scalene community Slack










(tweet from Ian Ozsvald, author of High Performance Python)

Python Profiler Links to AI to Improve Code Scalene identifies inefficiencies and asks GPT-4 for suggestions, IEEE Spectrum
Episode 172: Measuring Multiple Facets of Python Performance With Scalene, The Real Python podcast
Scalene web-based user interface: https://scalene-gui.github.io/scalene-gui/
About Scalene
Scalene is a high-performance CPU, GPU and memory profiler for
Python that does a number of things that other Python profilers do not
and cannot do. It runs orders of magnitude faster than many other
profilers while delivering far more detailed information. It is also
the first profiler ever to incorporate AI-powered proposed
optimizations.
AI-powered optimization suggestions
Note
For optimization suggestions, Scalene supports a variety of AI providers, including Amazon Bedrock, Microsoft Azure, OpenAI, and local models via Ollama. To enable AI-powered optimization suggestions from AI providers, you need to select a provider and, if needed, enter your credentials, in the box under "AI Optimization Options".

Once you've entered your key and any other needed data, click on the lightning bolt (⚡) beside any line or the explosion (💥) for an entire region of code to generate a proposed optimization. Click on a proposed optimization to copy it to the clipboard.
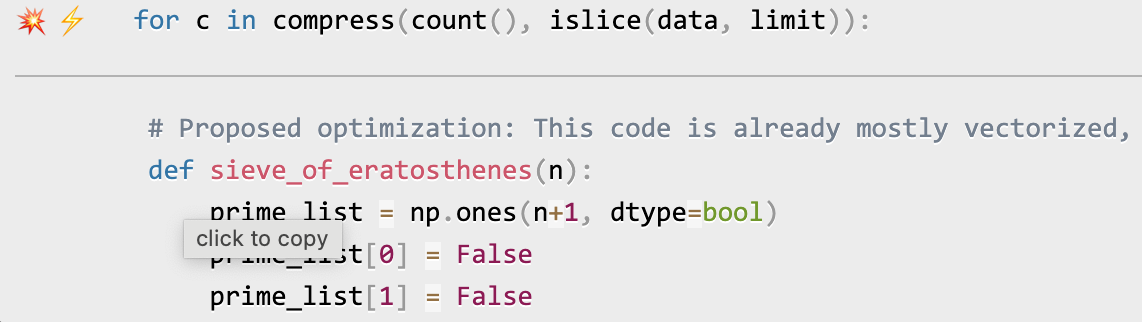
You can click as many times as you like on the lightning bolt or explosion, and it will generate different suggested optimizations. Your mileage may vary, but in some cases, the suggestions are quite impressive (e.g., order-of-magnitude improvements).
Quick Start
Installing Scalene:
python3 -m pip install -U scalene
or
conda install -c conda-forge scalene
Using Scalene:
After installing Scalene, you can use Scalene at the command line, or as a Visual Studio Code extension.
Using the Scalene VS Code Extension:
First, install the Scalene extension from the VS Code Marketplace or by searching for it within VS Code by typing Command-Shift-X (Mac) or Ctrl-Shift-X (Windows). Once that's installed, click Command-Shift-P or Ctrl-Shift-P to open the Command Palette. Then select "Scalene: AI-powered profiling..." (you can start typing Scalene and it will pop up if it's installed). Run that and, assuming your code runs for at least a second, a Scalene profile will appear in a webview.

Commonly used command-line options:
Scalene uses a verb-based command structure with two main commands: run (to profile) and view (to display results).
# Profile a program (saves to scalene-profile.json)
scalene run your_prog.py
python3 -m scalene run your_prog.py              # equivalent alternative

# View a profile
scalene view                                     # open profile in browser
scalene view --cli                               # view in terminal
scalene view --html                              # save to scalene-profile.html
scalene view --standalone                        # save as self-contained HTML

# Common profiling options
scalene run --cpu-only your_prog.py              # only profile CPU (faster)
scalene run -o results.json your_prog.py         # custom output filename
scalene run -c config.yaml your_prog.py          # load options from config file

# Pass arguments to your program (use --- separator)
scalene run your_prog.py --- --arg1 --arg2

# Get help
scalene --help                                   # main help
scalene run --help                               # profiling options
scalene run --help-advanced                      # advanced profiling options
scalene view --help                              # viewing options
Using a YAML configuration file:
You can store Scalene options in a YAML configuration file and load them with -c or --config:
scalene run -c scalene.yaml your_prog.py
Example scalene.yaml:
# Output options
outfile: my-profile.json

# Profiling mode (use only one)
cpu-only: true              # CPU profiling only (faster)
# gpu: true                 # Include GPU profiling
# memory: true              # Include memory profiling

# Filter what gets profiled
profile-only: "mypackage,mymodule"    # Only profile these paths
profile-exclude: "tests,venv"          # Exclude these paths
profile-all: false                     # Profile all code, not just target

# Performance tuning
cpu-percent-threshold: 1     # Min CPU% to report (default: 1)
cpu-sampling-rate: 0.01      # Sampling interval in seconds
malloc-threshold: 100        # Min allocations to report

# Other options
use-virtual-time: false      # Measure CPU time only (not I/O)
stacks: true                 # Collect stack traces (default: true)
memory-leak-detector: true   # Detect likely memory leaks
Command-line arguments override config file settings.
Using Scalene programmatically in your code:
Invoke using scalene as above and then:
from scalene import scalene_profiler

# Turn profiling on
scalene_profiler.start()

# your code

# Turn profiling off
scalene_profiler.stop()
from scalene.scalene_profiler import enable_profiling

with enable_profiling():
    # do something
Using Scalene to profile only specific functions via @profile:
Just preface any functions you want to profile with the @profile decorator and run it with Scalene:
# do not import profile!

@profile
def slow_function():
    import time
    time.sleep(3)
Web-based GUI
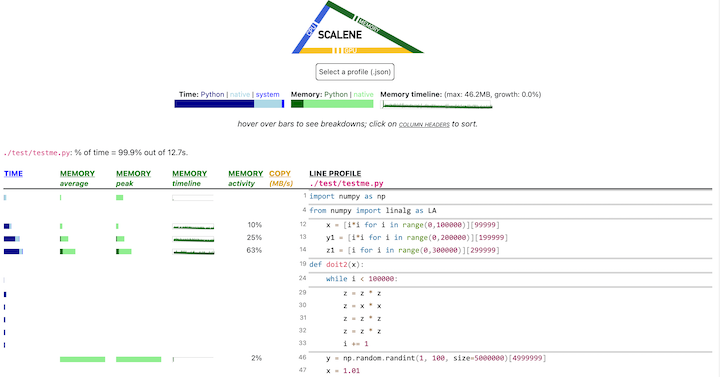
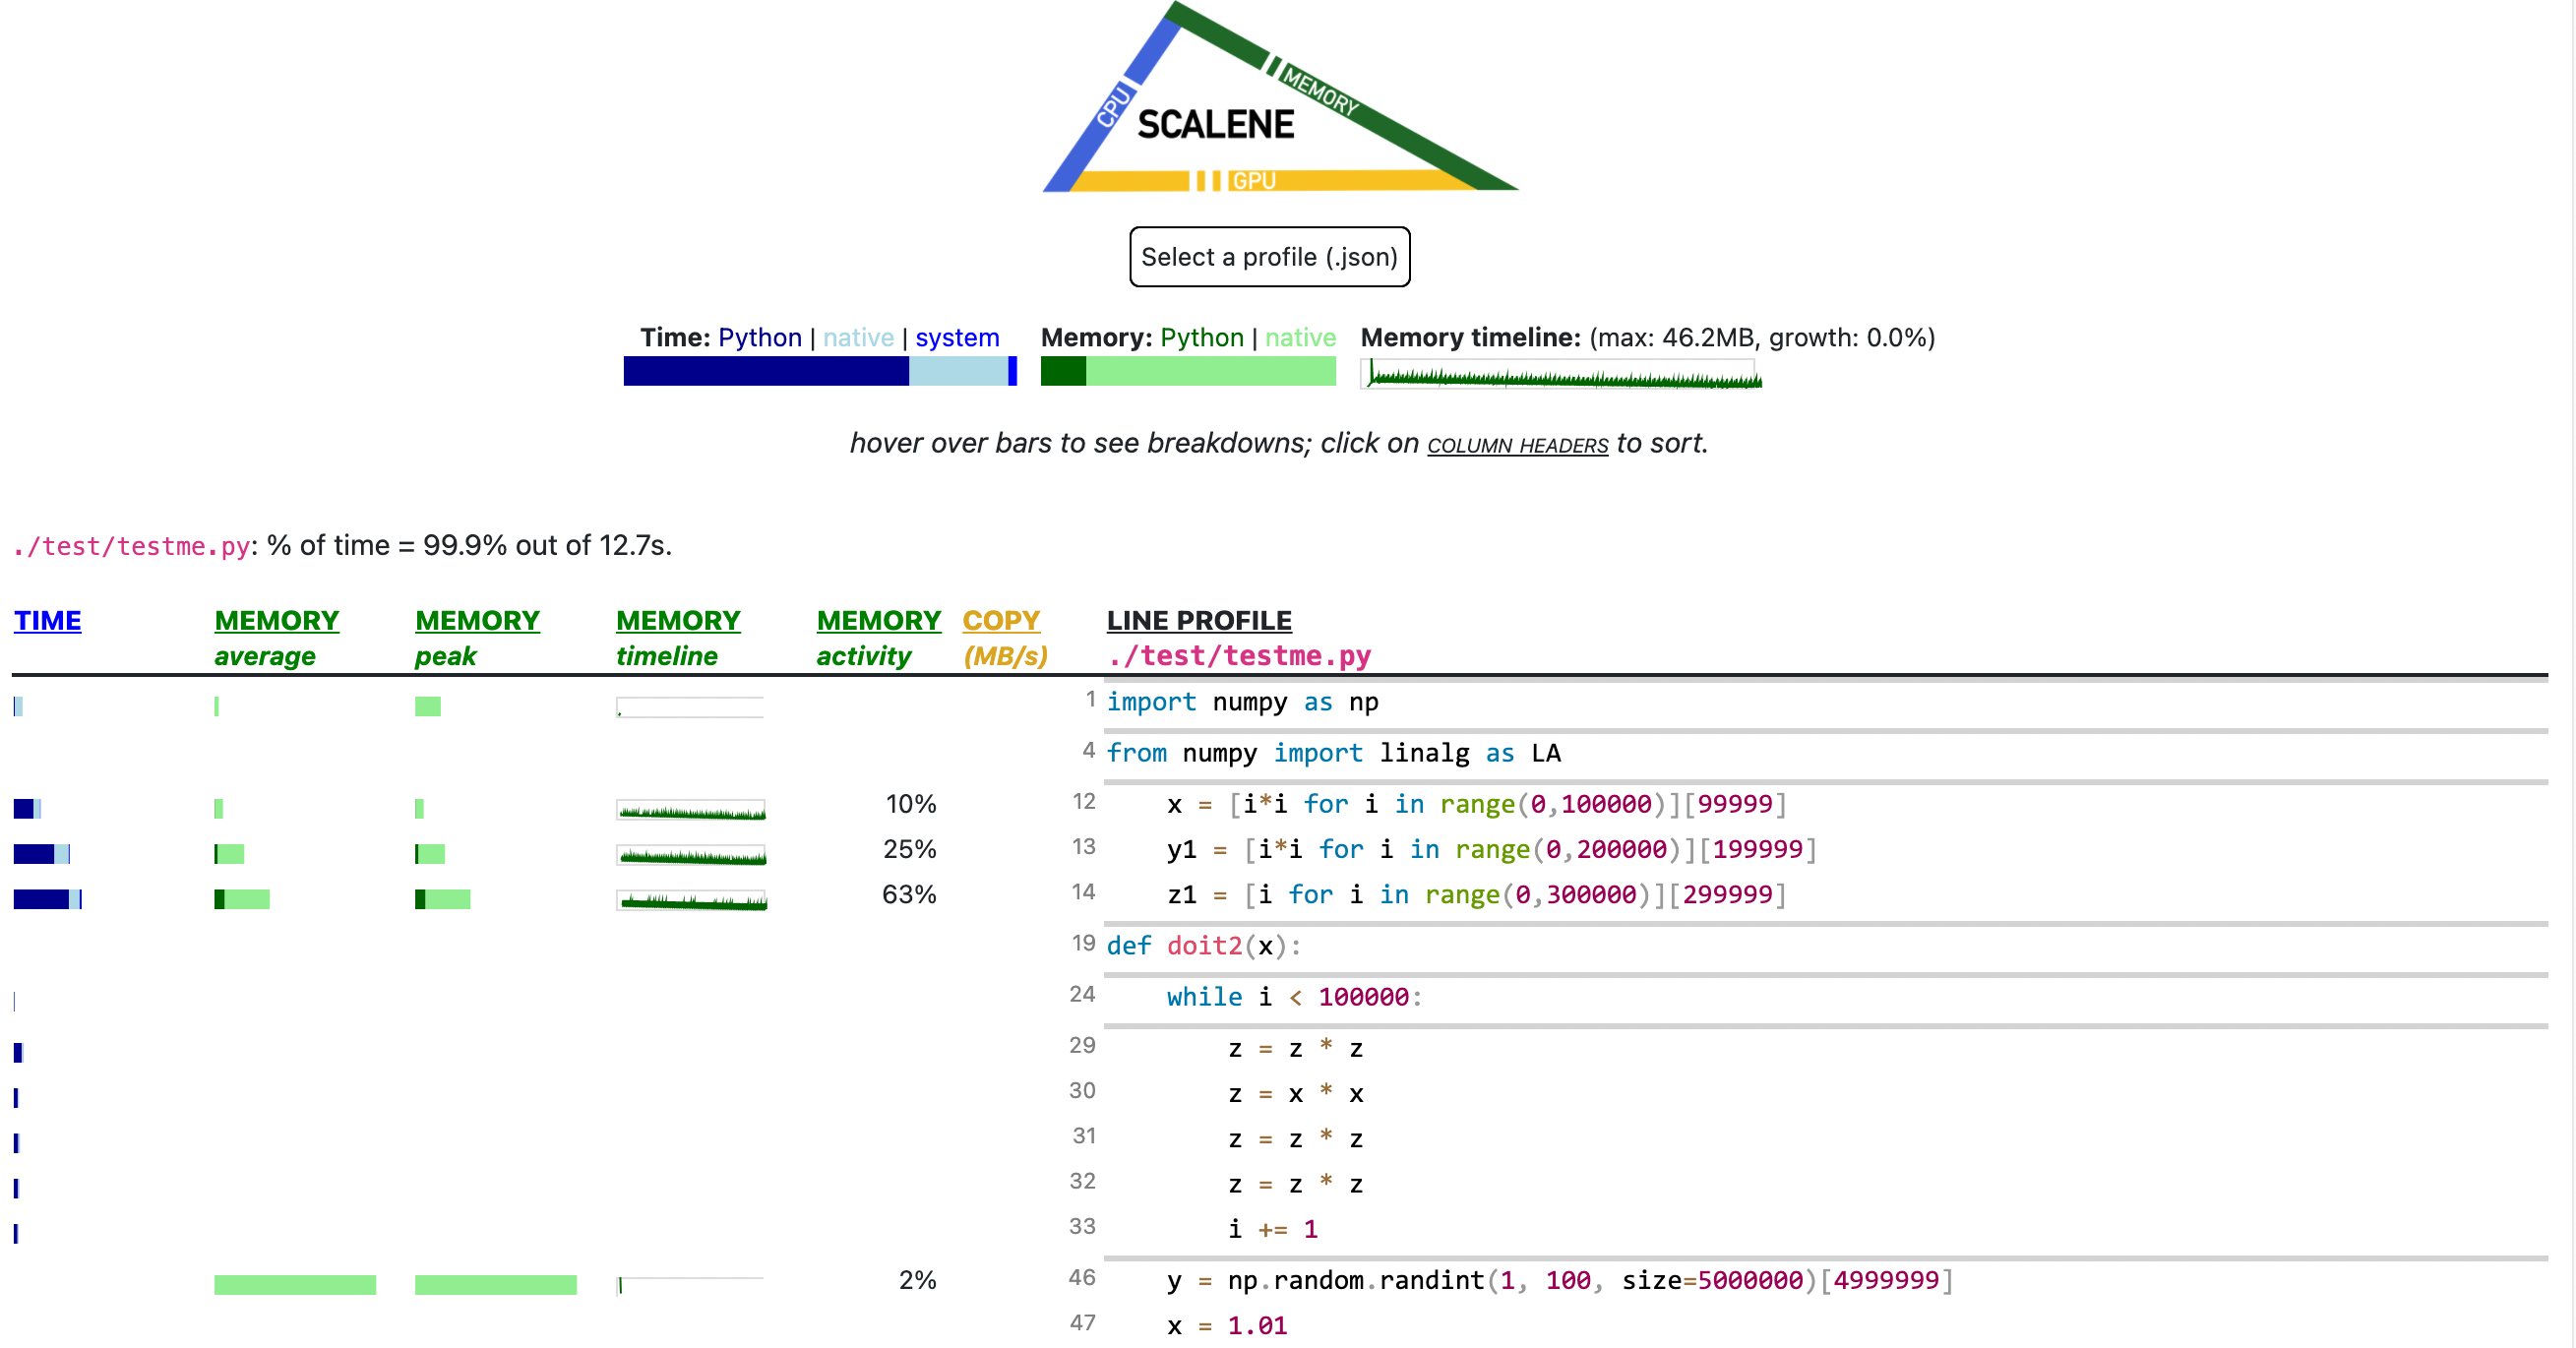
Scalene has both a CLI and a web-based GUI (demo here).
By default, once Scalene has profiled your program, it will open a
tab in a web browser with an interactive user interface (all processing is done
locally). Hover over bars to see breakdowns of CPU and memory
consumption, and click on underlined column headers to sort the
columns. The GUI works fully offline with no internet connection required.
Use scalene view --standalone to generate a completely self-contained HTML file with all assets embedded, perfect for sharing or archiving.
Scalene Overview
Scalene talk (PyCon US 2021)
This talk presented at PyCon 2021 walks through Scalene's advantages and how to use it to debug the performance of an application (and provides some technical details on its internals). We highly recommend watching this video!
Fast and Accurate
Scalene is fast. It uses sampling instead of instrumentation or relying on Python's tracing facilities. Its overhead is typically no more than 10-20% (and often less).
Scalene is accurate. We tested CPU profiler accuracy and found that Scalene is among the most accurate profilers, correctly measuring time taken.

- Scalene performs profiling at the line level and per function, pointing to the functions and the specific lines of code responsible for the execution time in your program.
CPU profiling
- Scalene separates out time spent in Python from time in native code (including libraries). Most Python programmers aren't going to optimize the performance of native code (which is usually either in the Python implementation or external libraries), so this helps developers focus their optimization efforts on the code they can actually improve.
- Scalene highlights hotspots (code accounting for significant percentages of CPU time or memory allocation) in red, making them even easier to spot.
- Scalene also separates out system time, making it easy to find I/O bottlenecks.
GPU profiling
- Scalene reports GPU time (currently limited to NVIDIA-based systems).
Memory profiling
- Scalene profiles memory usage. In addition to tracking CPU usage, Scalene also points to the specific lines of code responsible for memory growth. It accomplishes this via an included specialized memory allocator.
- Scalene separates out the percentage of memory consumed by Python code vs. native code.
- Scalene produces per-line memory profiles.
- Scalene identifies lines with likely memory leaks.
- Scalene profiles copying volume, making it easy to spot inadvertent copying, especially due to crossing Python/library boundaries (e.g., accidentally converting
numpy arrays into Python arrays, and vice versa).
Async profiling
Scalene attributes wall-clock await time to the exact line where the
coroutine is suspended, alongside the mean and peak number of
coroutines waiting concurrently on that line. This makes it easy to spot
serialized I/O (long await, low concurrency) versus genuinely-parallel
fan-out (long await, high concurrency). The await column in the GUI
draws a clockwise pie wedge per line; bigger wedges mean more time spent
suspended on that await.
Async profiling is on by default; pass --no-async to disable it.
Overhead on non-async code is negligible (one frozenset lookup per
signal, and sys.monitoring callbacks never fire when no coroutines
are running).

Stack views (call stacks, memory flame chart, timeline)
When Scalene is run with --stacks (the default — pass --no-stacks
to disable), it captures stitched Python + native (C/C++) stacks at
every CPU and allocation sample, and presents them three ways in the
GUI:
Call stacks — a flame chart of the top stitched stacks across the
whole run. Python frames are clickable to jump to source. Native
frames are demangled and shown alongside Python frames in the same
picture, so you can see exactly which library call is on the hot path.

Memory stacks — a memory-weighted flame chart where frame width is
proportional to MB allocated along that call path (not sample
count). Useful for finding which call paths are responsible for a
program's memory footprint, especially when allocations come from deep
inside a library.

Timeline — an icicle/time-series view of the same stitched stacks
laid out left-to-right by wall-clock time, with tracks at the top
marking GC, I/O, and GIL activity. Coroutines appear as [await] task_name frames so you can see when each task ran versus waited.

All three views are collapsible and resizable; expand them via the
disclosure triangles at the bottom of the GUI.
Other features
- Scalene can produce reduced profiles (via
--reduced-profile) that only report lines that consume more than 1% of CPU or perform at least 100 allocations.
- Scalene supports
@profile decorators to profile only specific functions.
- When Scalene is profiling a program launched in the background (via
&), you can suspend and resume profiling.
- Scalene supports free-threaded Python (3.13t / 3.14t) with full
CPU + memory profiling.
- Scalene's GUI is fully offline / air-gapped — assets are vendored
and
scalene view --standalone produces a single self-contained HTML
file you can email or archive.
Comparison to Other Profilers
Below is a table comparing the performance and features of various profilers to Scalene.
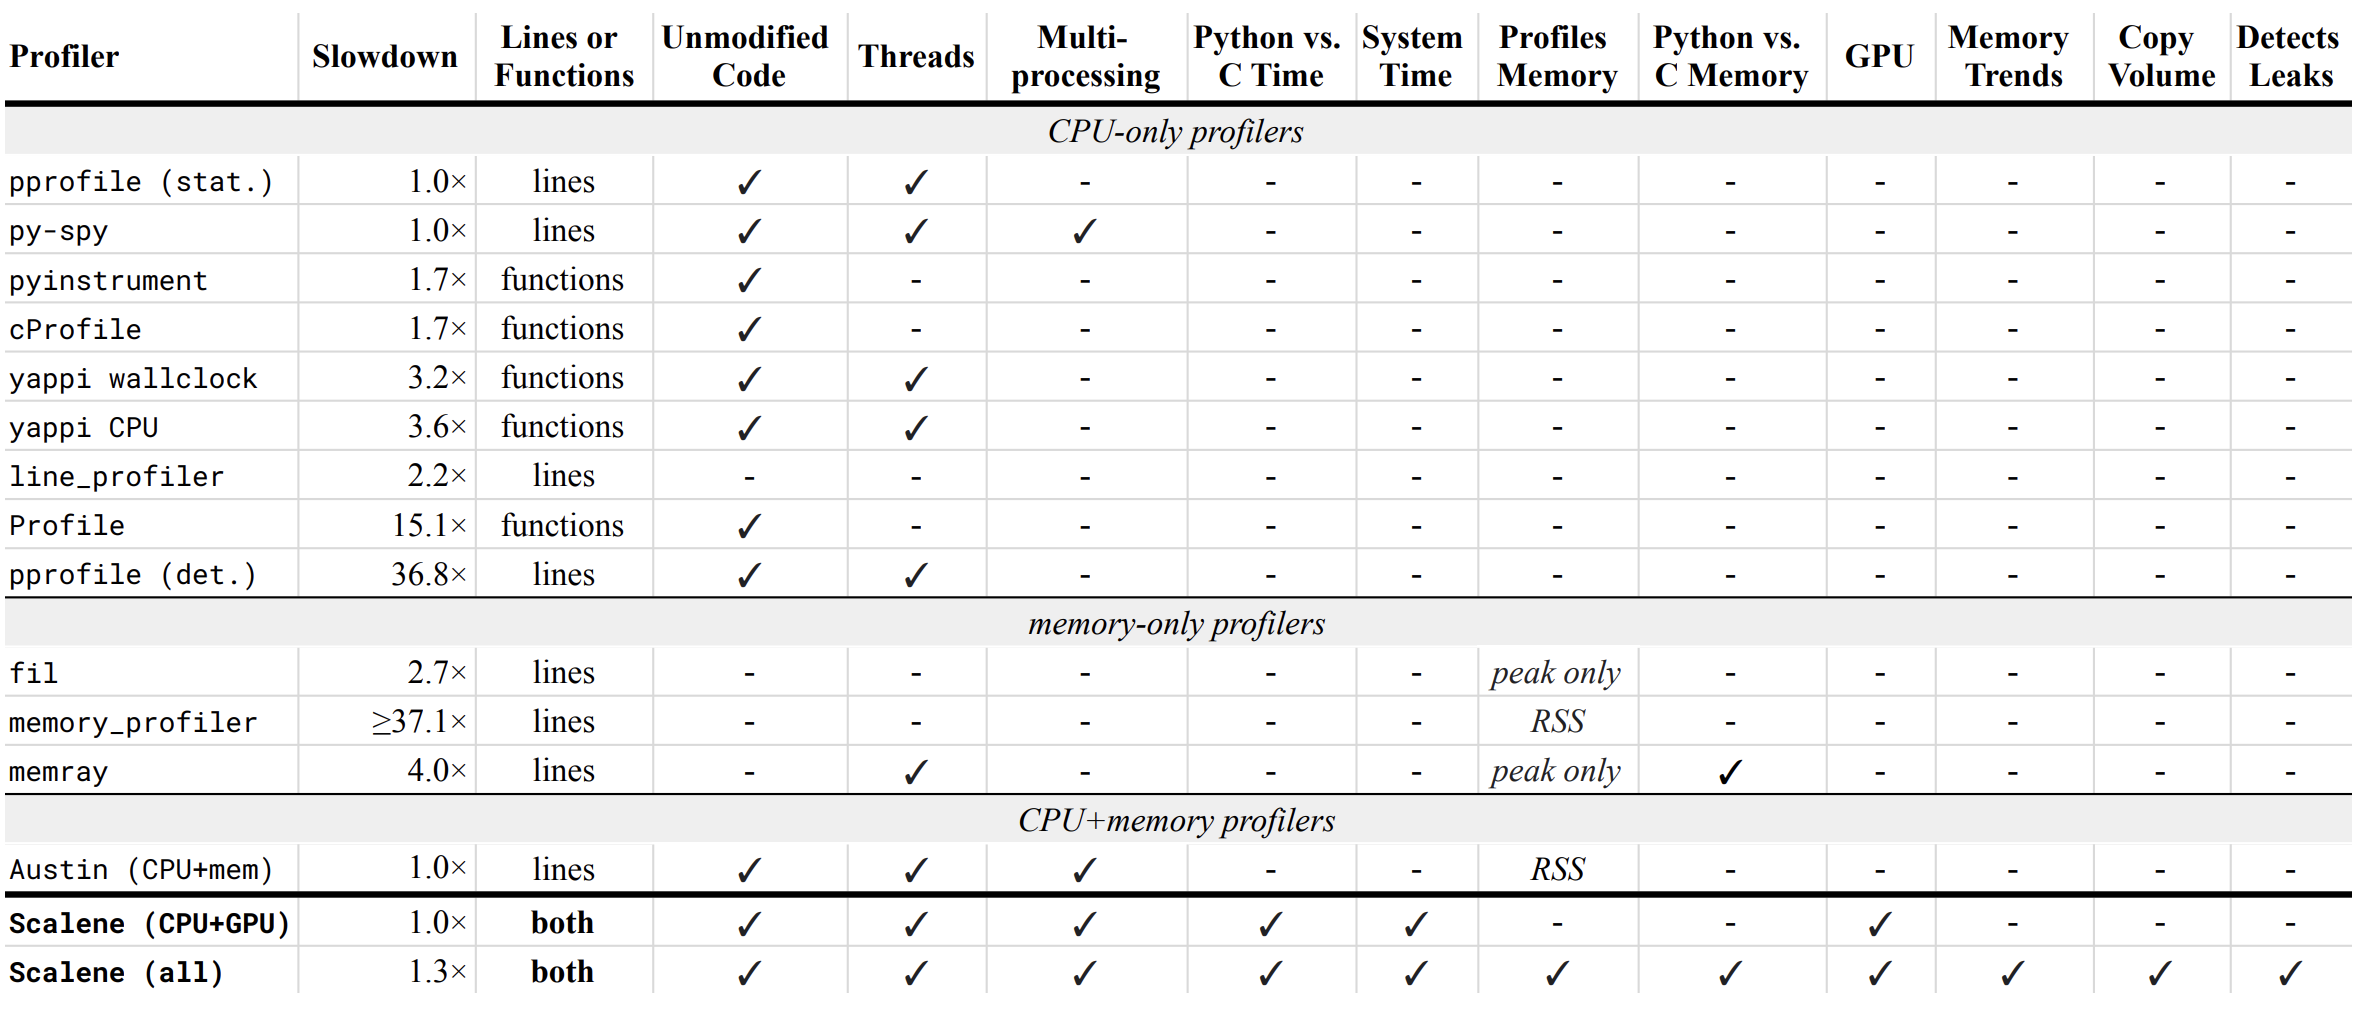
- Slowdown: the slowdown when running a benchmark from the Pyperformance suite. Green means less than 2x overhead. Scalene's overhead is just a 35% slowdown.
Scalene has all of the following features, many of which only Scalene supports:
- Lines or functions: does the profiler report information only for entire functions, or for every line -- Scalene does both.
- Unmodified Code: works on unmodified code.
- Threads: supports Python threads.
- Multiprocessing: supports use of the
multiprocessing library -- Scalene only
- Python vs. C time: breaks out time spent in Python vs. native code (e.g., libraries) -- Scalene only
- System time: breaks out system time (e.g., sleeping or performing I/O) -- Scalene only
- Profiles memory: reports memory consumption per line / function
- GPU: reports time spent on an NVIDIA GPU (if present) -- Scalene only
- Memory trends: reports memory use over time per line / function -- Scalene only
- Copy volume: reports megabytes being copied per second -- Scalene only
- Detects leaks: automatically pinpoints lines responsible for likely memory leaks -- Scalene only
- Async /
await profiling: per-line wall-clock attribution of suspended coroutine time, with mean and peak concurrency -- Scalene only
- Stitched Python + native stacks: flame charts and a wall-clock timeline that combine Python and C/C++ frames in one picture -- Scalene only
Output
If you include the --cli option, Scalene prints annotated source code for the program being profiled
(as text, JSON (--json), or HTML (--html)) and any modules it
uses in the same directory or subdirectories (you can optionally have
it --profile-all and only include files with at least a
--cpu-percent-threshold of time). Here is a snippet from
pystone.py.
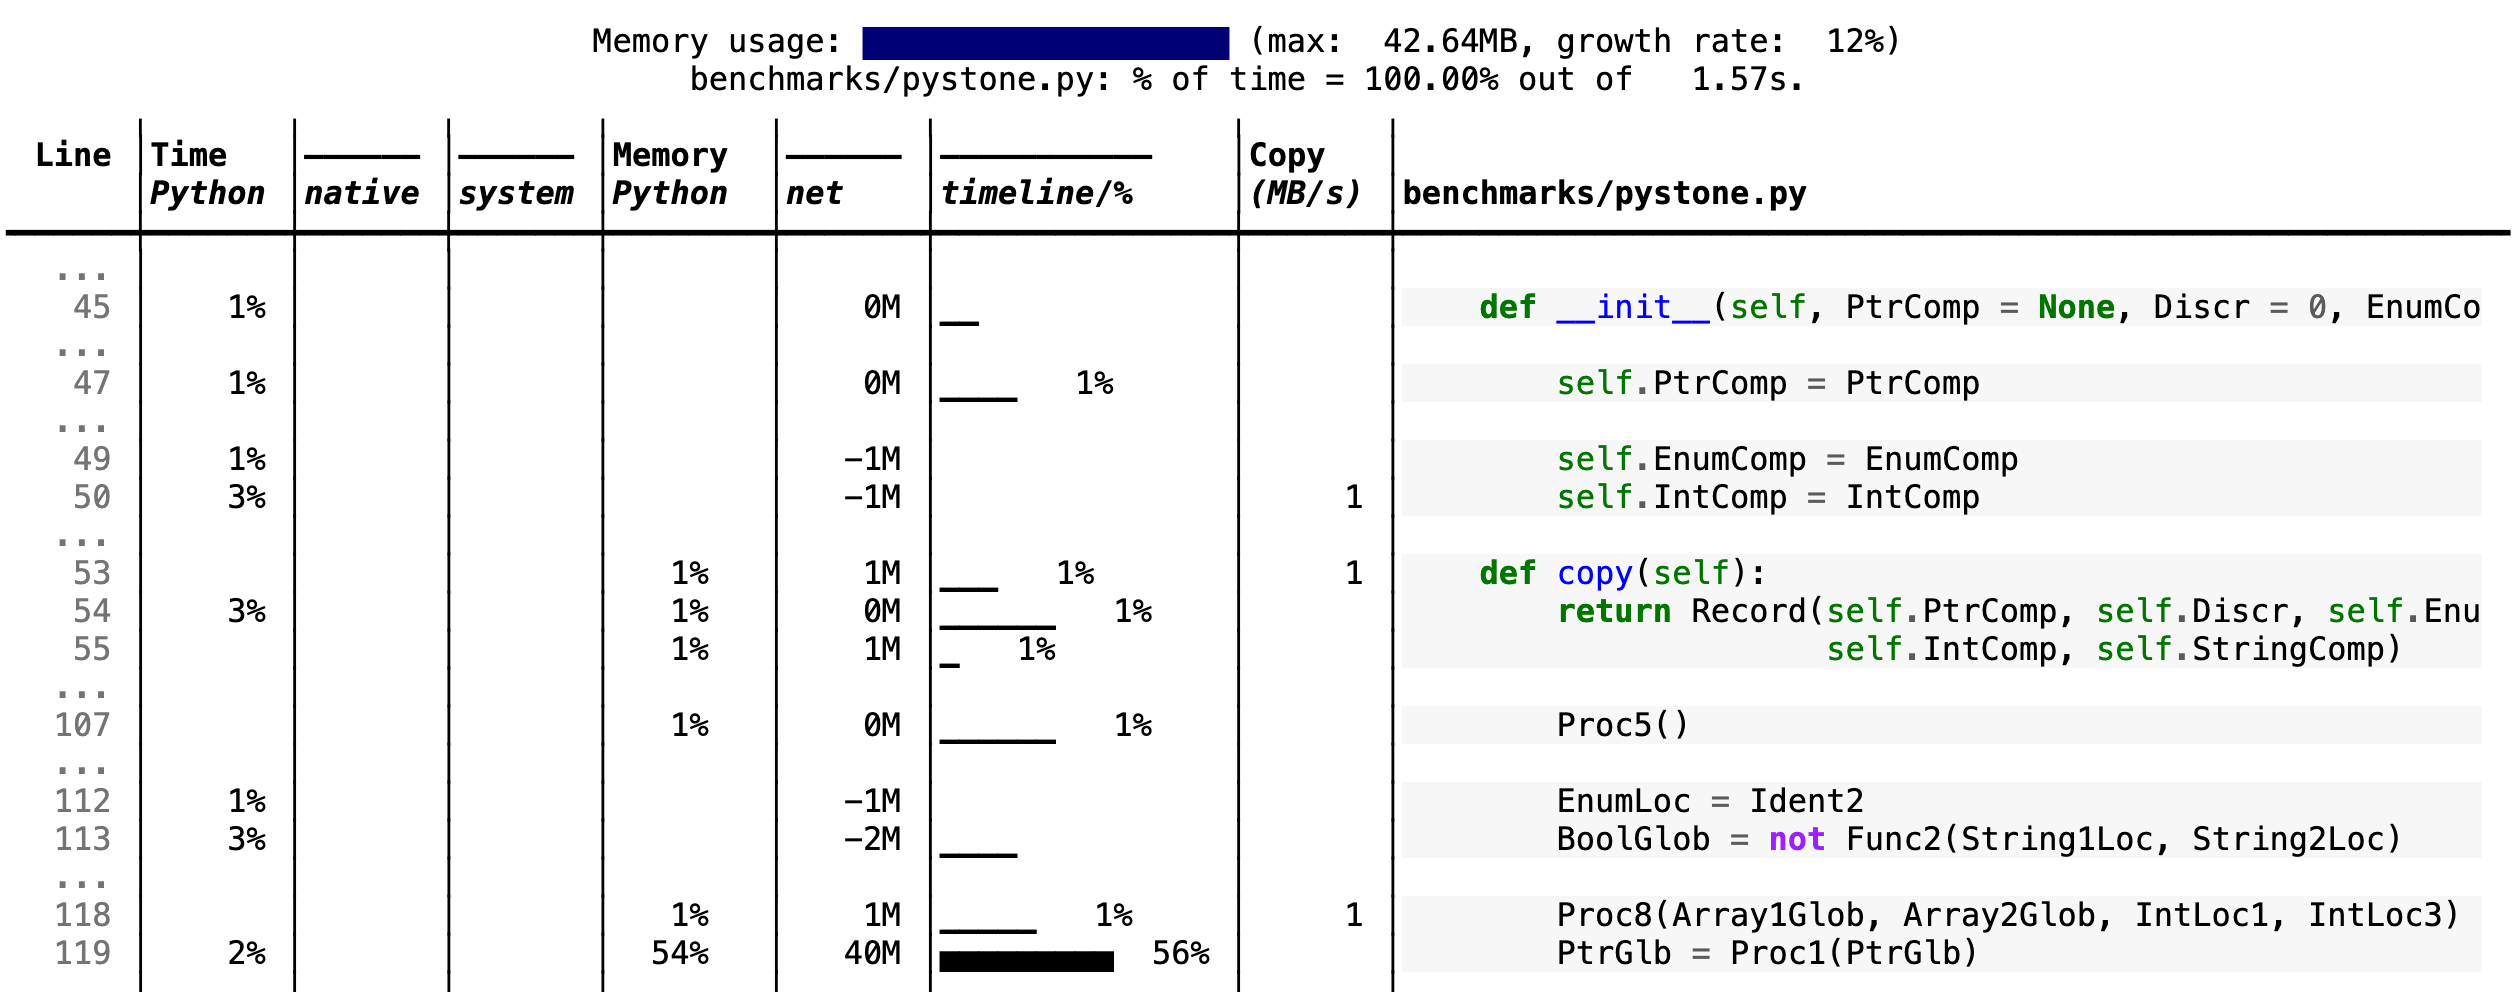
- Memory usage at the top: Visualized by "sparklines", memory consumption over the runtime of the profiled code.
- "Time Python": How much time was spent in Python code.
- "native": How much time was spent in non-Python code (e.g., libraries written in C/C++).
- "system": How much time was spent in the system (e.g., I/O).
- "GPU": (not shown here) How much time spent on the GPU, if your system has an NVIDIA GPU installed.
- "Memory Python": How much of the memory allocation happened on the Python side of the code, as opposed to in non-Python code (e.g., libraries written in C/C++).
- "net": Positive net memory numbers indicate total memory allocation in megabytes; negative net memory numbers indicate memory reclamation.
- "timeline / %": Visualized by "sparklines", memory consumption generated by this line over the program runtime, and the percentages of total memory activity this line represents.
- "Copy (MB/s)": The amount of megabytes being copied per second (see "About Scalene").
Scalene
The following command runs Scalene on a provided example program.
scalene test/testme.py
Click to see all Scalene's options (available by running with --help)
% scalene --help
Scalene: a high-precision CPU and memory profiler, version 1.5.51 (2025.01.29)
https://github.com/plasma-umass/scalene

commands:
  run     Profile a Python program (saves to scalene-profile.json)
  view    View an existing profile in browser or terminal

examples:
  % scalene run your_program.py              # profile, save to scalene-profile.json
  % scalene view                             # view scalene-profile.json in browser
  % scalene view --cli                       # view profile in terminal

in Jupyter, line mode:
  %scrun [options] statement

in Jupyter, cell mode:
  %%scalene [options]
   your code here

% scalene run --help
Profile a Python program with Scalene.

examples:
  % scalene run prog.py                 # profile, save to scalene-profile.json
  % scalene run -o my.json prog.py      # save to custom file
  % scalene run --cpu-only prog.py      # profile CPU only (faster)
  % scalene run -c scalene.yaml prog.py # load options from config file
  % scalene run prog.py --- --arg       # pass args to program
  % scalene run --help-advanced         # show advanced options

options:
  -h, --help            show this help message and exit
  -o, --outfile OUTFILE output file (default: scalene-profile.json)
  --cpu-only            only profile C

 Scalene 是一个高性能的 Python CPU、GPU 和内存性能分析器(profiler)。它也是第一个提供 AI 优化建议的性能分析器,可以通过 OpenAI、Azure、Bedrock 或本地 Ollama 模型等供应商来实现。