






14.3K ·GitHub
What is this?
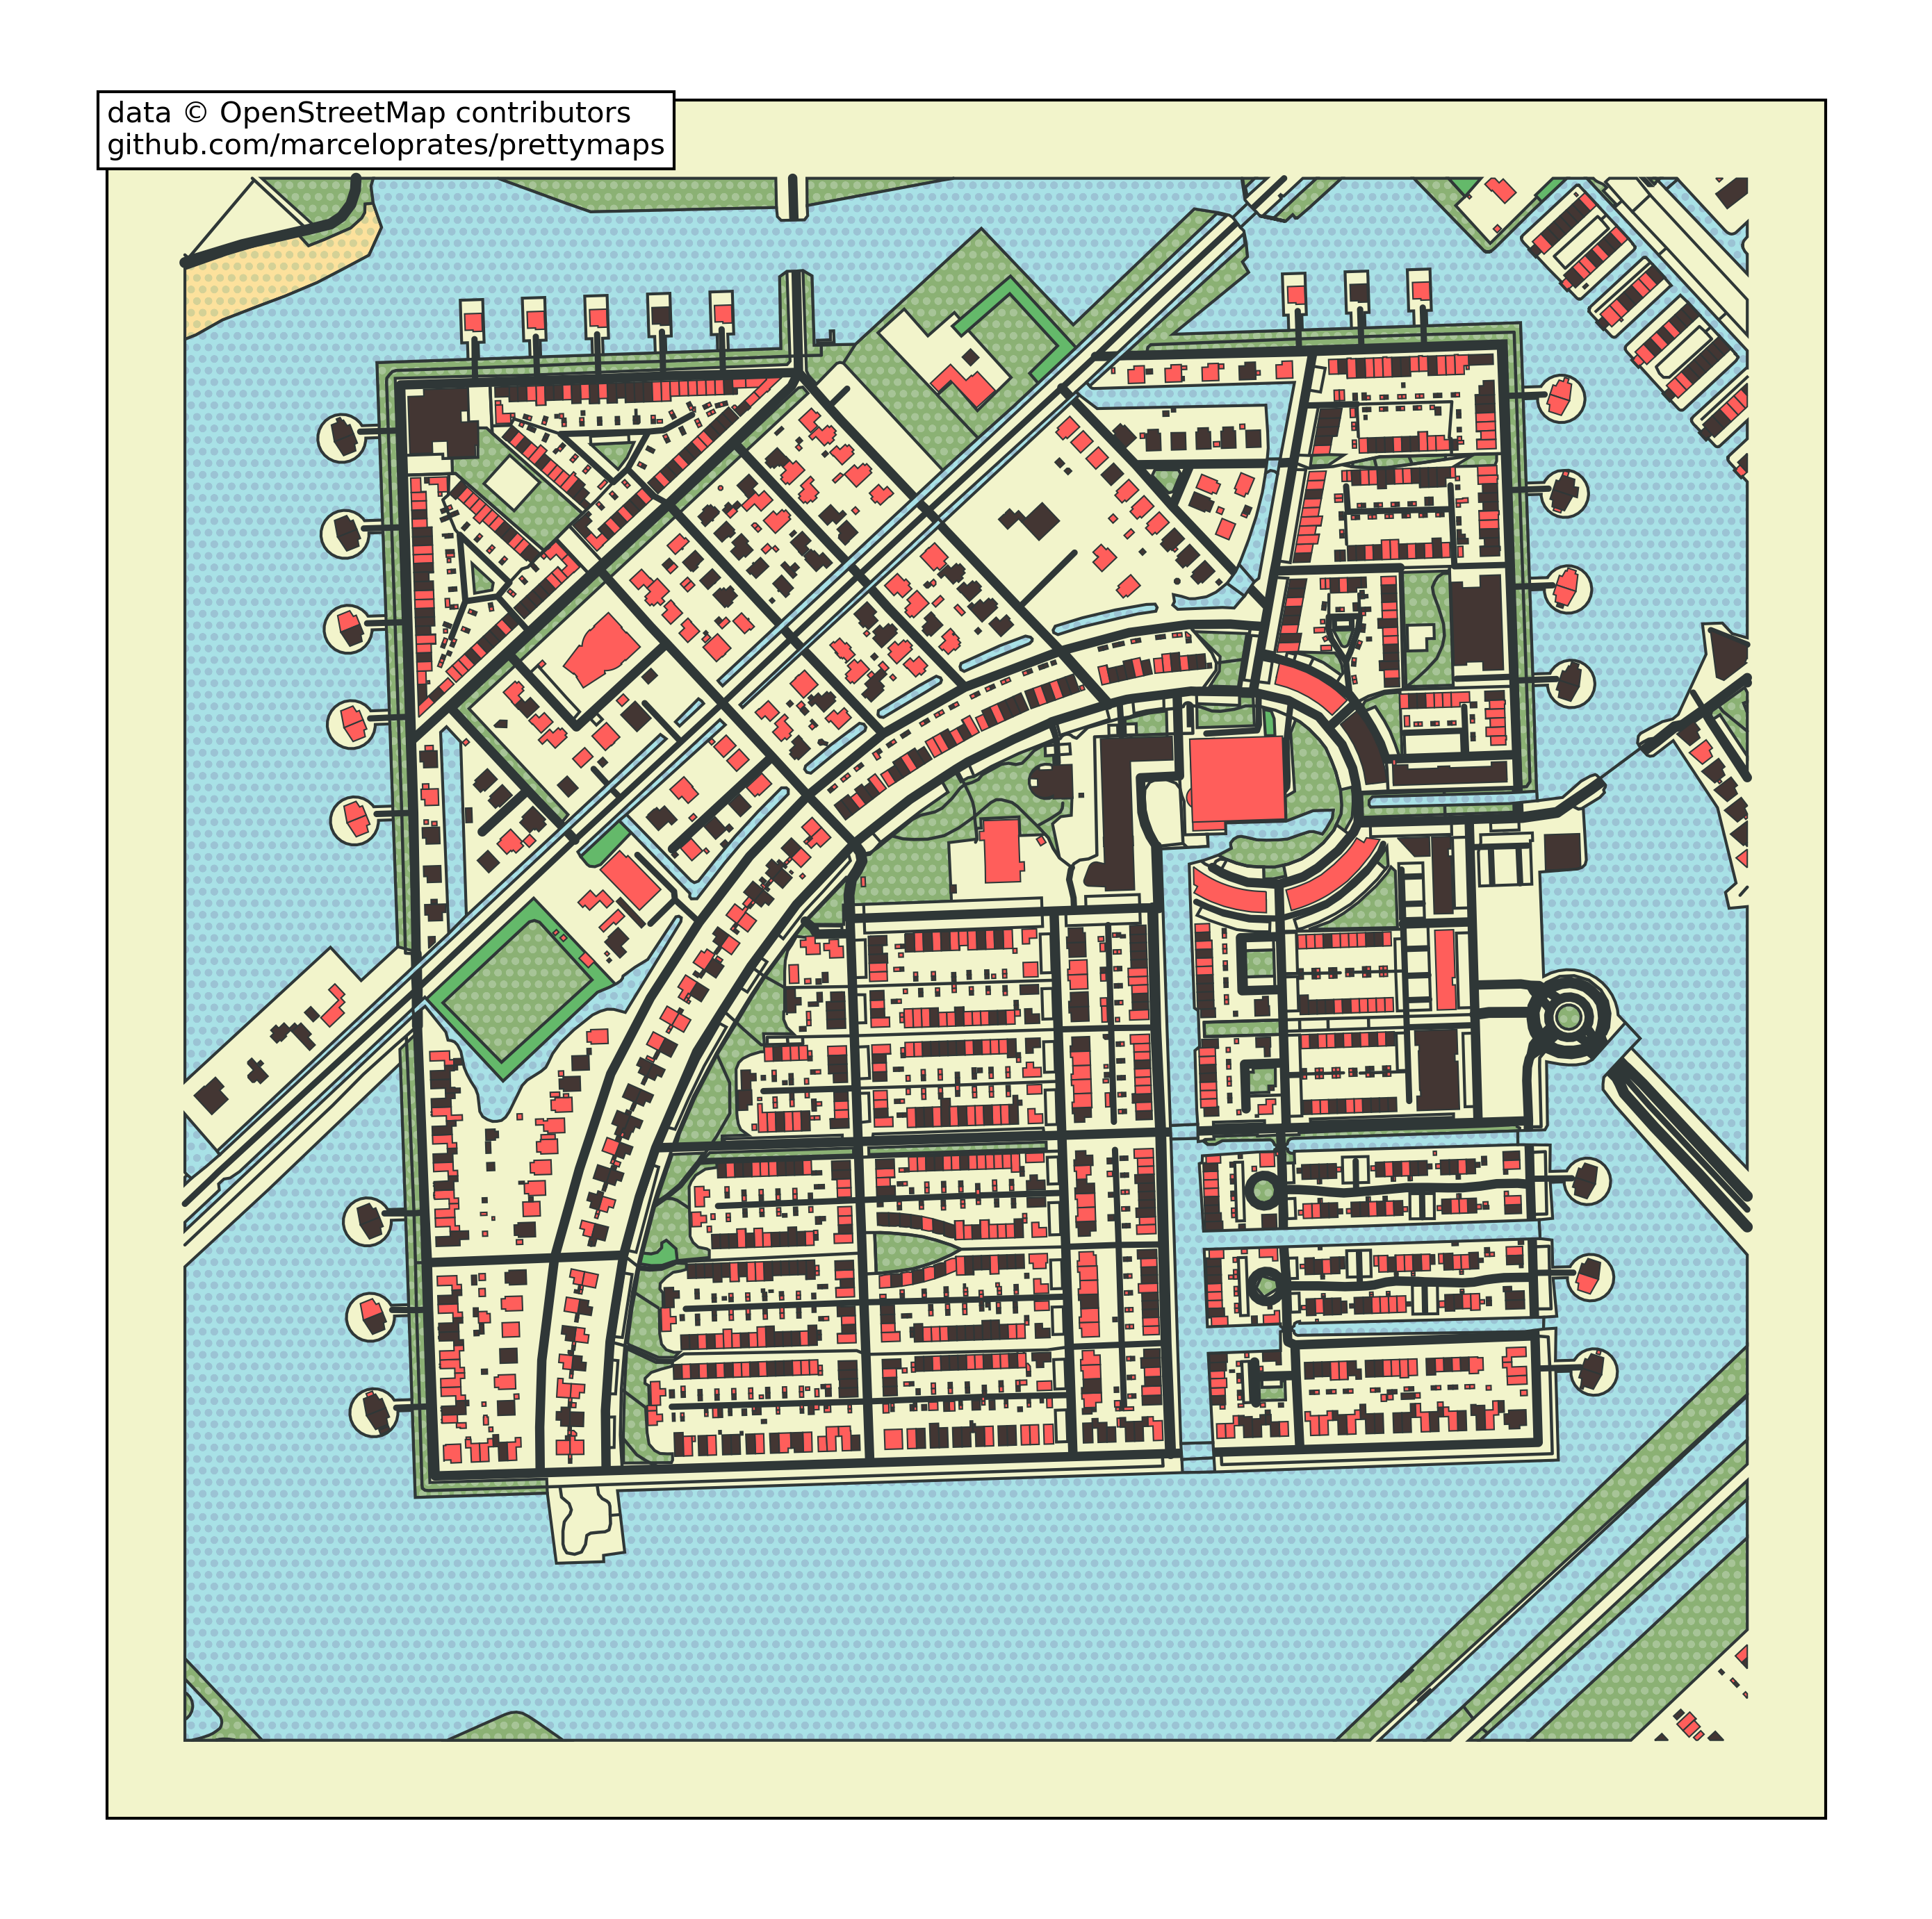
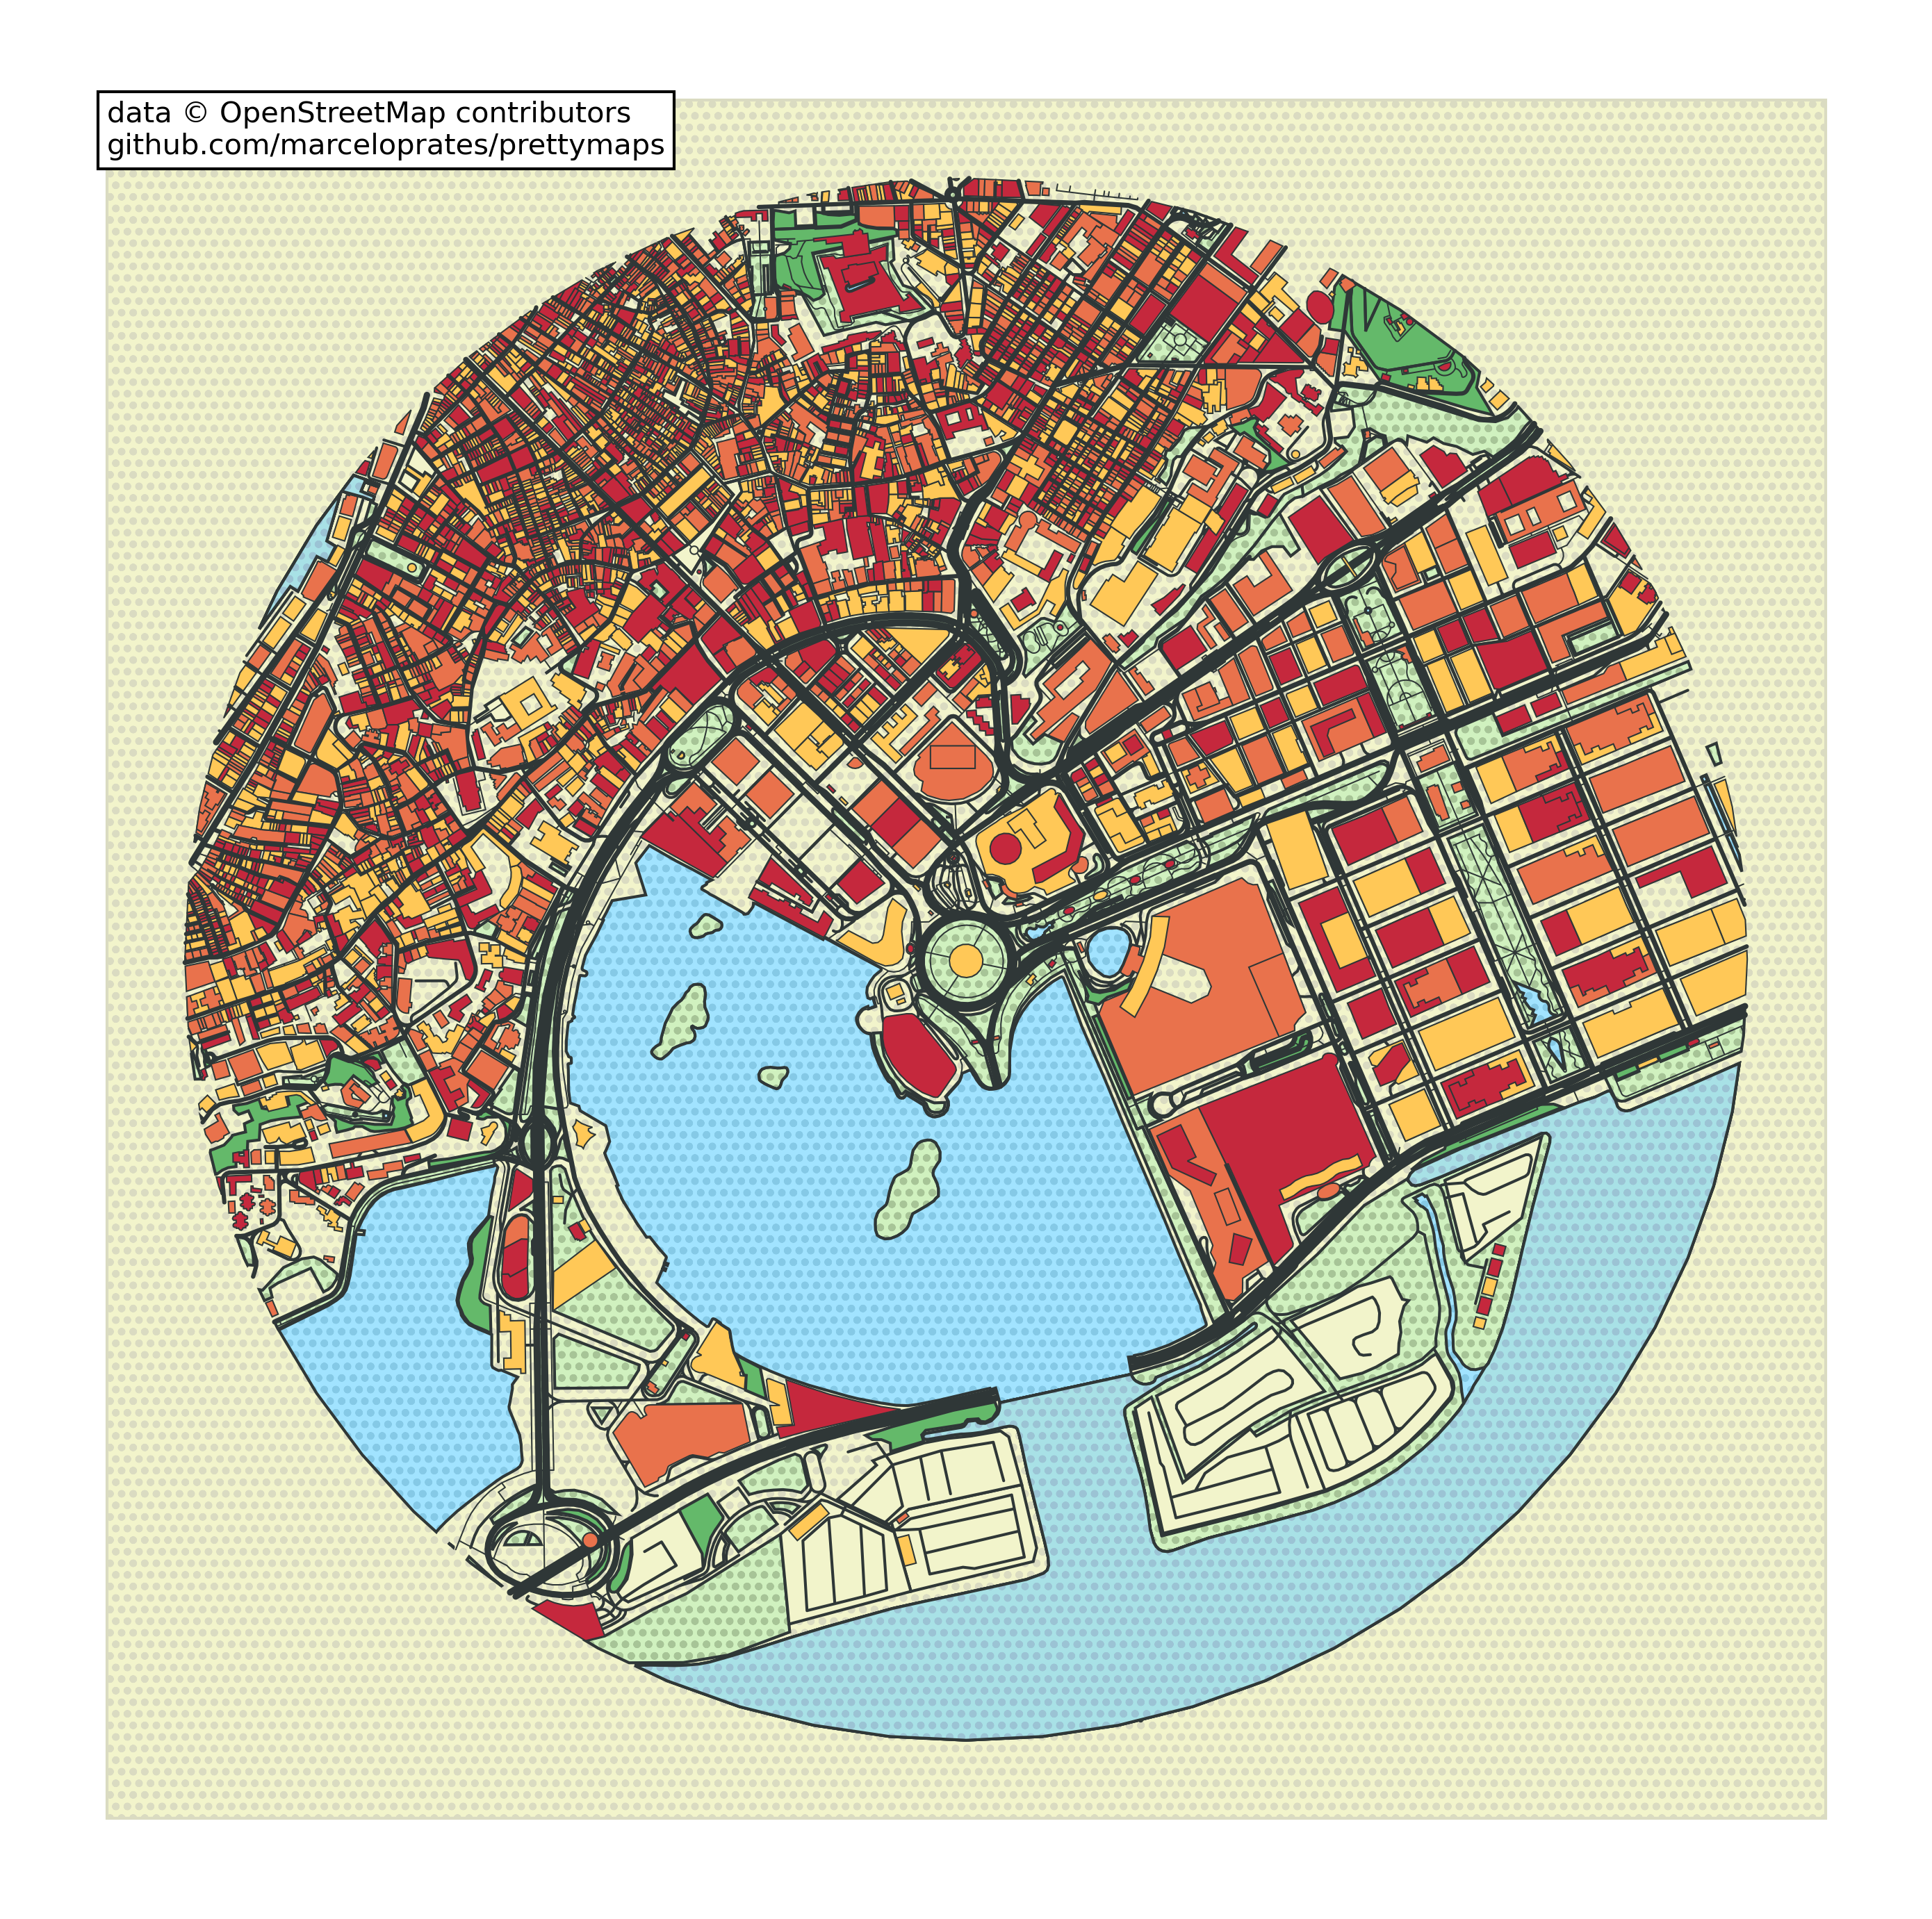
 prettymaps is a Python library that draws stylized, artistic maps from OpenStreetMap data, combining osmnx, matplotlib, shapely and vsketch to render streets, buildings, water and other features as a custom-styled figure.
prettymaps is a Python library that draws stylized, artistic maps from OpenStreetMap data, combining osmnx, matplotlib, shapely and vsketch to render streets, buildings, water and other features as a custom-styled figure.Is this just a library, or does it come with an app too?It is mainly a Python library you drive with prettymaps.plot(), but the repo also ships an optional Streamlit front-end (app.py) you can run locally for a GUI.
It is mainly a Python library you drive with prettymaps.plot(), but the repo also ships an optional Streamlit front-end (app.py) you can run locally for a GUI.How do I install it and make my first map?Install it locally with pip, or install it on Google Colaboratory and restart the runtime, then call prettymaps.plot() with layers, style and a location; a marimo tutorial notebook and a Colab demo walk through the whole workflow.
Install it locally with pip, or install it on Google Colaboratory and restart the runtime, then call prettymaps.plot() with layers, style and a location; a marimo tutorial notebook and a Colab demo walk through the whole workflow.What does it rely on under the hood?It's built on osmnx for fetching OpenStreetMap data, matplotlib for rendering, shapely for geometry, and vsketch for sketch-style drawing; you only need a Python environment.
It's built on osmnx for fetching OpenStreetMap data, matplotlib for rendering, shapely for geometry, and vsketch for sketch-style drawing; you only need a Python environment.Is there anything unusual in the license I should know about?It's AGPL-3.0, so commercial use, distribution and modification are allowed but you must disclose source code and keep the crediting message; the author also explicitly forbids using prettymaps output to mint and sell NFTs, after past misuse by other projects.
It's AGPL-3.0, so commercial use, distribution and modification are allowed but you must disclose source code and keep the crediting message; the author also explicitly forbids using prettymaps output to mint and sell NFTs, after past misuse by other projects.What can I customize when drawing a map?You control layers (which OSM features to fetch), style (matplotlib styling per layer), presets (JSON configs like 'default', 'minimal', 'macao', 'tijuca'), and the boundary shape via circle, radius and dilate parameters.
You control layers (which OSM features to fetch), style (matplotlib styling per layer), presets (JSON configs like 'default', 'minimal', 'macao', 'tijuca'), and the boundary shape via circle, radius and dilate parameters.Where can I try it without installing anything?There's a Google Colaboratory demo notebook you can open and run directly in the browser, no local setup needed.
There's a Google Colaboratory demo notebook you can open and run directly in the browser, no local setup needed.Can I see worked examples before diving in?docs/tutorial.md walks through rendered examples like Macau, Bom Fim, a Barcelona plotter, Tijuca, multiplot, hillshade and keypoints, with images alongside the code.
docs/tutorial.md walks through rendered examples like Macau, Bom Fim, a Barcelona plotter, Tijuca, multiplot, hillshade and keypoints, with images alongside the code.What are similar projects?city-roads, kepler.gl, marimo, matplotlib, bokeh, pygwalker, scientific-visualization-book, seaborn
city-roads, kepler.gl, marimo, matplotlib, bokeh, pygwalker, scientific-visualization-book, seabornWhich topics is it in?plotting, openstreetmap, matplotlib, gis, maps, generative-art, art, jupyter, creative-coding, jupyter-notebook, python-library, visualization
plotting, openstreetmap, matplotlib, gis, maps, generative-art, art, jupyter, creative-coding, jupyter-notebook, python-library, visualization