
BPF Compiler Collection (BCC)
BCC is a toolkit for creating efficient kernel tracing and manipulation
programs, and includes several useful tools and examples. It makes use of
extended BPF (Berkeley Packet Filters), formally known as eBPF, a new feature
that was first added to Linux 3.15. Much of what BCC uses requires Linux 4.1
and above.
eBPF was described by Ingo Molnár as:
One of the more interesting features in this cycle is the ability to attach eBPF programs (user-defined, sandboxed bytecode executed by the kernel) to kprobes. This allows user-defined instrumentation on a live kernel image that can never crash, hang or interfere with the kernel negatively.
BCC makes BPF programs easier to write, with kernel instrumentation in C
(and includes a C wrapper around LLVM), and front-ends in Python and lua.
It is suited for many tasks, including performance analysis and network
traffic control.
Screenshot
This example traces a disk I/O kernel function, and populates an in-kernel
power-of-2 histogram of the I/O size. For efficiency, only the histogram
summary is returned to user-level.
# ./bitehist.py
Tracing... Hit Ctrl-C to end.
^C
     kbytes          : count     distribution
       0 -> 1        : 3        |                                      |
       2 -> 3        : 0        |                                      |
       4 -> 7        : 211      |**********                            |
       8 -> 15       : 0        |                                      |
      16 -> 31       : 0        |                                      |
      32 -> 63       : 0        |                                      |
      64 -> 127      : 1        |                                      |
     128 -> 255      : 800      |**************************************|
The above output shows a bimodal distribution, where the largest mode of
800 I/O was between 128 and 255 Kbytes in size.
See the source: bitehist.py. What this traces,
what this stores, and how the data is presented, can be entirely customized.
This shows only some of many possible capabilities.
Installing
See INSTALL.md for installation steps on your platform.
FAQ
See FAQ.txt for the most common troubleshoot questions.
Reference guide
See docs/reference_guide.md for the reference guide to the bcc and bcc/BPF APIs.
Contents
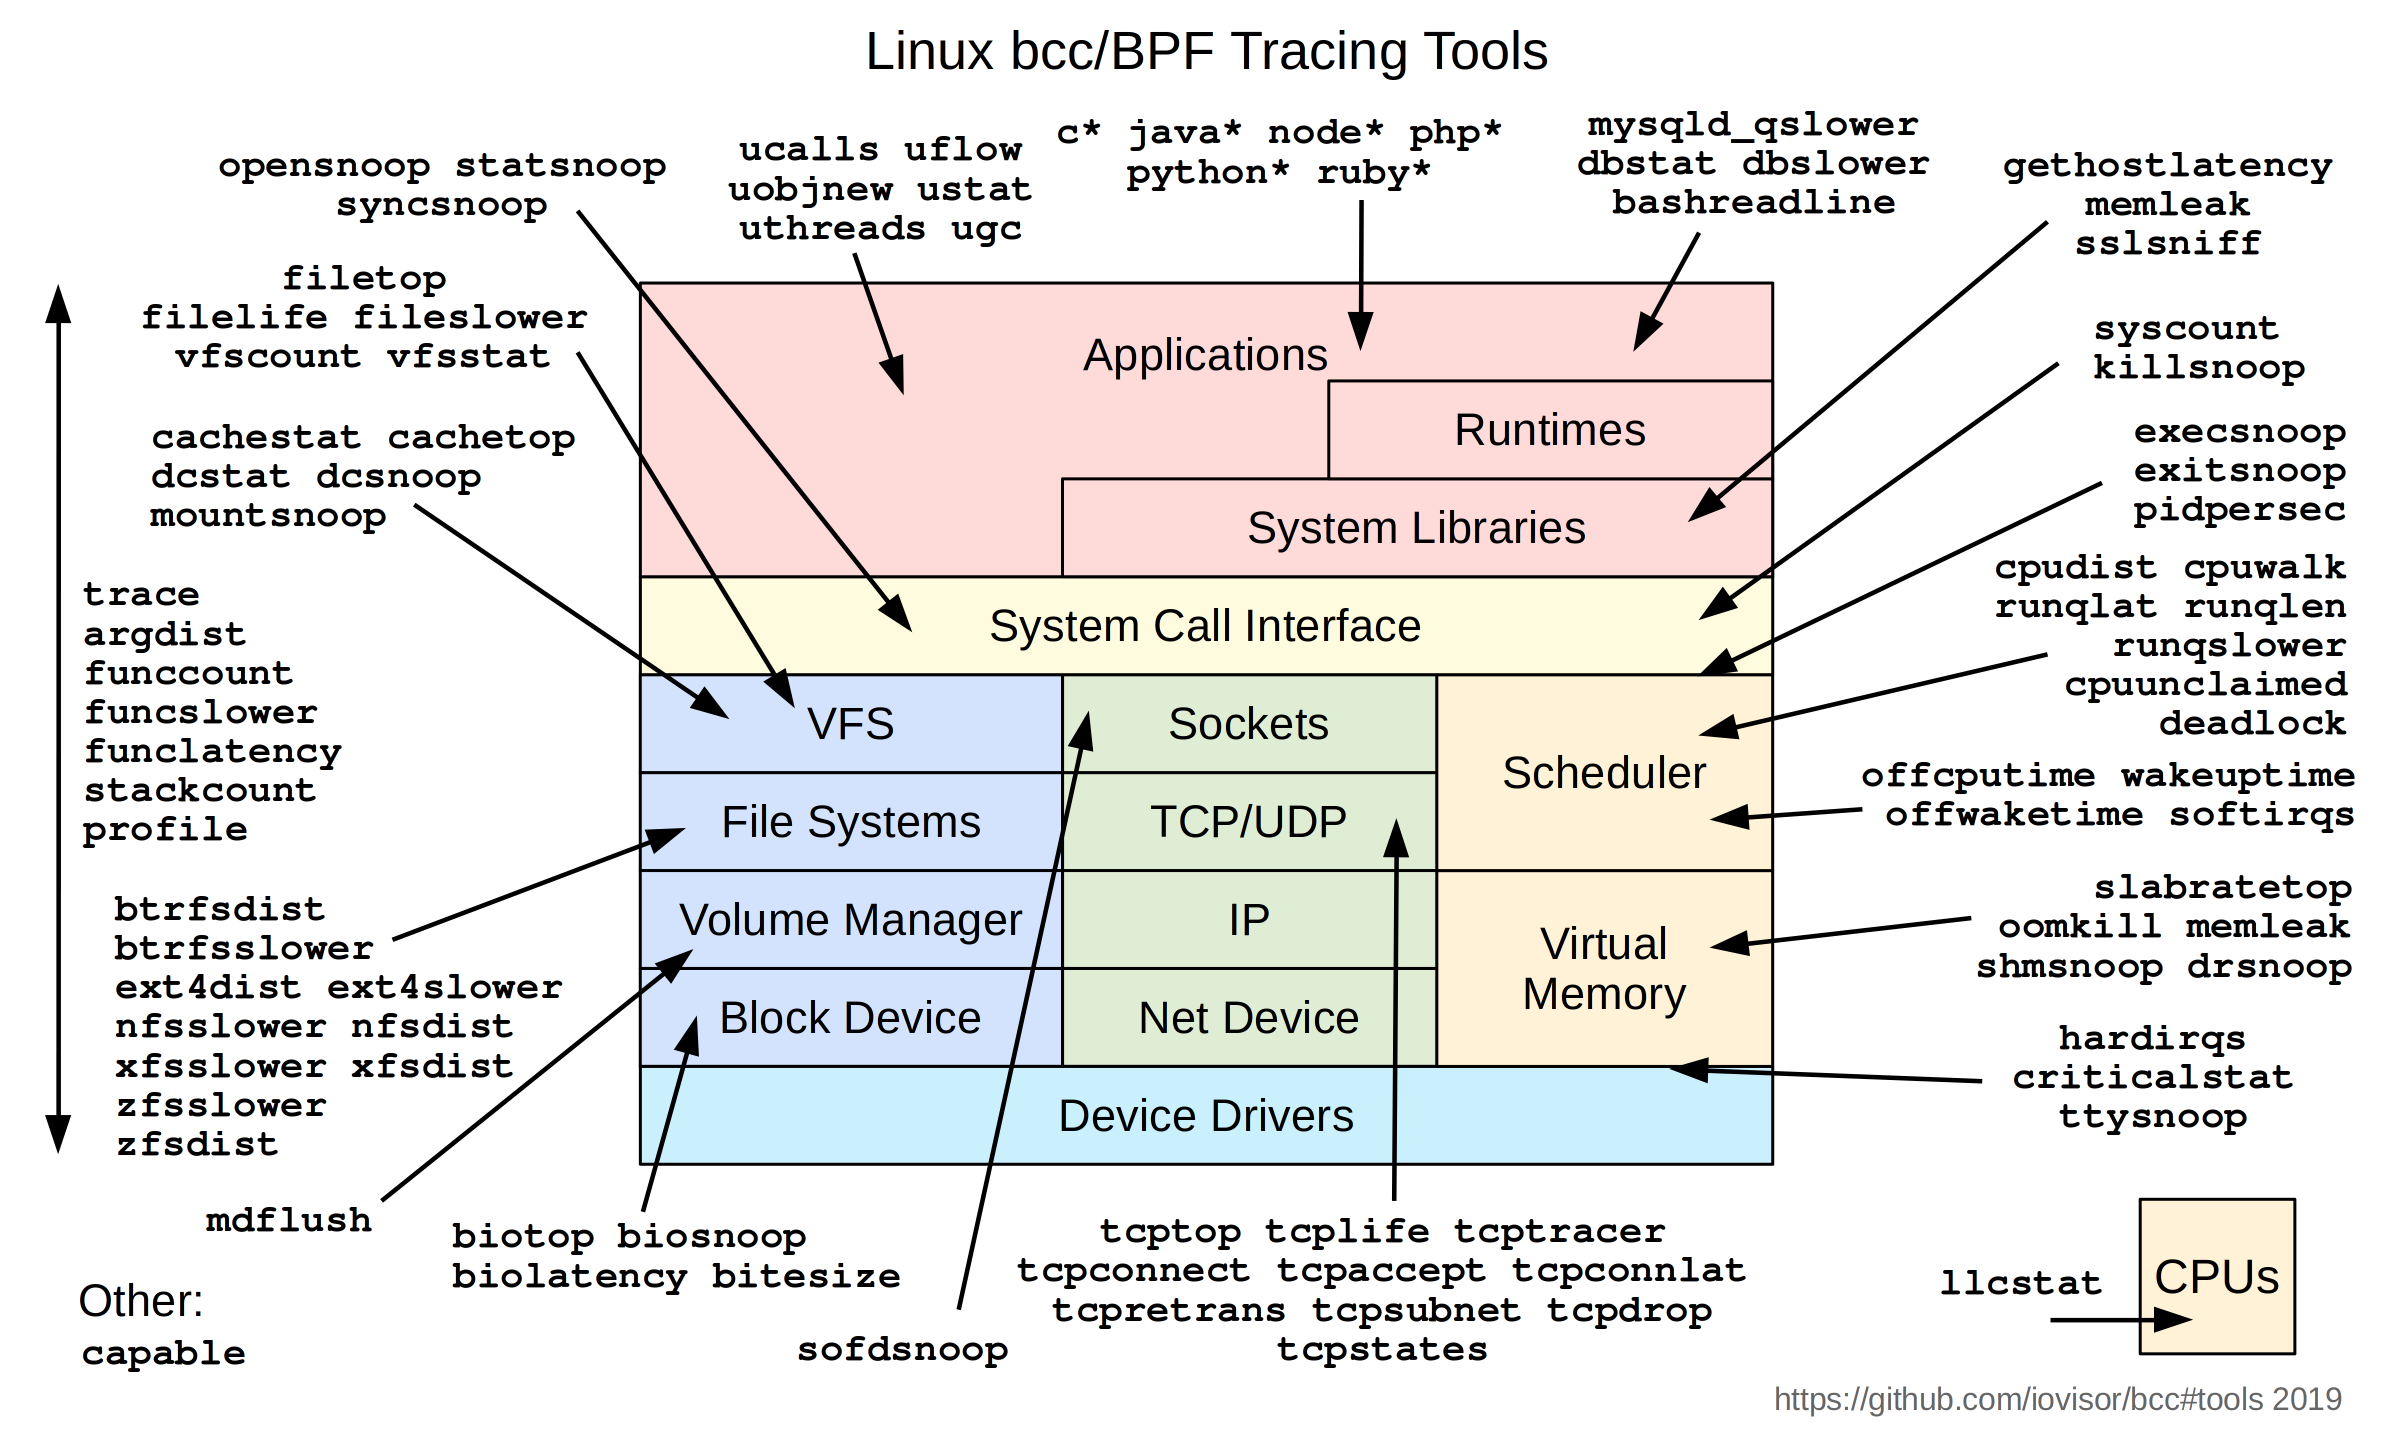
Some of these are single files that contain both C and Python, others have a
pair of .c and .py files, and some are directories of files.
Tracing
Examples
Networking
Examples:
BPF Introspection
Tools that help to introspect BPF programs.
- introspection/bps.c: List all BPF programs loaded into the kernel. 'ps' for BPF programs. Examples.
Motivation
BPF guarantees that the programs loaded into the kernel cannot crash, and
cannot run forever, but yet BPF is general purpose enough to perform many
arbitrary types of computation. Currently, it is possible to write a program in
C that will compile into a valid BPF program, yet it is vastly easier to
write a C program that will compile into invalid BPF (C is like that). The user
won't know until trying to run the program whether it was valid or not.
With a BPF-specific frontend, one should be able to write in a language and
receive feedback from the compiler on the validity as it pertains to a BPF
backend. This toolkit aims to provide a frontend that can only create valid BPF
programs while still harnessing its full flexibility.
Furthermore, current integrations with BPF have a kludgy workflow, sometimes
involving compiling directly in a linux kernel source tree. This toolchain aims
to minimize the time that a developer spends getting BPF compiled, and instead
focus on the applications that can be written and the problems that can be
solved with BPF.
The features of this toolkit include:
- End-to-end BPF workflow in a shared library
- A modified C language for BPF backends
- Integration with llvm-bpf backend for JIT
- Dynamic (un)loading of JITed programs
- Support for BPF kernel hooks: socket filters, tc classifiers,
tc actions, and kprobes
- Bindings for Python
- Examples for socket filters, tc classifiers, and kprobes
- Self-contained tools for tracing a running system
In the future, more bindings besides python will likely be supported. Feel free
to add support for the language of your choice and send a pull request!
Tutorials
Networking
At Red Hat Summit 2015, BCC was presented as part of a session on BPF.
A multi-host vxlan environment is simulated and a BPF program used to monitor
one of the physical interfaces. The BPF program keeps statistics on the inner
and outer IP addresses traversing the interface, and the userspace component
turns those statistics into a graph showing the traffic distribution at
multiple granularities. See the code here.
Contributing
Already pumped up to commit some code? Here are some resources to join the
discussions in the IOVisor community and see
what you want to work on.
External links
Looking for more information on BCC and how it's being used? You can find links to other BCC content on the web in LINKS.md.


 BCC(BPF Compiler Collection)是一套工具包,用于在 Linux 上通过 eBPF 编写高效的内核跟踪和操作程序。它还自带大量现成工具,可用于 I/O 分析、网络和监控。