







pyroscope README

The project's README from github.com/grafana/pyroscope. As one markdown file: README.md.

Pyroscope

ci Go Report License: AGPLv3 FOSSA Status Latest release DockerHub Go Reference

🎉 Announcement: Pyroscope 2.0 is here!

Pyroscope 2.0 makes the new v2 architecture the default. Profiles are written directly to object storage, removing the need for in-memory ingesters and local disks - simplifying operations and lowering resource usage at scale. Existing v1 deployments can opt in via a flag and migrate without data loss.

Read the 2.0 release notes and the v2 architecture overview. Upgrading from v1? See the migration guide.

Want the full story? Watch the GrafanaCON 2026 talk Pyroscope 2.0: Continuous Profiling Architecture Deep Dive.

What is Grafana Pyroscope?

Grafana Pyroscope is a continuous profiling platform designed to surface performance insights from your applications, helping you optimize resource usage such as CPU, memory, and I/O operations. With Pyroscope, you can both proactively and reactively address performance bottlenecks across your system.

The typical use cases are:

Pyroscope provides powerful tools to give you a comprehensive view of your application's behavior while allowing you to drill down into specific services for more targeted root cause analysis.

How Does Pyroscope Work?

deployment_diagram

Pyroscope consists of three main components:

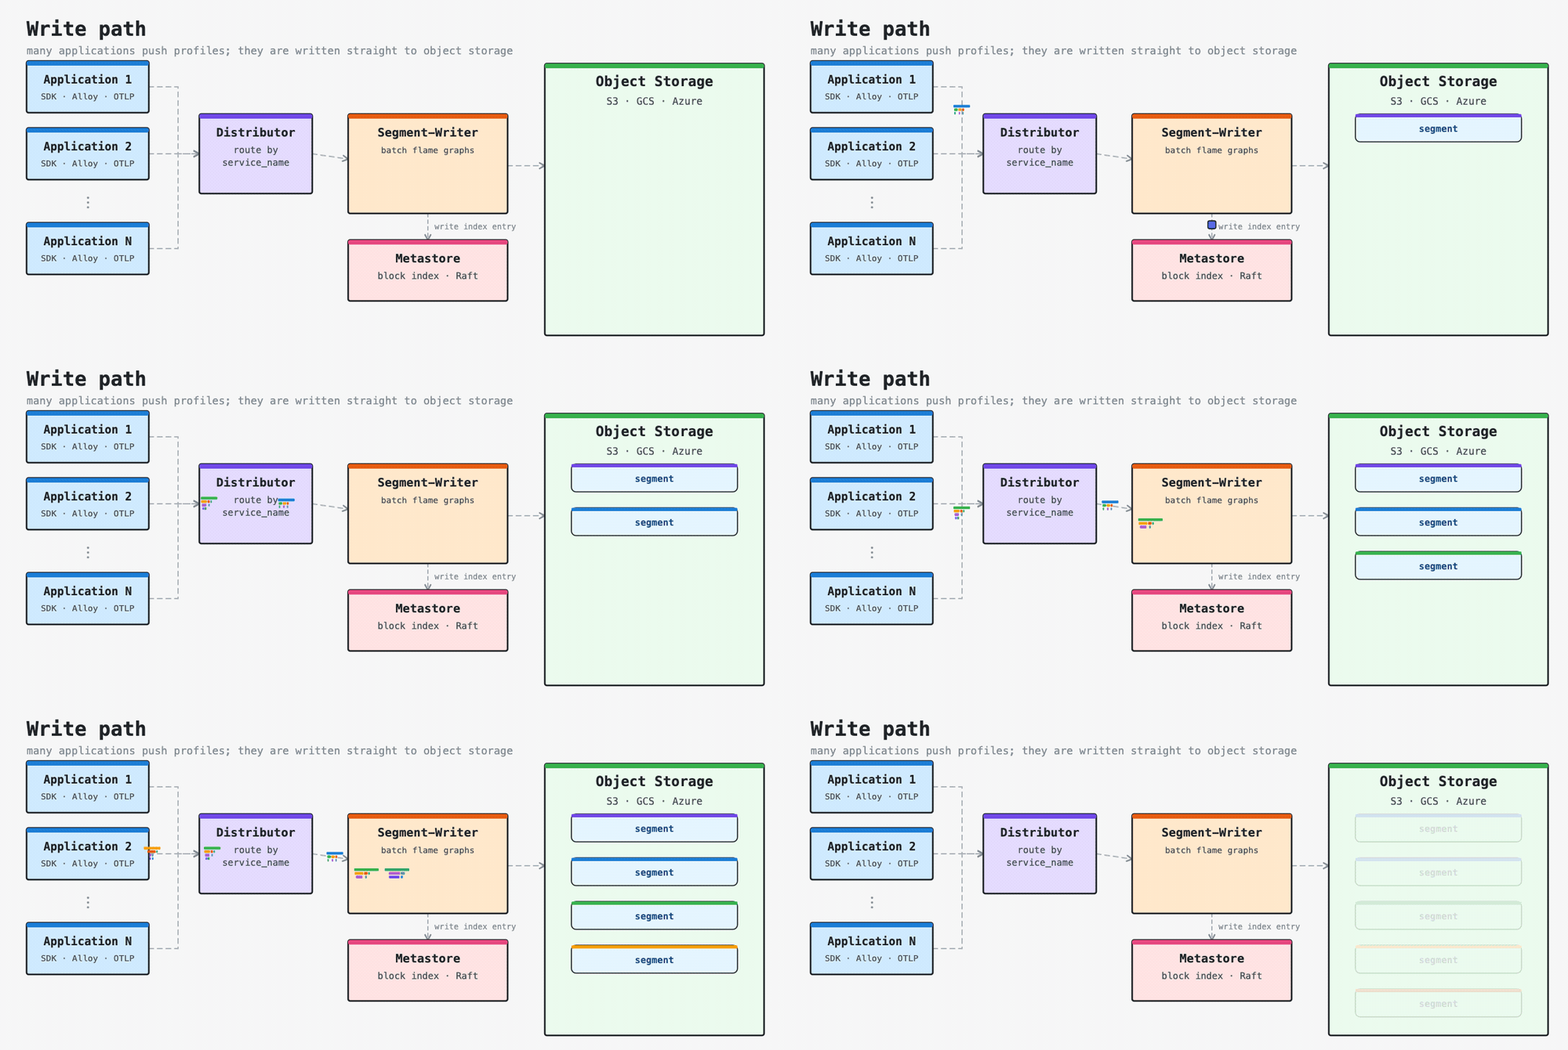
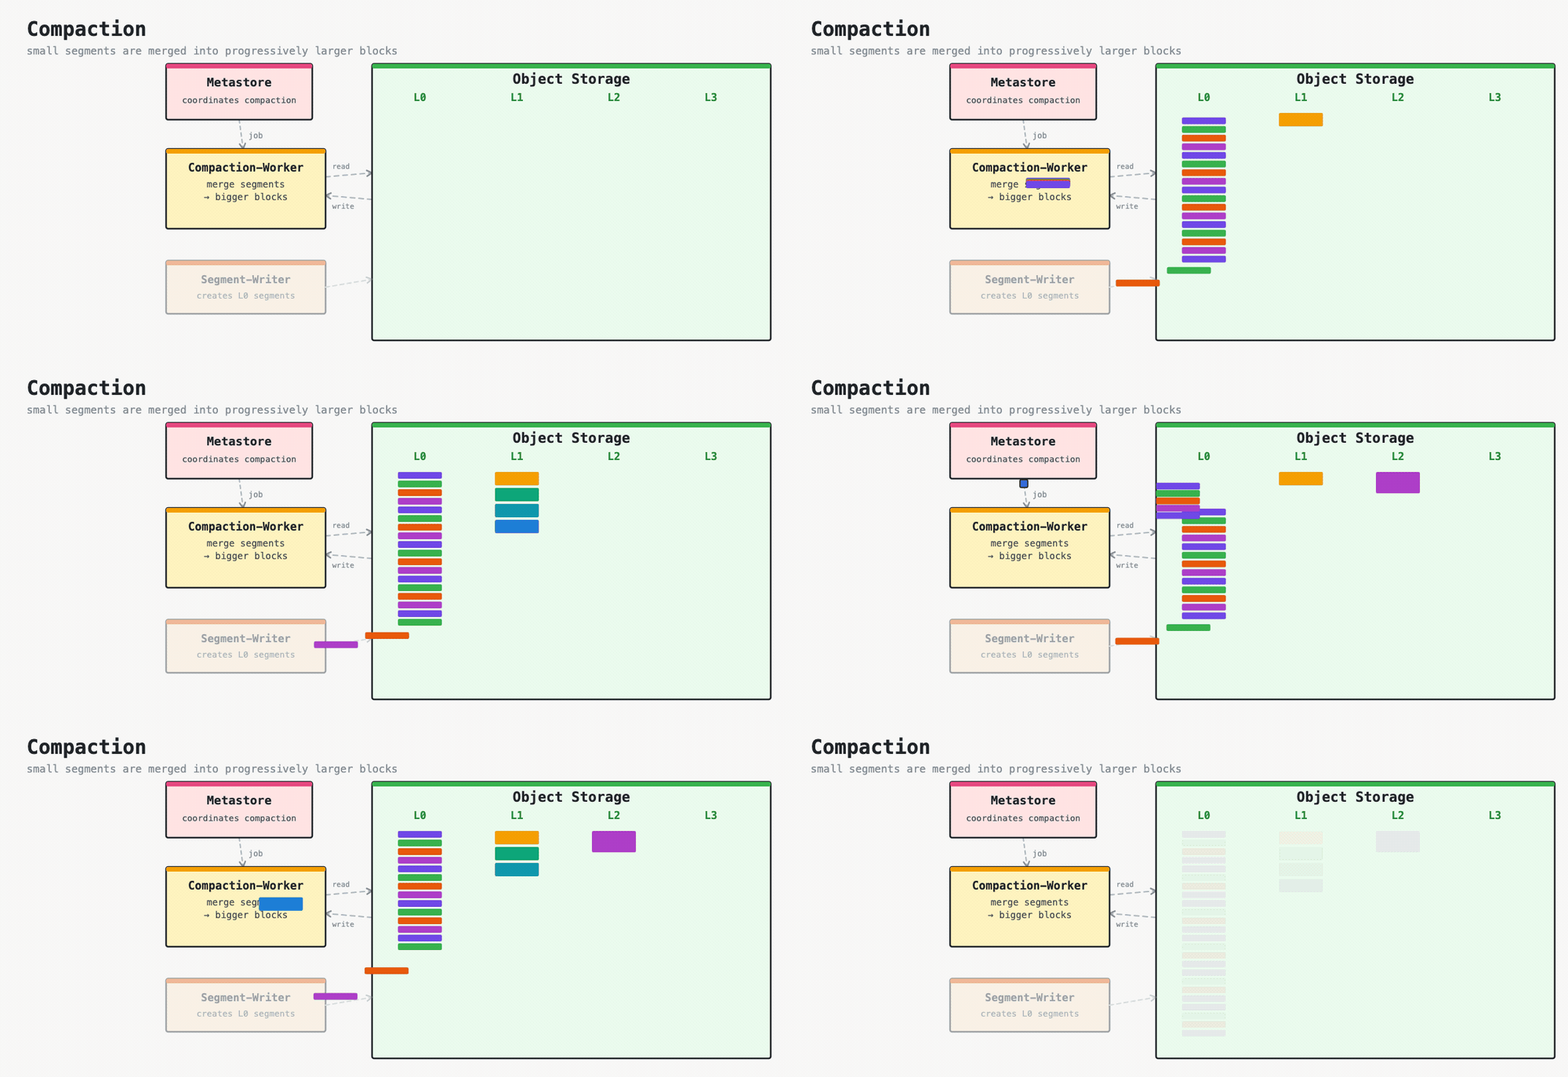
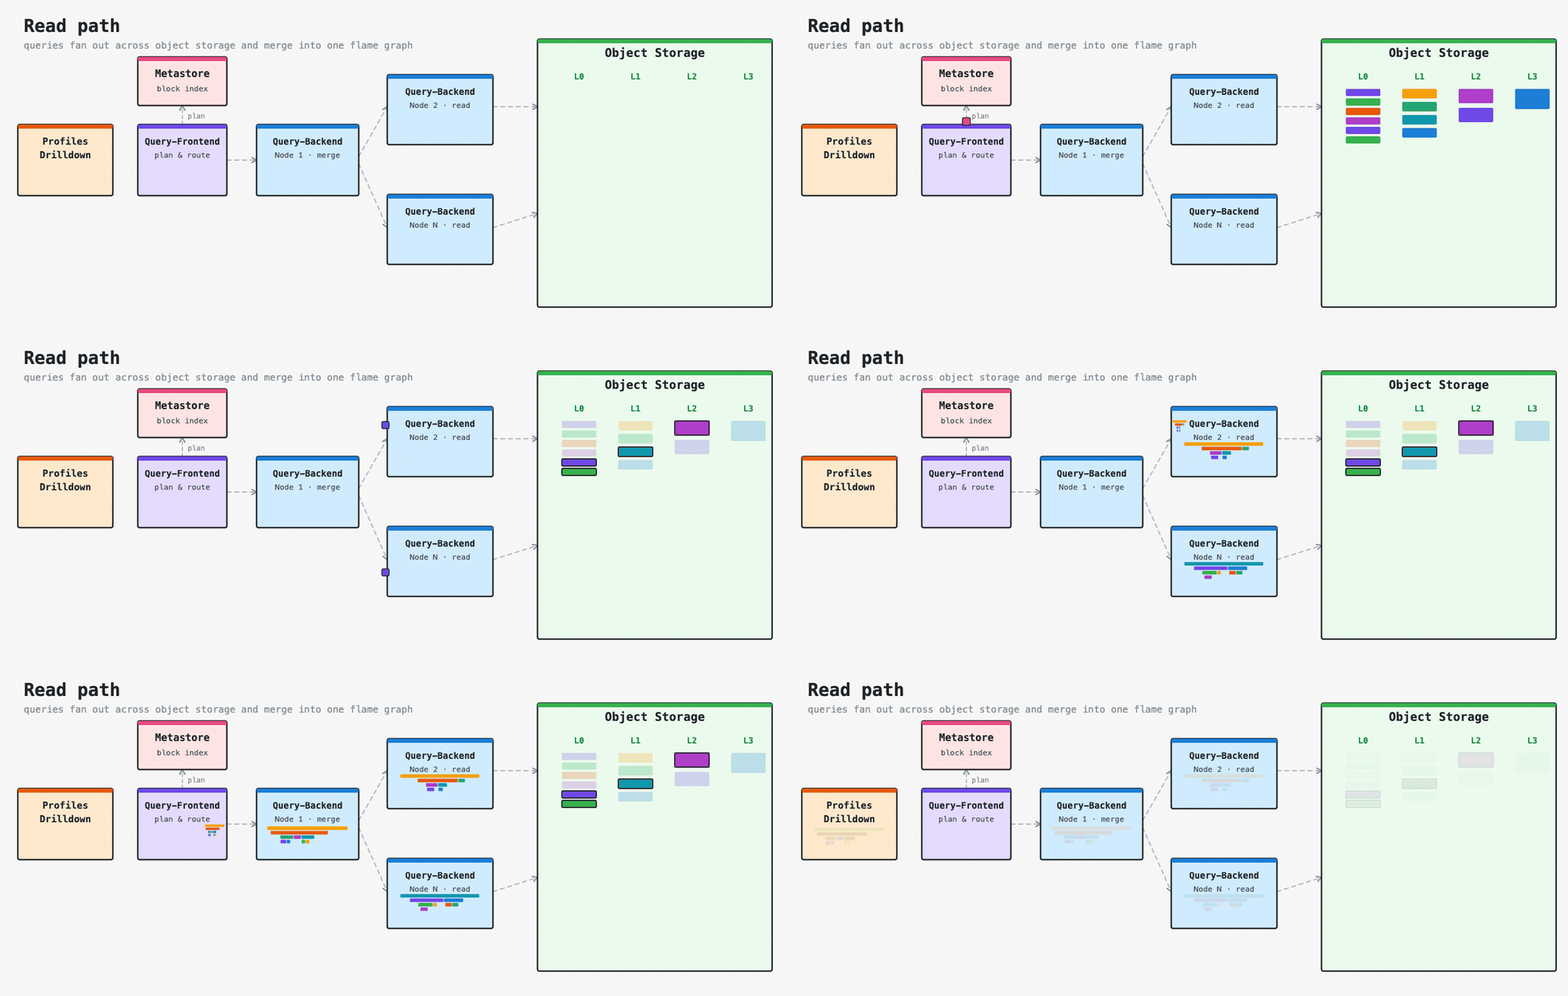
Under the hood, Pyroscope v2 writes profiles straight to object storage—no ingesters, no local disk. The animations below trace the three parts of the architecture. For the details behind each component, see the v2 architecture documentation.

Write path — profiles are routed by service and written straight to object storage:

Pyroscope v2 write path

Compaction — compaction-workers merge small segments into larger blocks in the background:

Pyroscope v2 compaction

Read path — queries fan out across object storage to build flame graphs in Grafana Profiles Drilldown:

Pyroscope v2 read path


Pyroscope Live Demo

Pyroscope GIF Demo


Quick Start: Run the Pyroscope server locally

Docker

docker run -it -p 4040:4040 grafana/pyroscope

Homebrew (macOS / Linux)

brew install pyroscope-io/brew/pyroscope
brew services start pyroscope

Binary

Download the archive for your operating system and architecture from the latest release, unpack it, and run the binary:

tar xvf pyroscope_*.tar.gz
./pyroscope

Pyroscope listens on port 4040. For Kubernetes/Helm, Linux packages, building from source, and full configuration options, see the Get started guide and the server documentation.

Quick Start: Visualize profiles with Grafana Profiles Drilldown

image

Grafana Profiles Drilldown (formerly Explore Profiles) is the primary, queryless way to visualize and analyze your profiling data.

Grafana Cloud / OSS

Profiles Drilldown is pre-installed and is the default way to explore your profiles – all you need to do is start sending data.

Documentation

For more information on how to use Pyroscope with other programming languages, install it on Linux, or use it in a production environment, check out our documentation:

Send data to the server

You can send profiles to Pyroscope with the language SDKs, with Grafana Alloy, or over OTLP from OpenTelemetry-compatible sources such as the OpenTelemetry eBPF profiler.

For more documentation on how to add the Pyroscope SDK to your code, see the client documentation on our website or find language-specific examples and documentation below:


Golang

Documentation
Examples

Java

Documentation
Examples

Python

Documentation
Examples

Ruby

Documentation
Examples

Node.js

Documentation
Examples

.NET

Documentation
Examples

eBPF

Documentation
Examples

Rust

Documentation
Examples

Supported Languages

Our documentation contains the most recent list of supported languages and also an overview over what profiling types are supported per language.

Let us know what other integrations you want to see in our issues or in our slack.

Credits

Pyroscope is possible thanks to the excellent work of many people, including but not limited to:

Contributing

To start contributing, check out our Contributing Guide

Thanks to the contributors of Pyroscope!

pyroscope (grafana/pyroscope)

Searching Database…

11.7K ·GitHub
这是什么?Grafana Pyroscope 是一个持续性能剖析平台,可以从你的应用中采集详细的 CPU、内存和 I/O 性能数据,帮你精确定位到具体某一行代码的性能瓶颈。
这是我要嵌入的库,还是我要单独运行的服务器?它是一个独立的服务器(另外还有客户端 SDK/代理)。你运行 Pyroscope 服务器来存储和查询剖析数据,再用 SDK、Grafana Alloy 或 OTLP 对应用进行埋点,把剖析数据发送给它。
怎么把服务器跑起来?可以通过 Docker、Homebrew(macOS/Linux),或从最新版本下载适合你操作系统/架构的二进制文件并运行;服务默认监听 4040 端口。文档中也提供了 Kubernetes/Helm 和 Linux 安装包的部署方式。
要把剖析数据发送给它,我需要准备什么?你可以用 Pyroscope SDK(推送)、Grafana Alloy(拉取或推送),或者来自 OpenTelemetry 兼容数据源(如 OpenTelemetry eBPF 剖析器)的 OTLP 对应用进行埋点;支持的语言包括 Go、Java、Python、Ruby、Node.js、.NET、eBPF 和 Rust。
2.0 架构有哪些变化?我需要迁移吗?Pyroscope 2.0 直接把剖析数据写入对象存储,不再使用内存中的 ingester 和本地磁盘,从而简化运维,并在大规模场景下降低资源占用。现有的 v1 部署可以通过一个开关选项选择启用,并且无数据丢失地完成迁移。
服务器可以在哪些平台上运行?服务器可在 Linux 和 macOS 上运行(通过 Docker、Homebrew 或二进制文件),也可以部署到 Kubernetes/Helm 上;它使用 Go 编写,因此提供跨平台构建版本。
采集到剖析数据之后,我要怎么把它可视化?使用 Grafana Profiles Drilldown(原名 Explore Profiles),这是 Grafana 内置的免查询界面,用于可视化和分析来自 Pyroscope 数据的火焰图。
这里用到的剖析技术背后都有哪些人?Pyroscope 致敬了几位先驱:火焰图的发明者 Brendan Gregg、rbspy 的作者 Julia Evans、py-spy 的作者 Ben Frederickson,以及 phpspy 的作者 Adam Saponara。他们的采样剖析器和可视化方法是这个项目的基础。
不装任何东西,能先试用吗?可以,README 中有一个 Pyroscope Live Demo 链接,你可以在搭建自己的服务器之前先体验界面和火焰图。
Creator
grafana
Size
248.2 MB
Stars
11.7K
Age
5y
Commits · 90 Days