


















Что это такое?
 Grafana Pyroscope — это платформа непрерывного профилирования, которая собирает подробные данные о производительности CPU, памяти и I/O из ваших приложений, чтобы вы могли найти узкие места вплоть до отдельной строки кода.
Grafana Pyroscope — это платформа непрерывного профилирования, которая собирает подробные данные о производительности CPU, памяти и I/O из ваших приложений, чтобы вы могли найти узкие места вплоть до отдельной строки кода.Это библиотека, которую я встраиваю, или отдельный сервер, который я запускаю?Это отдельный сервер (плюс клиентские SDK и агенты). Вы запускаете сервер Pyroscope, чтобы хранить и запрашивать данные профилирования, а в свои приложения встраиваете SDK, Grafana Alloy или OTLP, чтобы отправлять в него профили.
Это отдельный сервер (плюс клиентские SDK и агенты). Вы запускаете сервер Pyroscope, чтобы хранить и запрашивать данные профилирования, а в свои приложения встраиваете SDK, Grafana Alloy или OTLP, чтобы отправлять в него профили.Как запустить сервер?Запустите его через Docker, Homebrew (macOS/Linux) или скачав бинарный файл для вашей ОС и архитектуры из последнего релиза и выполнив его; он слушает порт 4040. Также описаны варианты для Kubernetes/Helm и пакеты для Linux.
Запустите его через Docker, Homebrew (macOS/Linux) или скачав бинарный файл для вашей ОС и архитектуры из последнего релиза и выполнив его; он слушает порт 4040. Также описаны варианты для Kubernetes/Helm и пакеты для Linux.Что нужно, чтобы отправлять в него профили?Вы встраиваете в приложение Pyroscope SDK (push), Grafana Alloy (pull или push) или OTLP из совместимых с OpenTelemetry источников, например, eBPF-профилировщика OpenTelemetry. Поддерживаемые языки включают Go, Java, Python, Ruby, Node.js, .NET, eBPF и Rust.
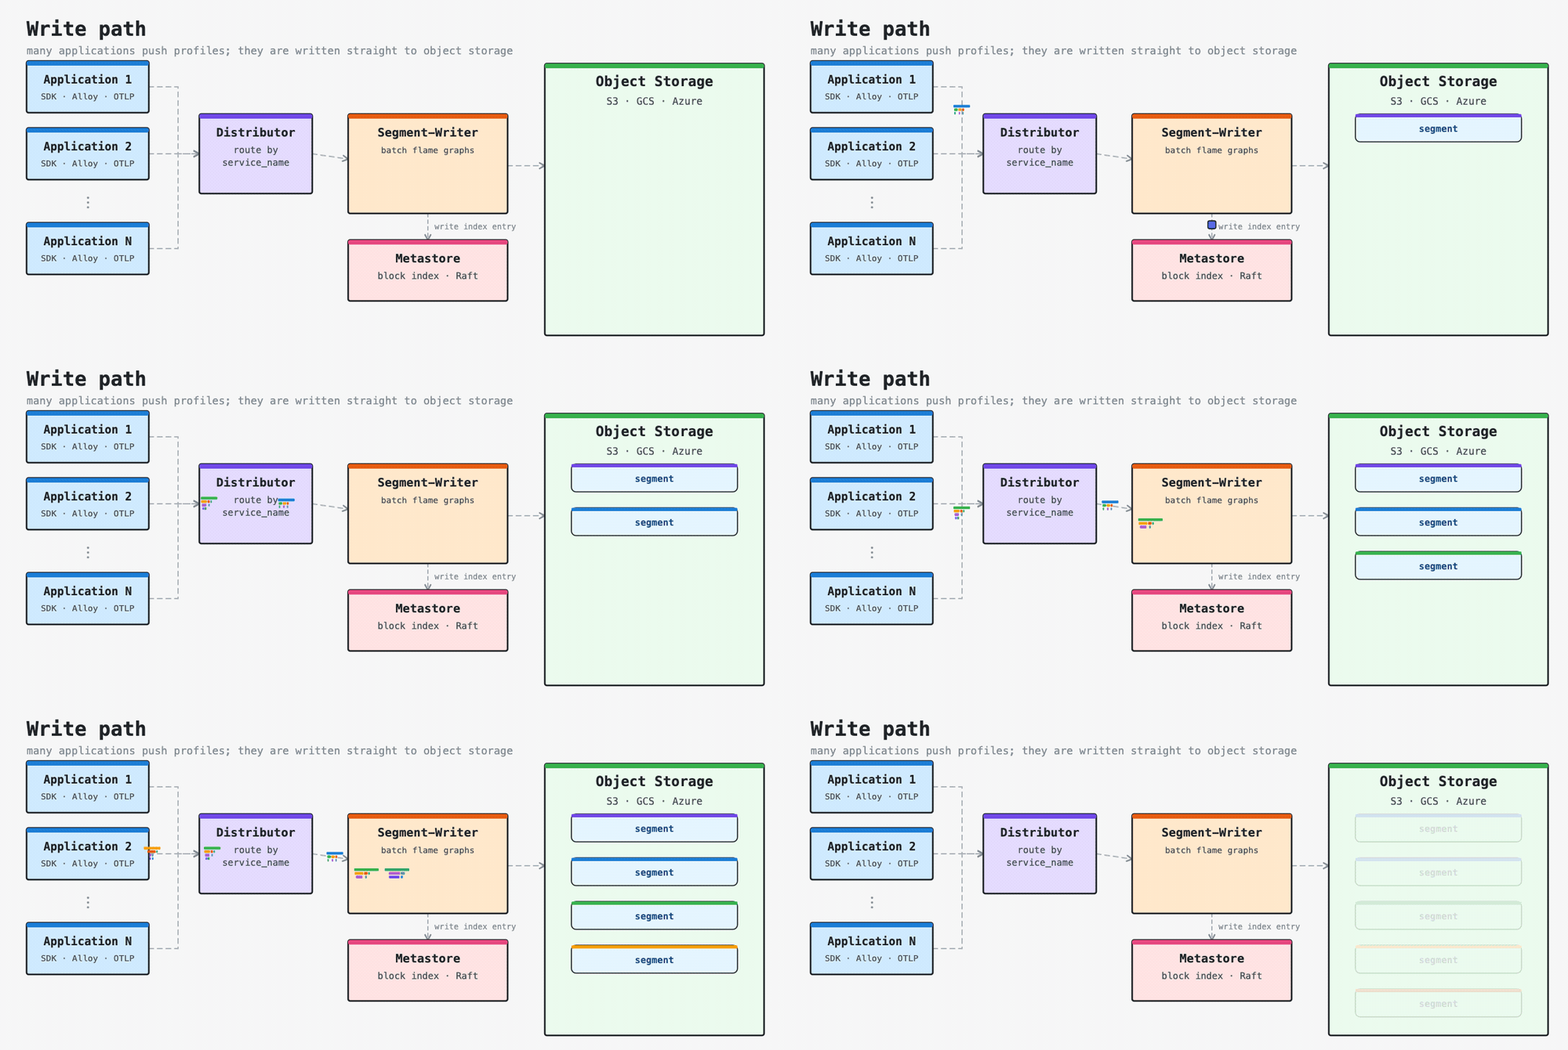
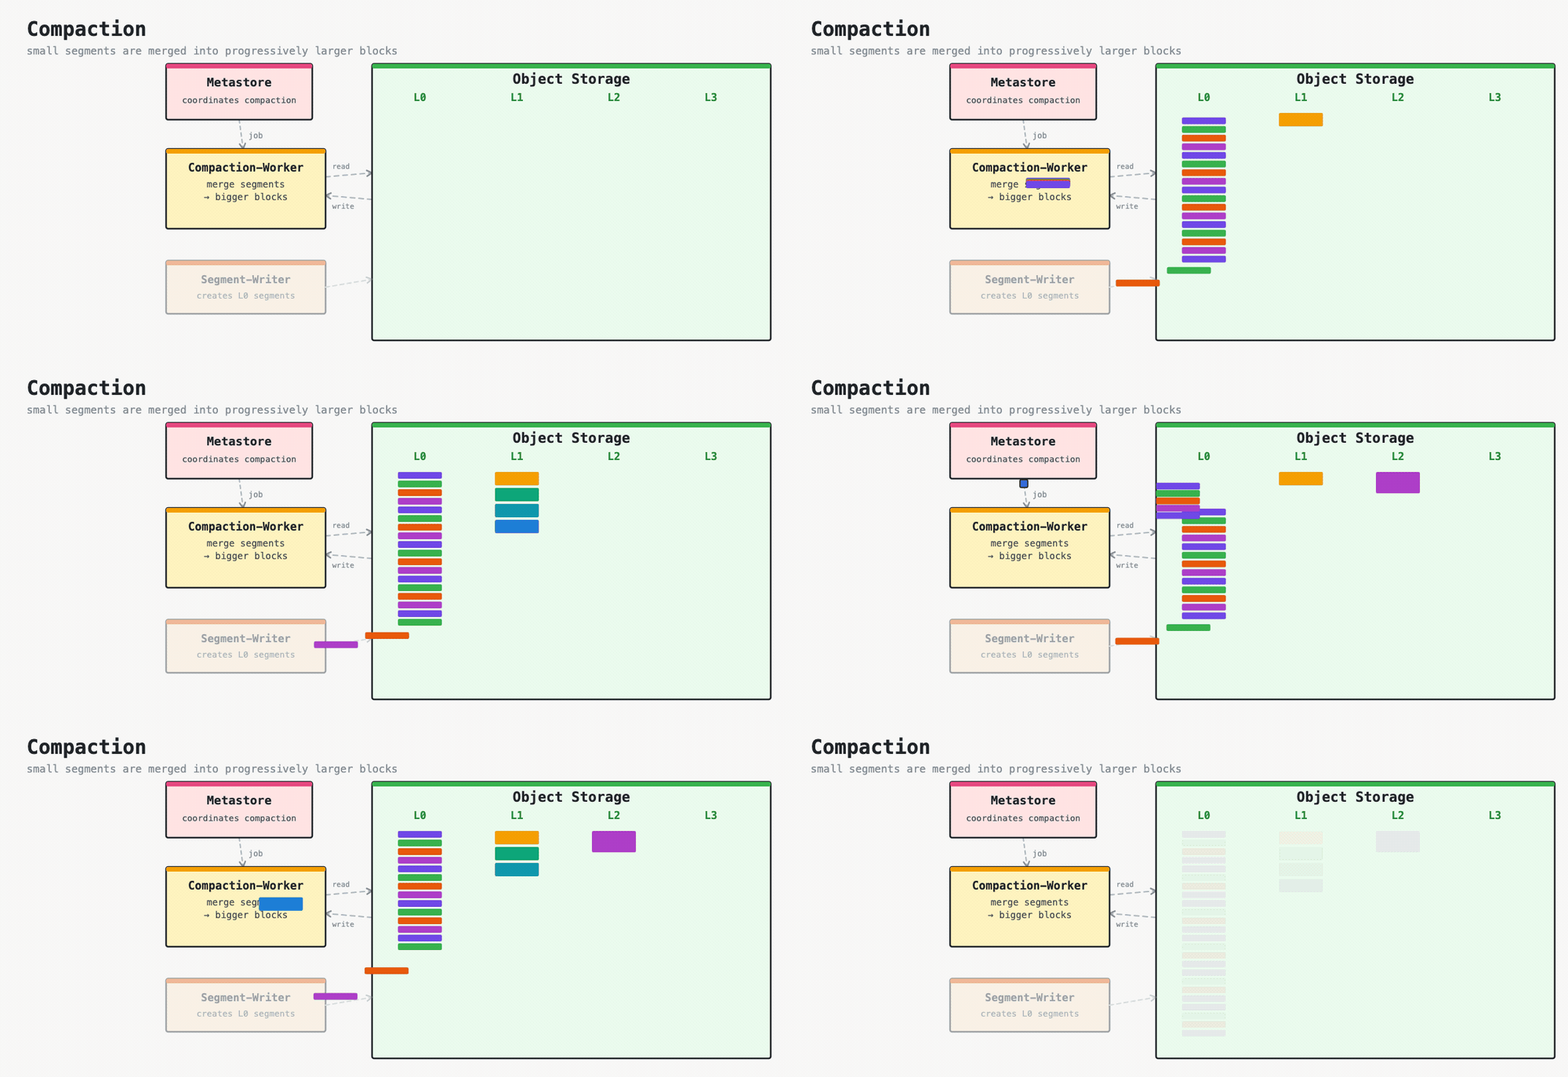
Вы встраиваете в приложение Pyroscope SDK (push), Grafana Alloy (pull или push) или OTLP из совместимых с OpenTelemetry источников, например, eBPF-профилировщика OpenTelemetry. Поддерживаемые языки включают Go, Java, Python, Ruby, Node.js, .NET, eBPF и Rust.Что изменилось в архитектуре 2.0 и нужно ли мигрировать?Pyroscope 2.0 записывает профили напрямую в объектное хранилище вместо ингестеров, работающих в памяти, и локальных дисков. Это упрощает эксплуатацию и снижает потребление ресурсов при большом масштабе. Существующие развертывания v1 могут перейти на новую архитектуру через флаг и мигрировать без потери данных.
Pyroscope 2.0 записывает профили напрямую в объектное хранилище вместо ингестеров, работающих в памяти, и локальных дисков. Это упрощает эксплуатацию и снижает потребление ресурсов при большом масштабе. Существующие развертывания v1 могут перейти на новую архитектуру через флаг и мигрировать без потери данных.На каких платформах можно запустить сервер?Сервер работает на Linux и macOS (через Docker, Homebrew или бинарные файлы) и может быть развернут в Kubernetes/Helm. Он написан на Go, поэтому доступны сборки под разные платформы.
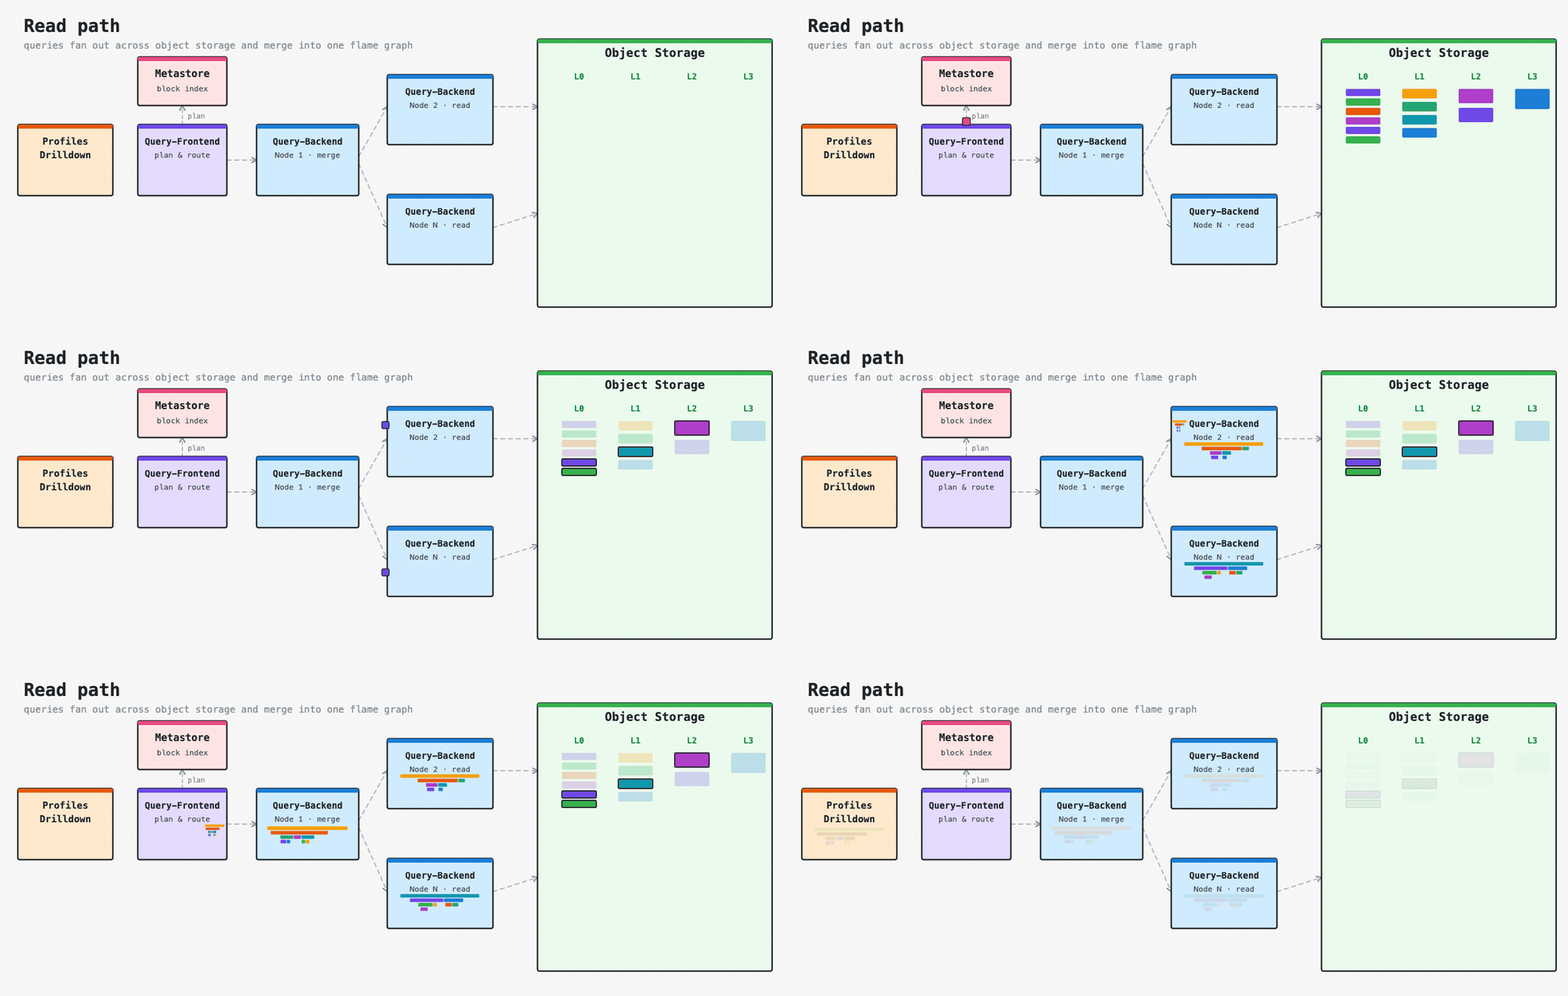
Сервер работает на Linux и macOS (через Docker, Homebrew или бинарные файлы) и может быть развернут в Kubernetes/Helm. Он написан на Go, поэтому доступны сборки под разные платформы.Как визуализировать данные профилирования после сбора?Используйте Grafana Profiles Drilldown (ранее Explore Profiles) — встроенный в Grafana интерфейс без запросов для визуализации и анализа флеймграфов по данным Pyroscope.
Используйте Grafana Profiles Drilldown (ранее Explore Profiles) — встроенный в Grafana интерфейс без запросов для визуализации и анализа флеймграфов по данным Pyroscope.Кто стоит за техниками профилирования, которые здесь используются?Pyroscope отдаёт должное пионерам, таким как Brendan Gregg (изобретатель флеймграфов), Julia Evans (rbspy), Ben Frederickson (py-spy) и Adam Saponara (phpspy). Их сэмплирующие профилировщики и визуализации лежат в основе проекта.
Pyroscope отдаёт должное пионерам, таким как Brendan Gregg (изобретатель флеймграфов), Julia Evans (rbspy), Ben Frederickson (py-spy) и Adam Saponara (phpspy). Их сэмплирующие профилировщики и визуализации лежат в основе проекта.Можно ли попробовать без установки?Да, в README есть ссылка на Pyroscope Live Demo, где можно изучить интерфейс и флеймграфы до настройки собственного сервера.
Да, в README есть ссылка на Pyroscope Live Demo, где можно изучить интерфейс и флеймграфы до настройки собственного сервера.What are similar projects?VictoriaMetrics, loki, k6, skywalking, grafana, opensre, signoz, openobserve
VictoriaMetrics, loki, k6, skywalking, grafana, opensre, signoz, openobserveWhich topics is it in?apm, profiling, grafana, ruby, observability, agpl, golang, kubernetes, monitoring, hacktoberfest, devops, performance
apm, profiling, grafana, ruby, observability, agpl, golang, kubernetes, monitoring, hacktoberfest, devops, performance