








11.2K ·GitHub
What is this?
 Cytoscape.js is a graph theory (network) library for modeling, visualizing, and analyzing relational data such as biological networks or social networks, usable in the browser or in Node.js.
Cytoscape.js is a graph theory (network) library for modeling, visualizing, and analyzing relational data such as biological networks or social networks, usable in the browser or in Node.js.Is this a UI app or something I embed into my own code?It's a JavaScript library: a graph theory model plus an optional renderer that you embed into your own app, usable for server-side analysis in Node.js or for a rich interactive browser UI.
It's a JavaScript library: a graph theory model plus an optional renderer that you embed into your own app, usable for server-side analysis in Node.js or for a rich interactive browser UI.How do I add it to my project?You can get started with Cytoscape.js in one line of code after installing it via npm. To build the library from source, install Node and npm, then run npm install followed by npm run build.
You can get started with Cytoscape.js in one line of code after installing it via npm. To build the library from source, install Node and npm, then run npm install followed by npm run build.Do I need Node and npm to build or use it?You only need Node and npm if you're building or testing the library from source; the published package itself has no listed runtime dependencies.
You only need Node and npm if you're building or testing the library from source; the published package itself has no listed runtime dependencies.Can I use it for analysis without rendering anything visually?Yes, the renderer is optional, so you can use just the graph theory model for headless, server-side analysis in a Node.js app without any visual output.
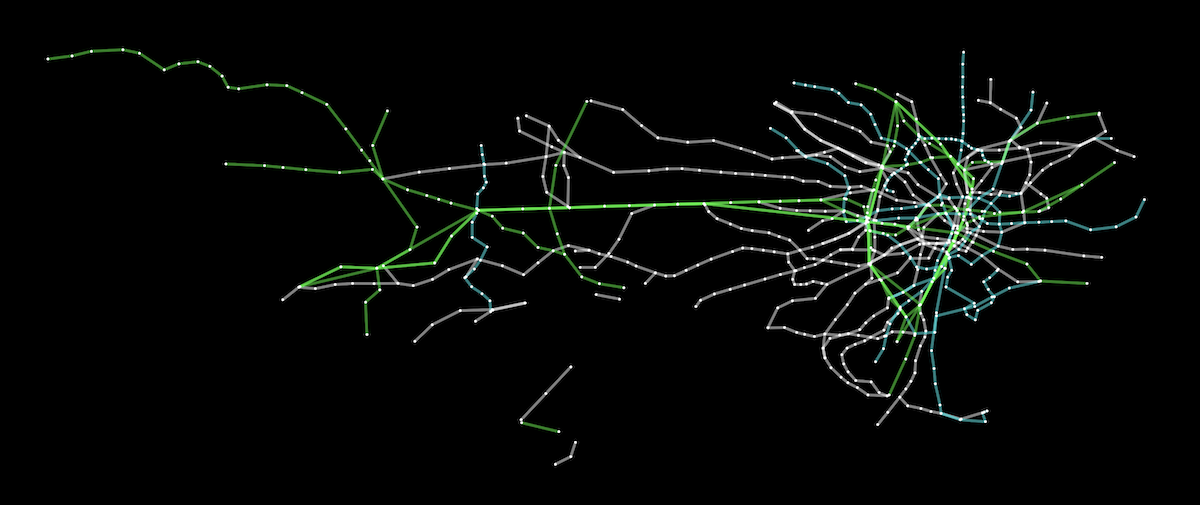
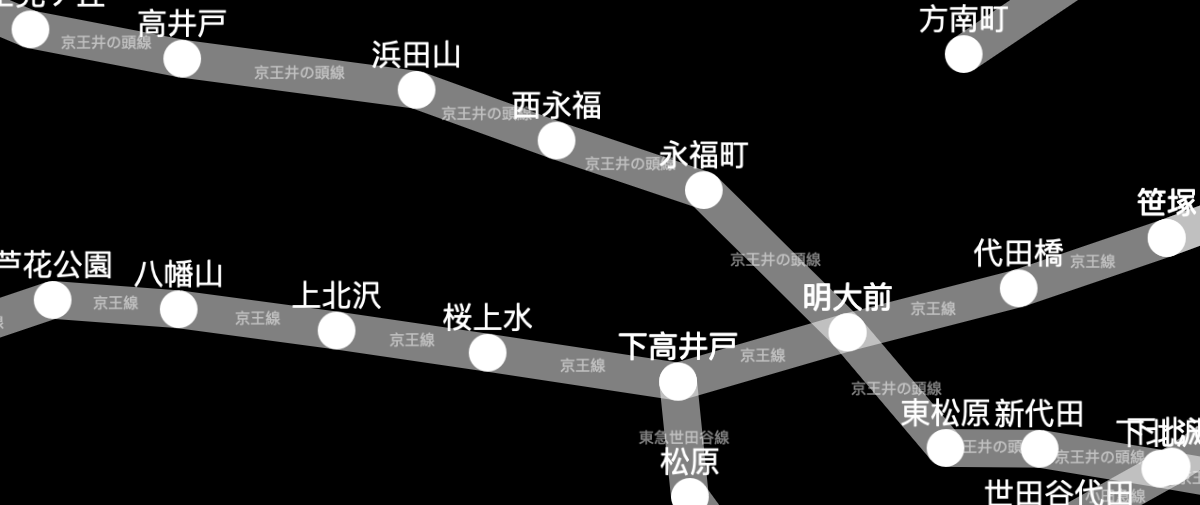
Yes, the renderer is optional, so you can use just the graph theory model for headless, server-side analysis in a Node.js app without any visual output.What's the Tokyo railway demo about?It's a live demo bundled with the docs that visualizes the Tokyo subway stations as an interactive network graph using Cytoscape.js, with source code provided.
It's a live demo bundled with the docs that visualizes the Tokyo subway stations as an interactive network graph using Cytoscape.js, with source code provided.Is this connected to the Cytoscape desktop app used in bioinformatics research?Cytoscape.js shares its academic roots with the Cytoscape research project (created at the University of Toronto, published in Oxford Bioinformatics), but it's a separate standalone JavaScript library for web and Node.js use.
Cytoscape.js shares its academic roots with the Cytoscape research project (created at the University of Toronto, published in Oxford Bioinformatics), but it's a separate standalone JavaScript library for web and Node.js use.How often does the library get updated?Feature releases ship monthly and patch releases ship weekly, so bug fixes and contributions land quickly.
Feature releases ship monthly and patch releases ship weekly, so bug fixes and contributions land quickly.Which topics is it in?graph-visualization, bioinformatics, network-analysis, renderer, analysis, esm, network, graph, interactive, visualization, data-visualization, javascript-library
graph-visualization, bioinformatics, network-analysis, renderer, analysis, esm, network, graph, interactive, visualization, data-visualization, javascript-library