12.3K ·GitHub
What is this?
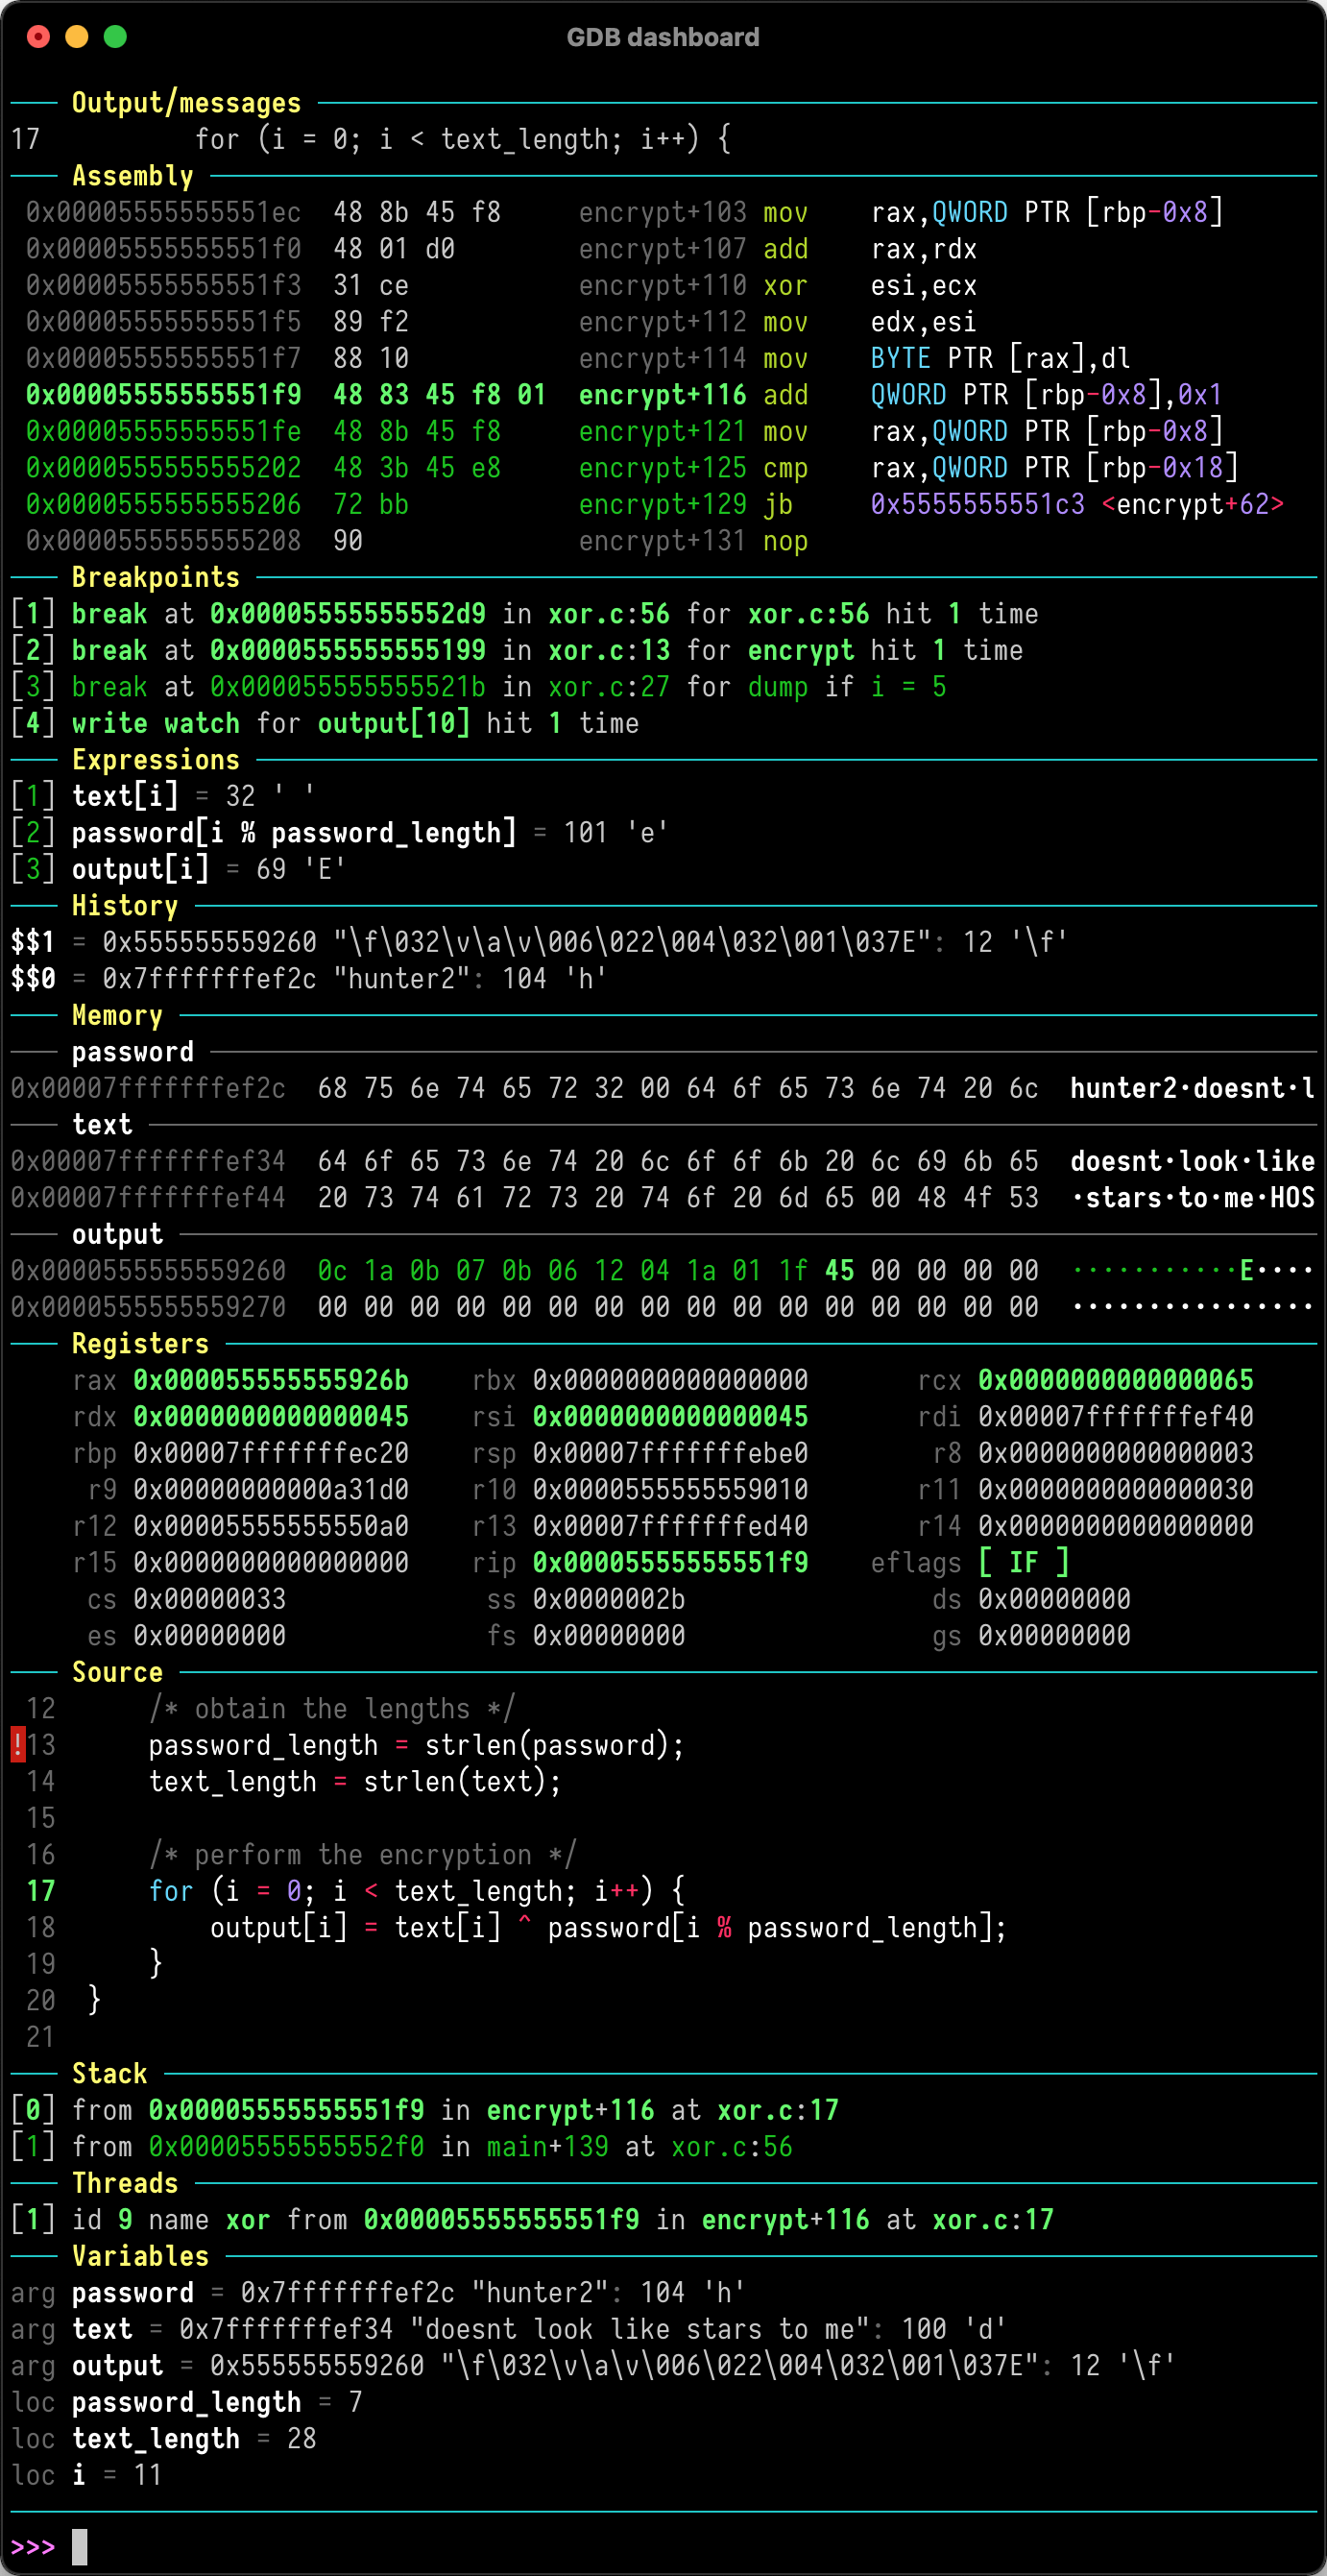
 This is a standalone .gdbinit file that gives GDB a modular visual dashboard, automatically showing the program's state (registers, stack, source, etc.) every time it stops, so you type fewer inspection commands.
This is a standalone .gdbinit file that gives GDB a modular visual dashboard, automatically showing the program's state (registers, stack, source, etc.) every time it stops, so you type fewer inspection commands.Is this a separate app or just a config file for GDB?It's not a separate program - it's a single .gdbinit script written against GDB's Python API that extends GDB itself, rather than a standalone tool you launch.
It's not a separate program - it's a single .gdbinit script written against GDB's Python API that extends GDB itself, rather than a standalone tool you launch.How do I get the dashboard running?Place the project's .gdbinit file in your home directory, then run gdb as usual - the dashboard appears automatically whenever the inferior program stops.
Place the project's .gdbinit file in your home directory, then run gdb as usual - the dashboard appears automatically whenever the inferior program stops.Do I need anything besides GDB itself?You need GDB with its Python API; installing Pygments is optional and only adds syntax highlighting to the displayed code.
You need GDB with its Python API; installing Pygments is optional and only adds syntax highlighting to the displayed code.Does it change any of my existing GDB commands?No - it leaves every standard GDB command untouched and exposes all of its features through the separate 'dashboard' command instead.
No - it leaves every standard GDB command untouched and exposes all of its features through the separate 'dashboard' command instead.Why does it reduce the number of GDB commands I need to type?It shows an overview of relevant program state automatically after every stop, so developers can focus on controlling program flow instead of manually running inspection commands.
It shows an overview of relevant program state automatically after every stop, so developers can focus on controlling program flow instead of manually running inspection commands.Can I customize how the dashboard panels look?The project exposes stylable attributes and lets you divide the terminal into separate panels, so you can adjust layout and appearance of the dashboard.
The project exposes stylable attributes and lets you divide the terminal into separate panels, so you can adjust layout and appearance of the dashboard.What happens if I skip installing Pygments?The dashboard still works fine - you just lose syntax highlighting in sections like the source and disassembly views.
The dashboard still works fine - you just lose syntax highlighting in sections like the source and disassembly views.