


2.3K ·GitHub
What is this?
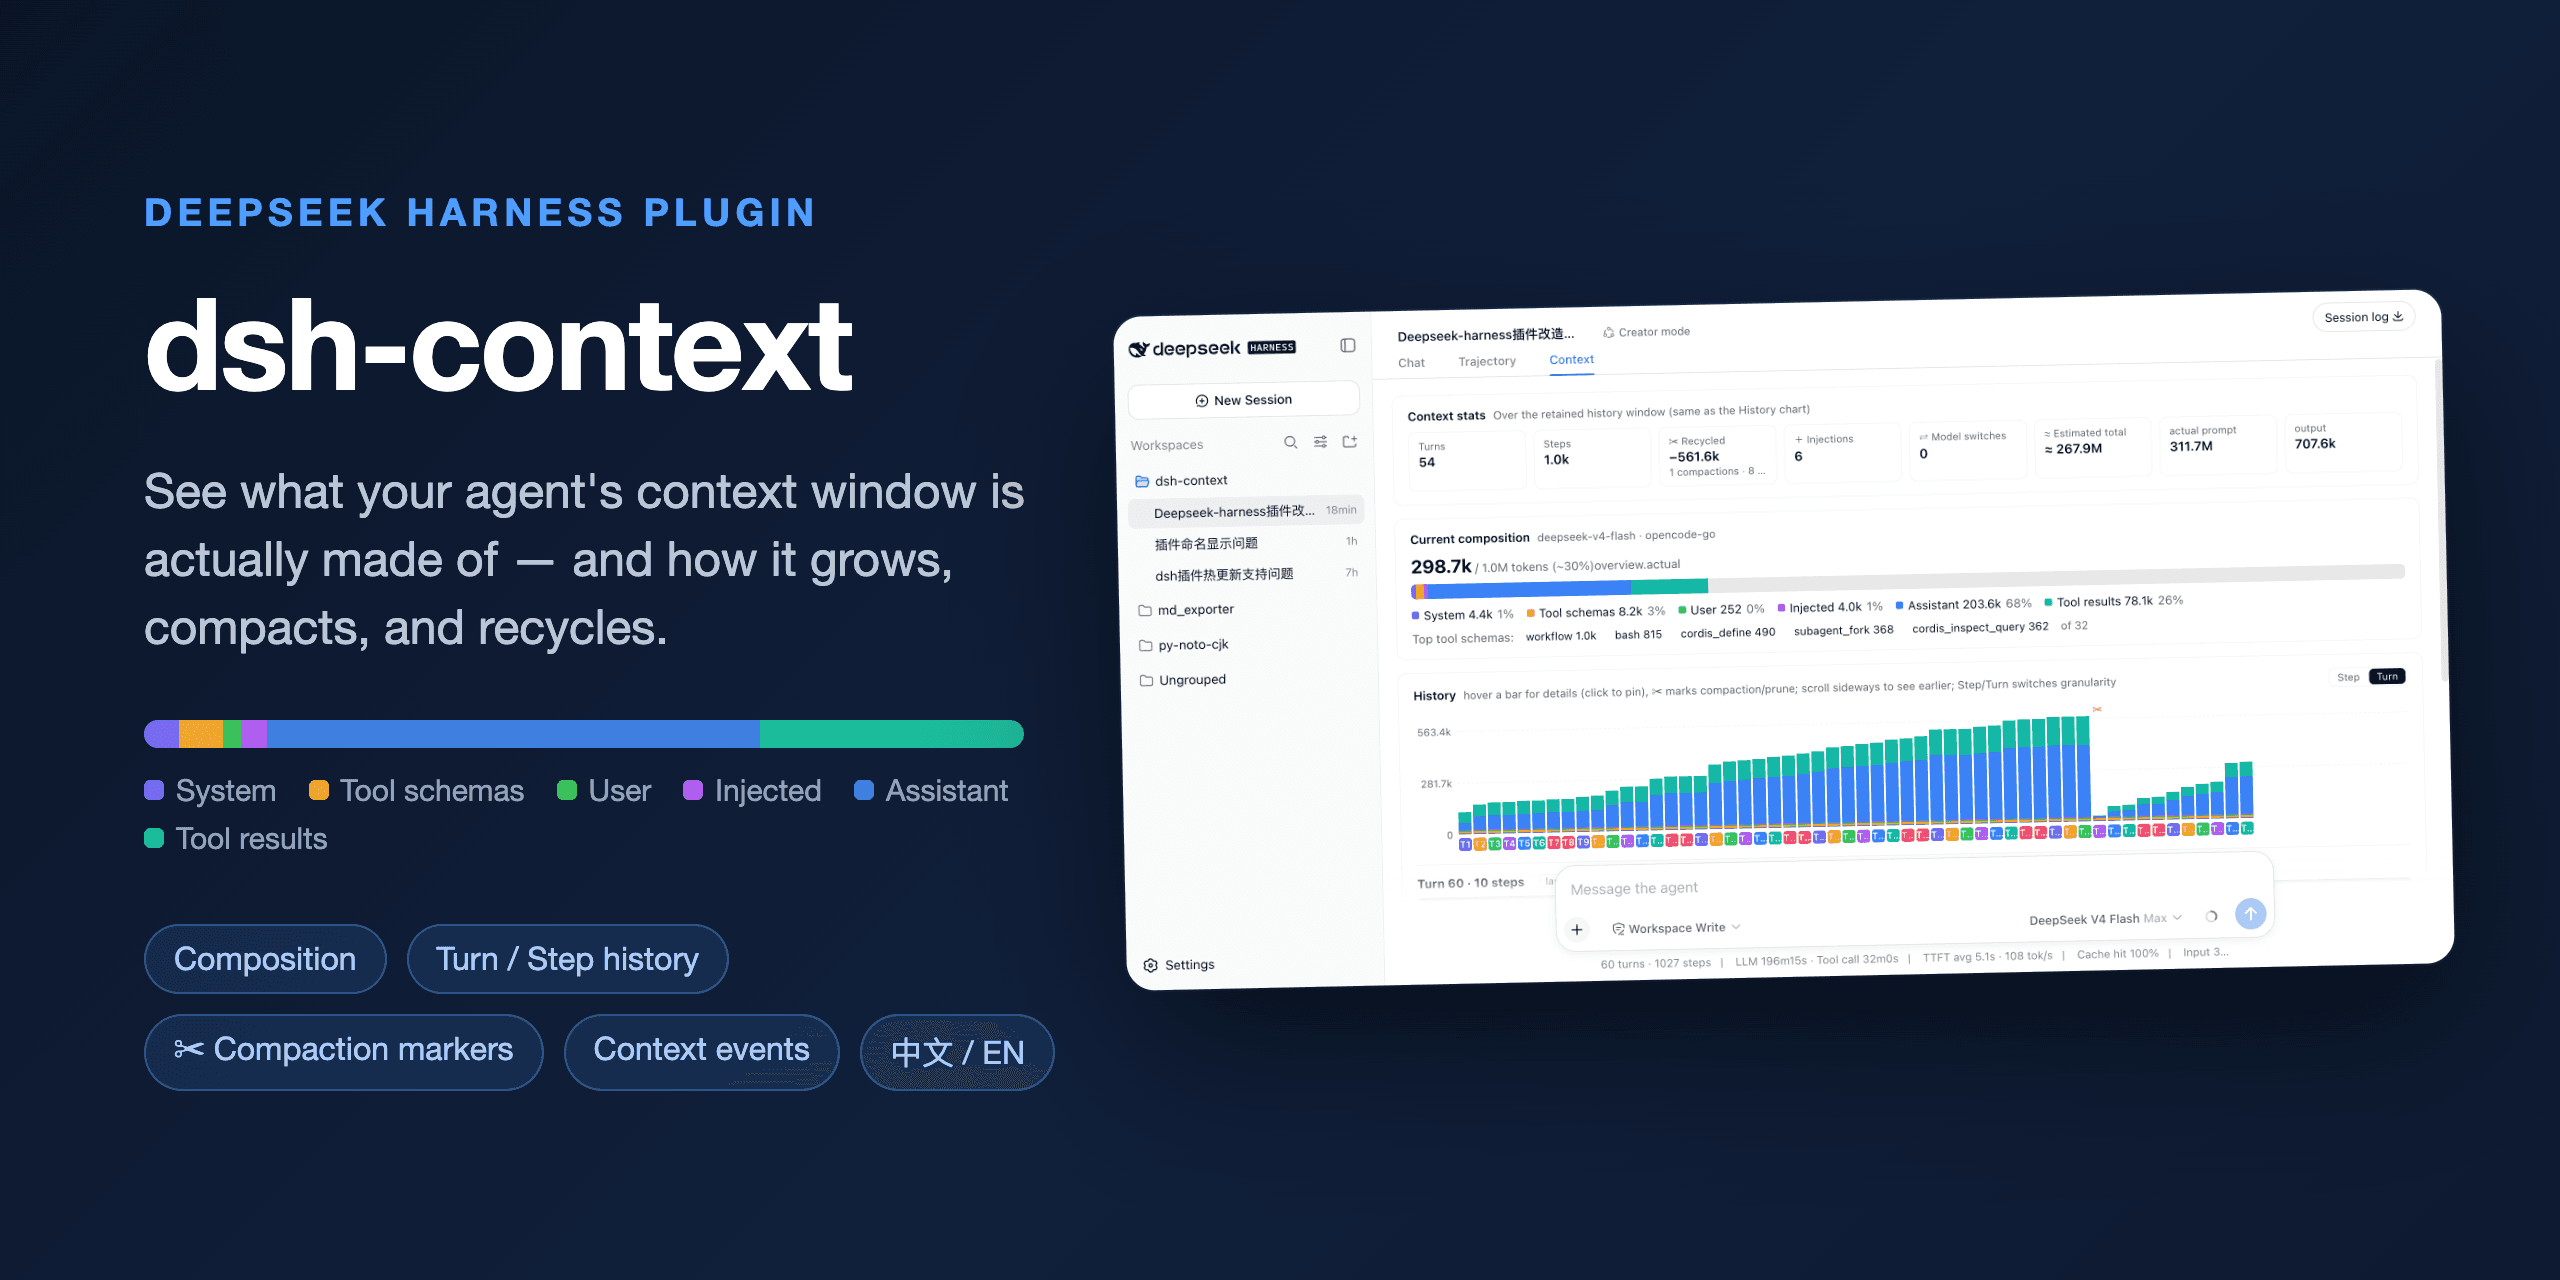
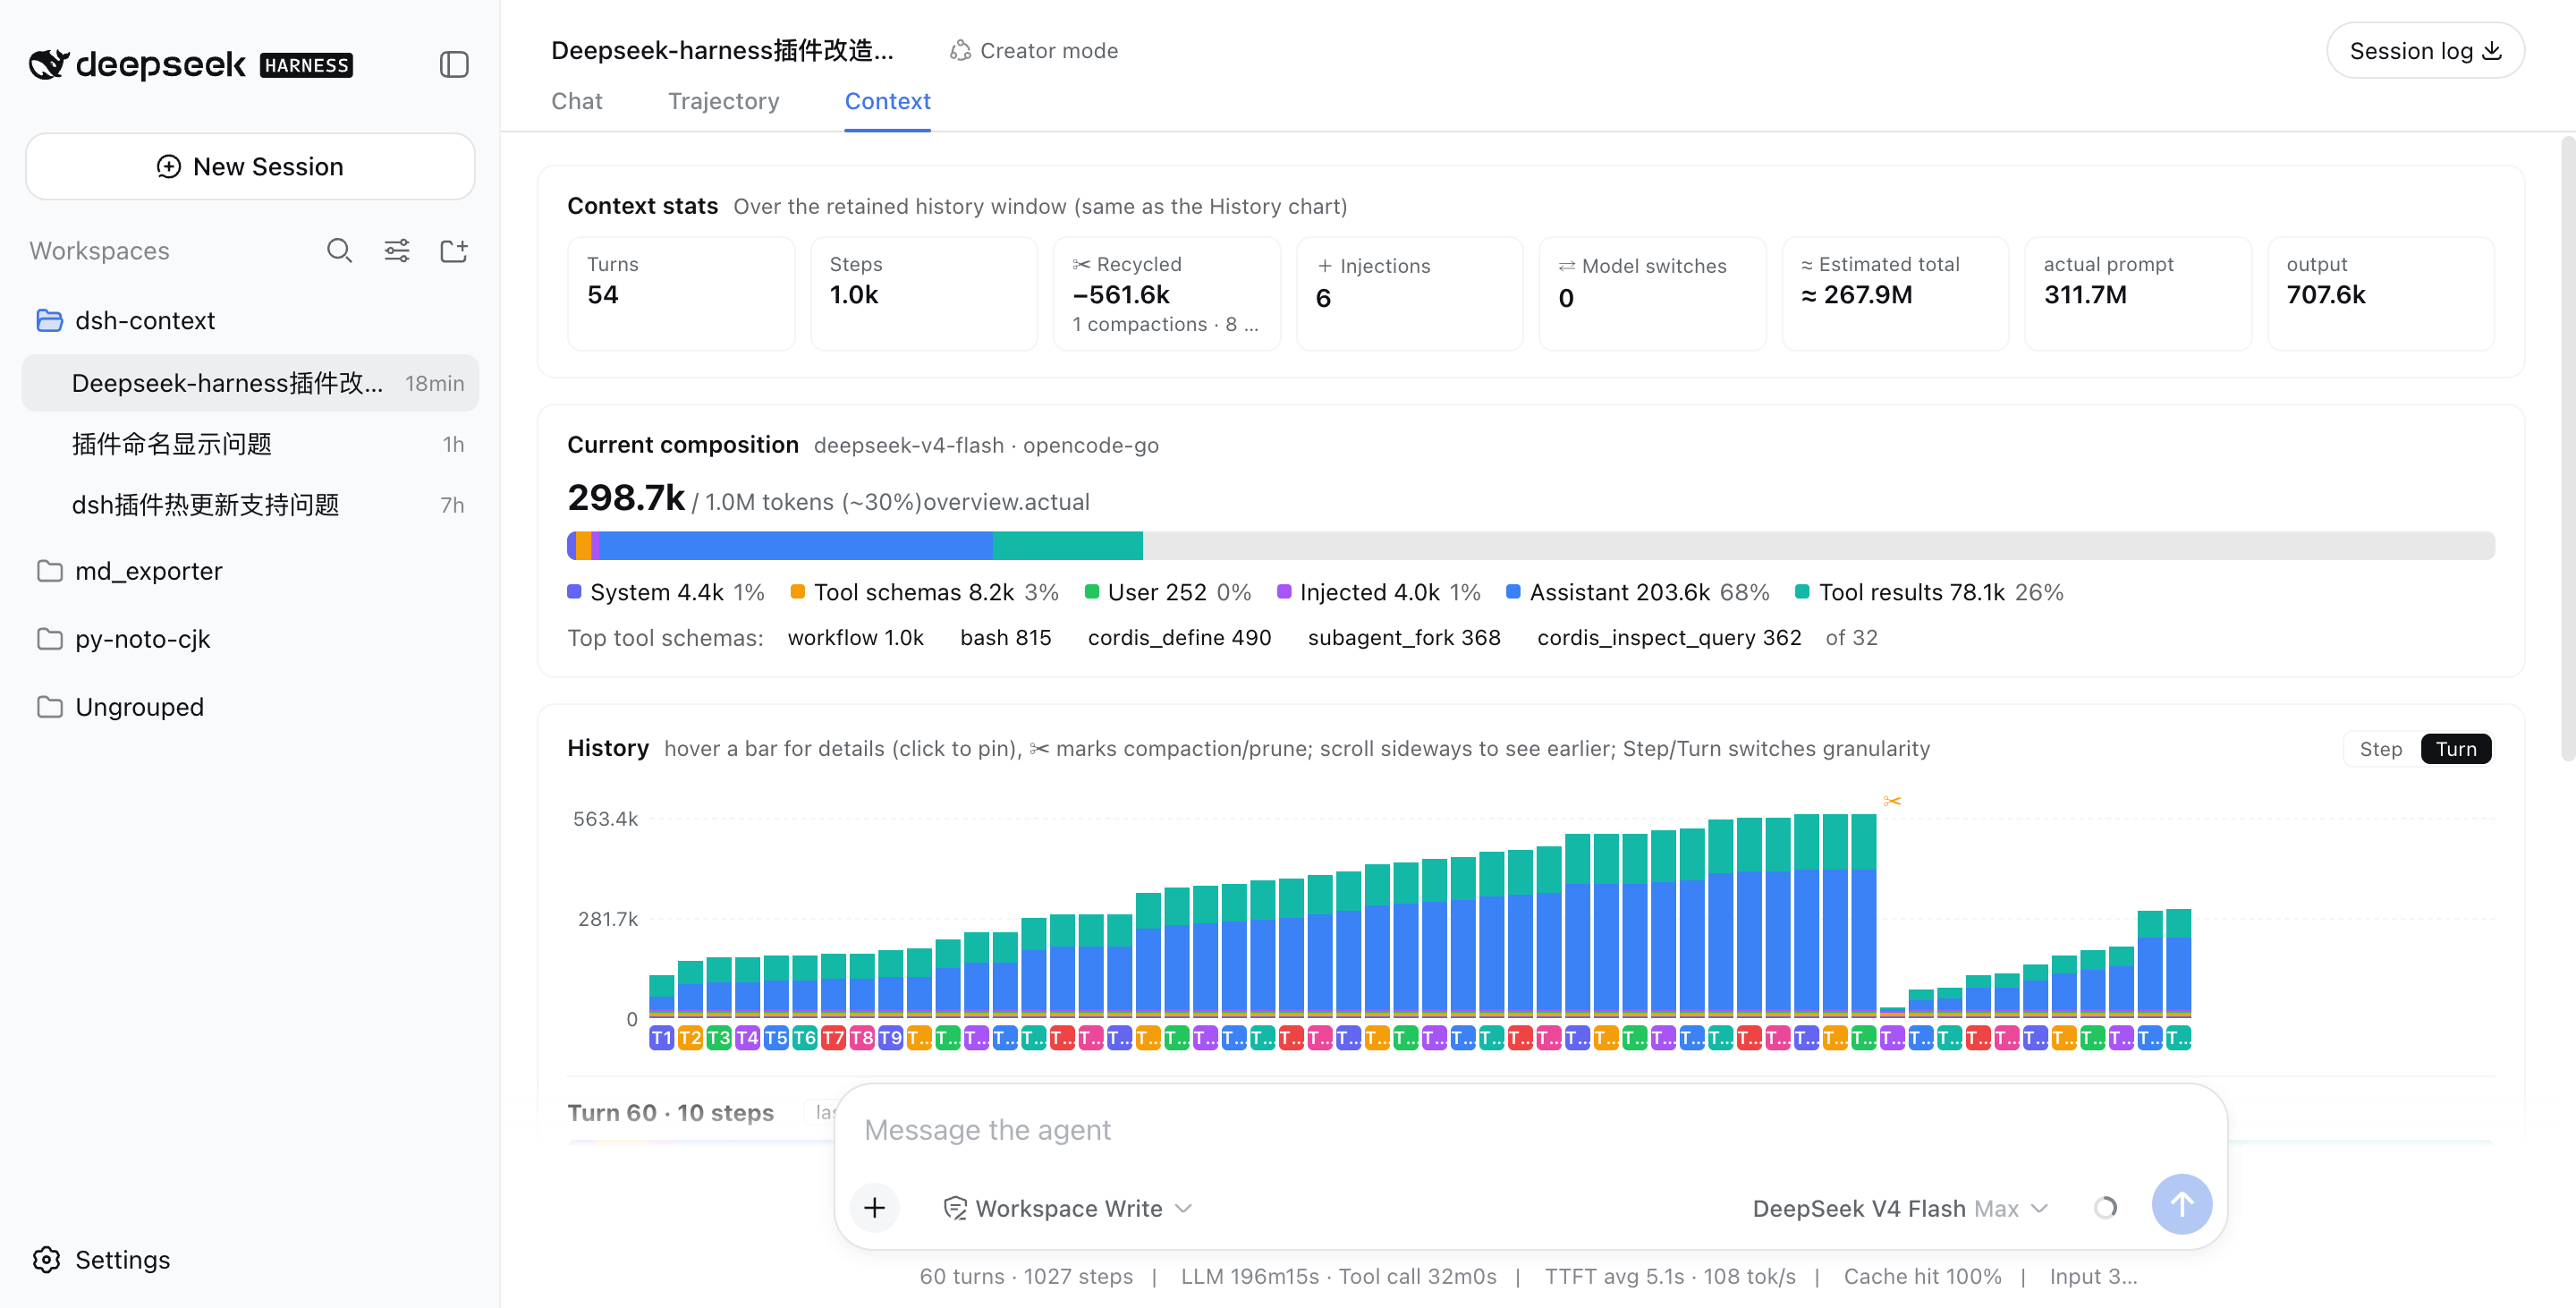
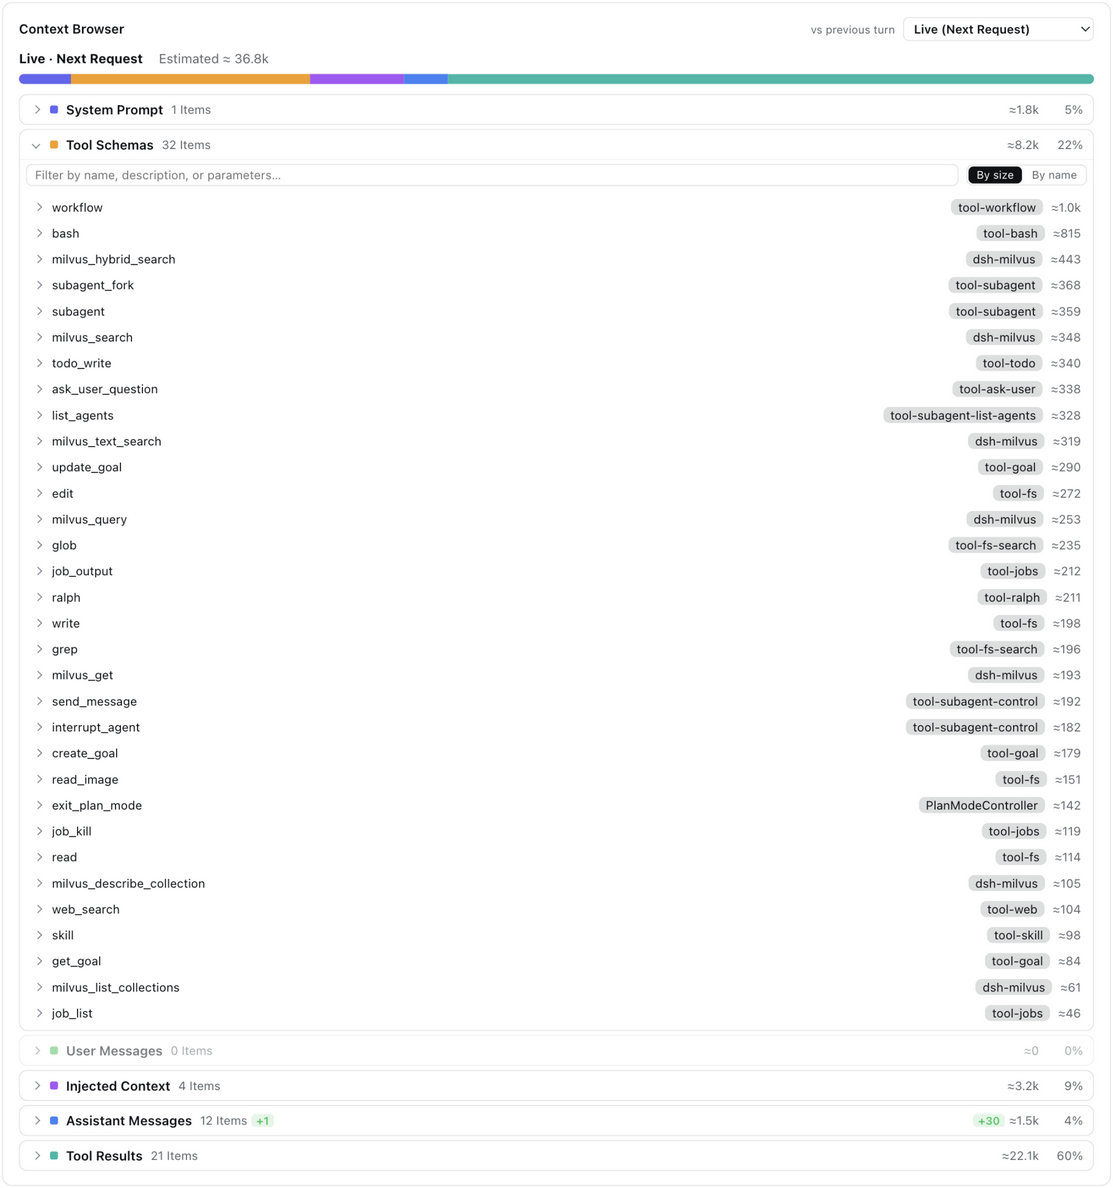
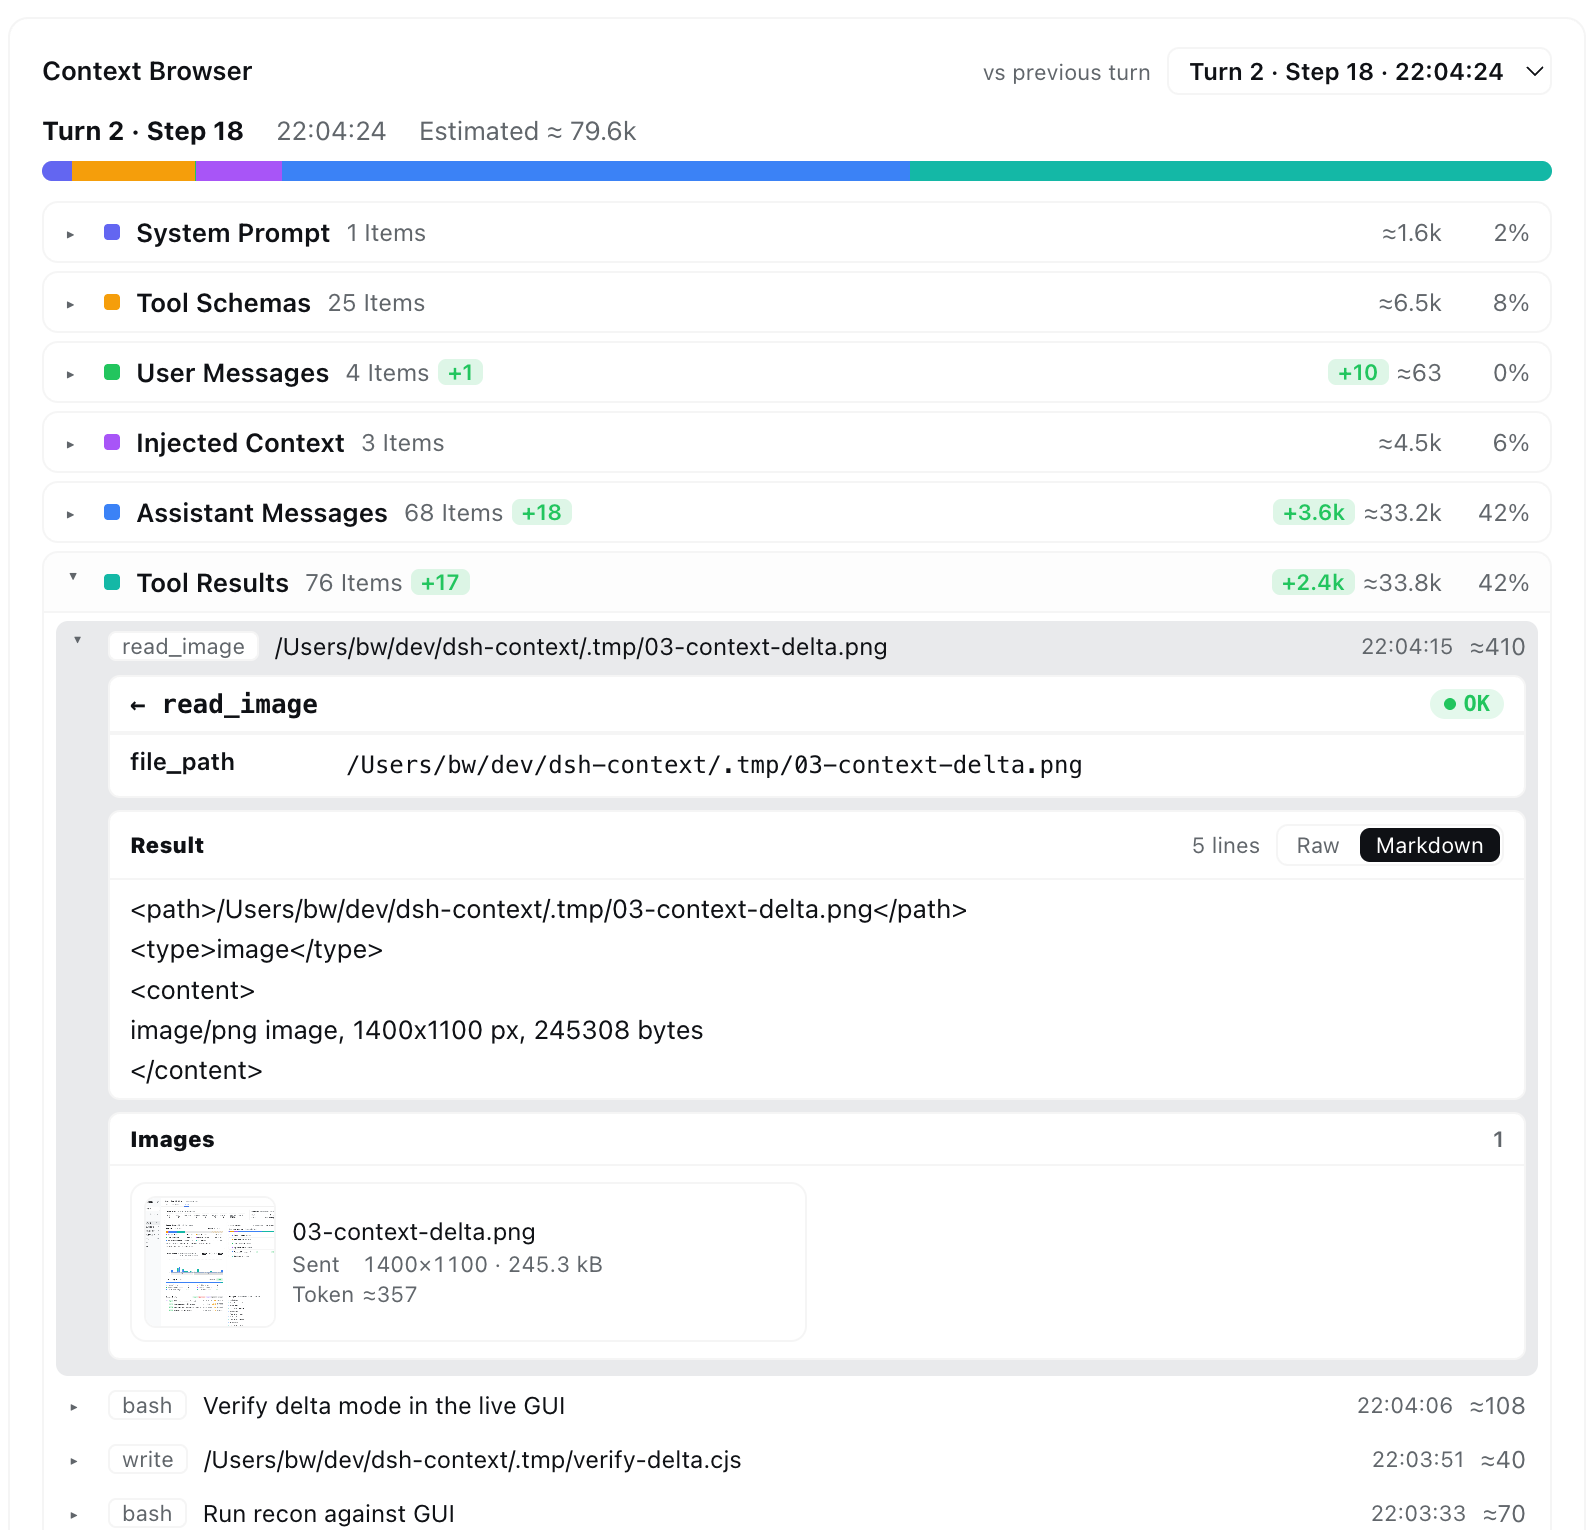
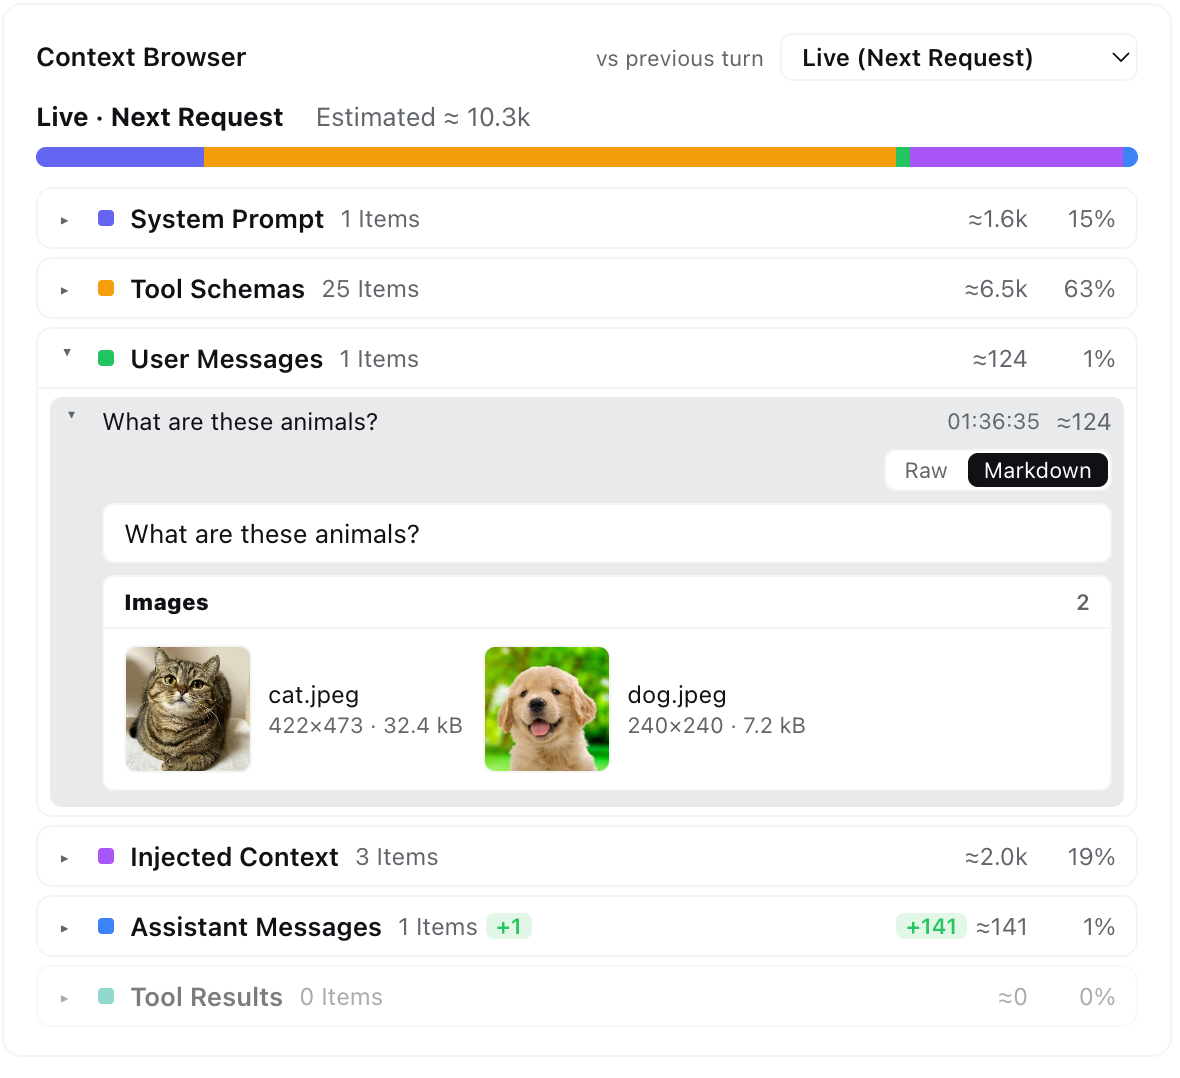
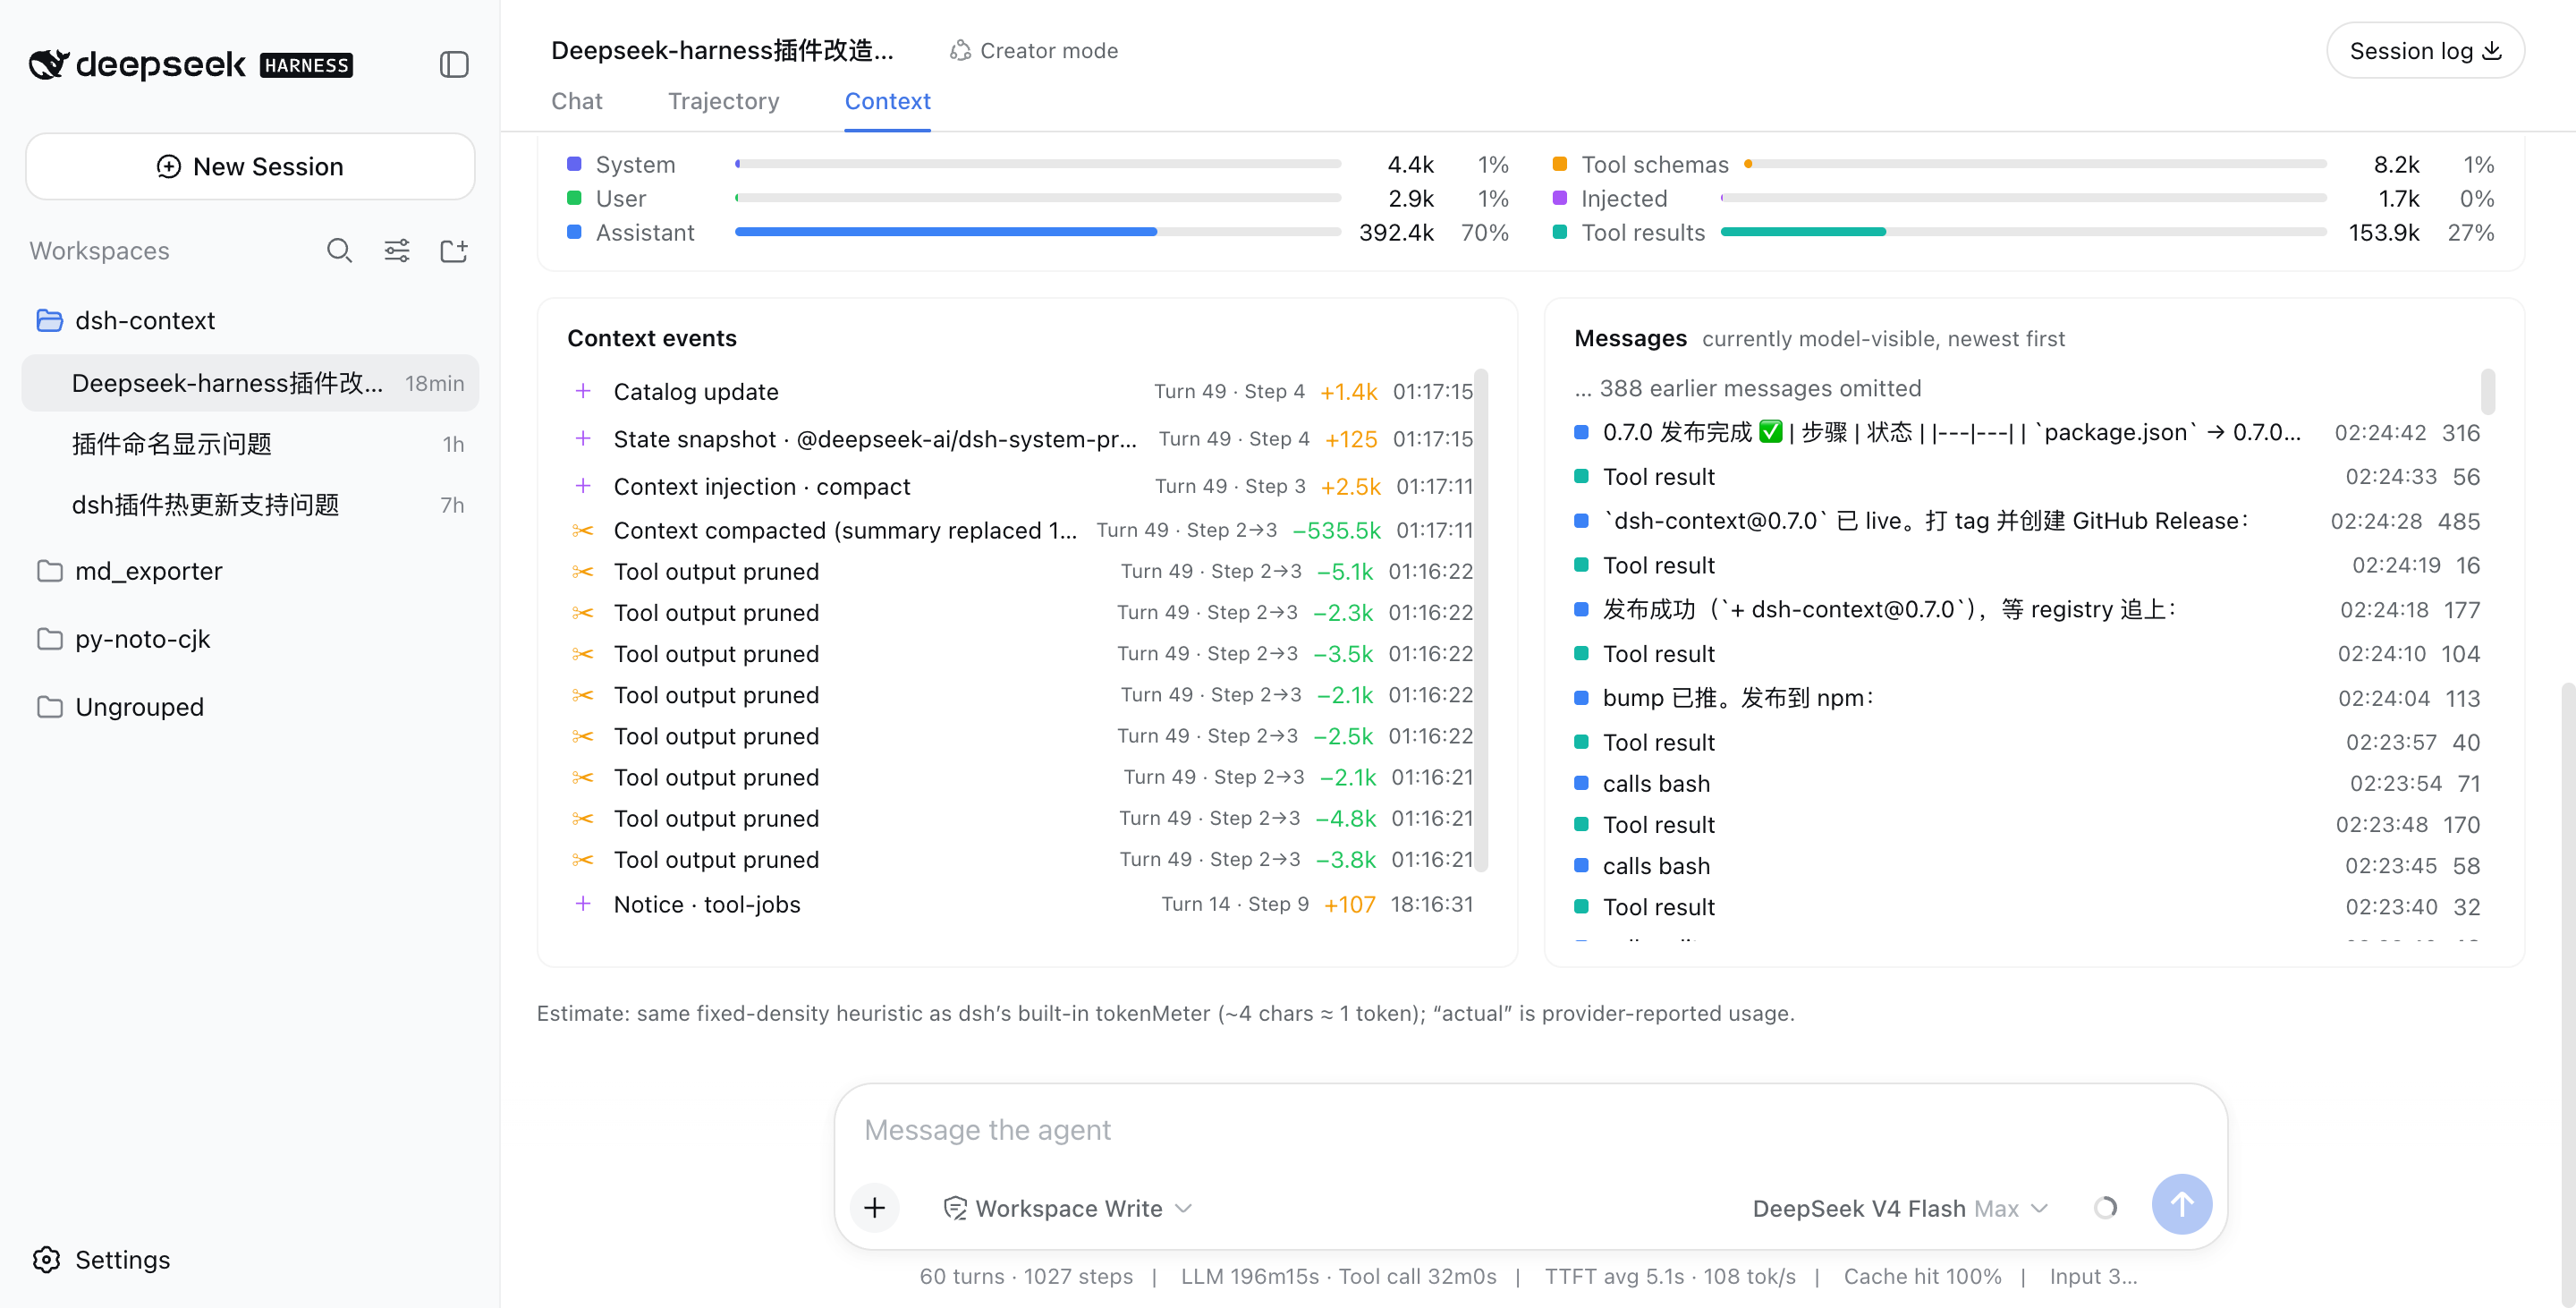
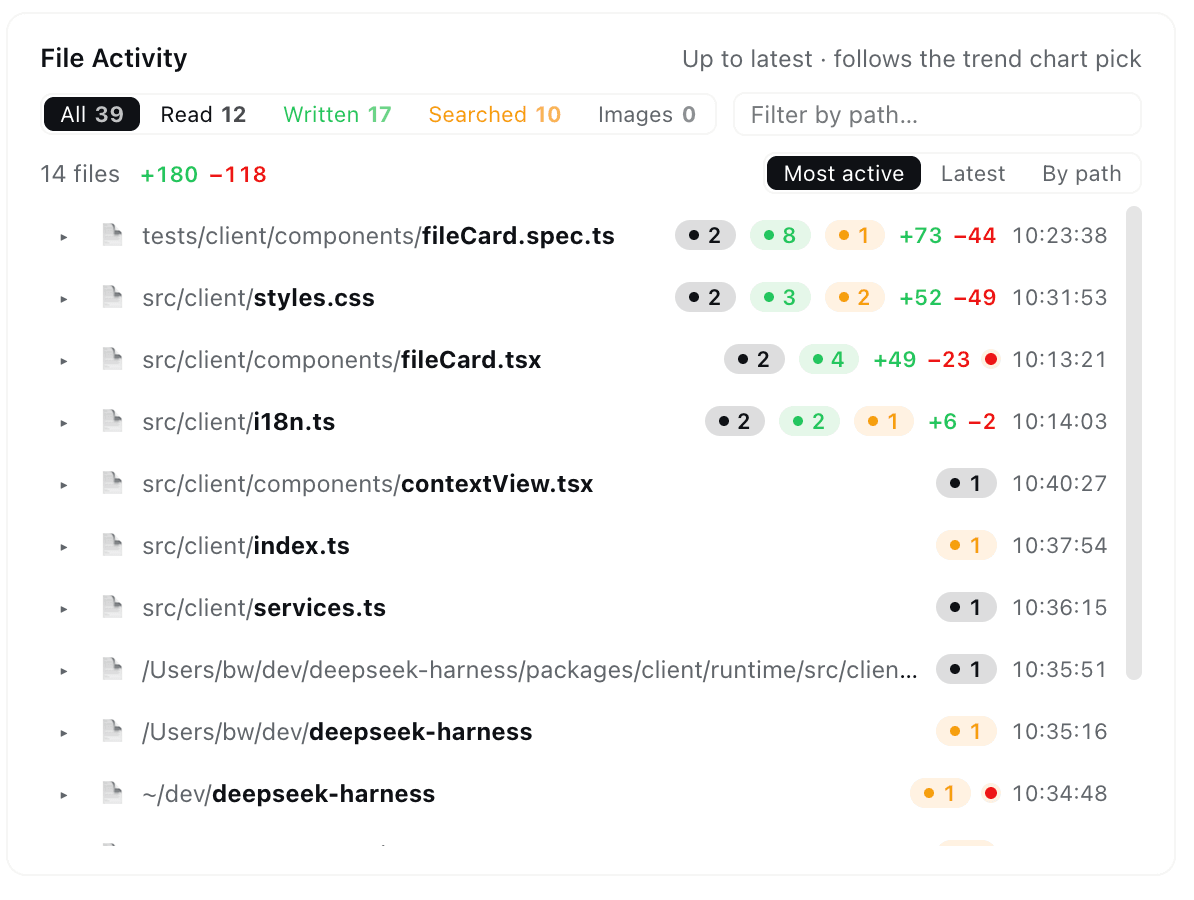
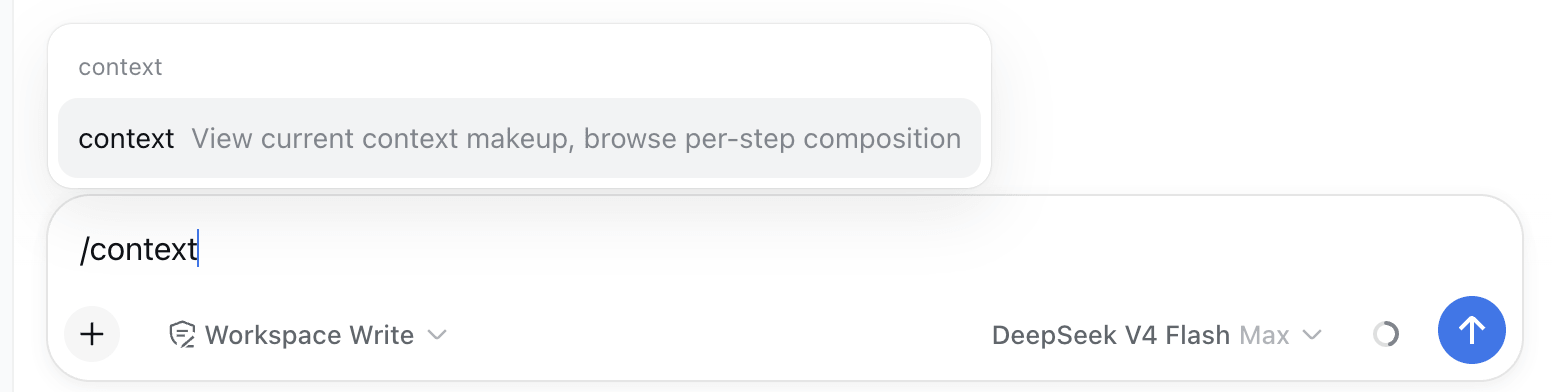
 dsh-context is a plugin for DeepSeek Harness (dsh) that gives full visibility into an AI agent's context window — a dashboard tab, a sidebar panel, and a /context slash command showing token stats, context composition, trends, compaction/prune events, file activity, and the agent family tree.
dsh-context is a plugin for DeepSeek Harness (dsh) that gives full visibility into an AI agent's context window — a dashboard tab, a sidebar panel, and a /context slash command showing token stats, context composition, trends, compaction/prune events, file activity, and the agent family tree.Is this a standalone app, or does it plug into something else?It's a plugin that extends DeepSeek Harness's own web UI — adding a Context tab, a right-sidebar panel, and a /context slash command — rather than a separate application.
It's a plugin that extends DeepSeek Harness's own web UI — adding a Context tab, a right-sidebar panel, and a /context slash command — rather than a separate application.Do I need DeepSeek Harness already set up?Yes — this is purely a plugin for DeepSeek Harness, and it requires @deepseek-ai/dsh version 0.1.2-rc1 or later.
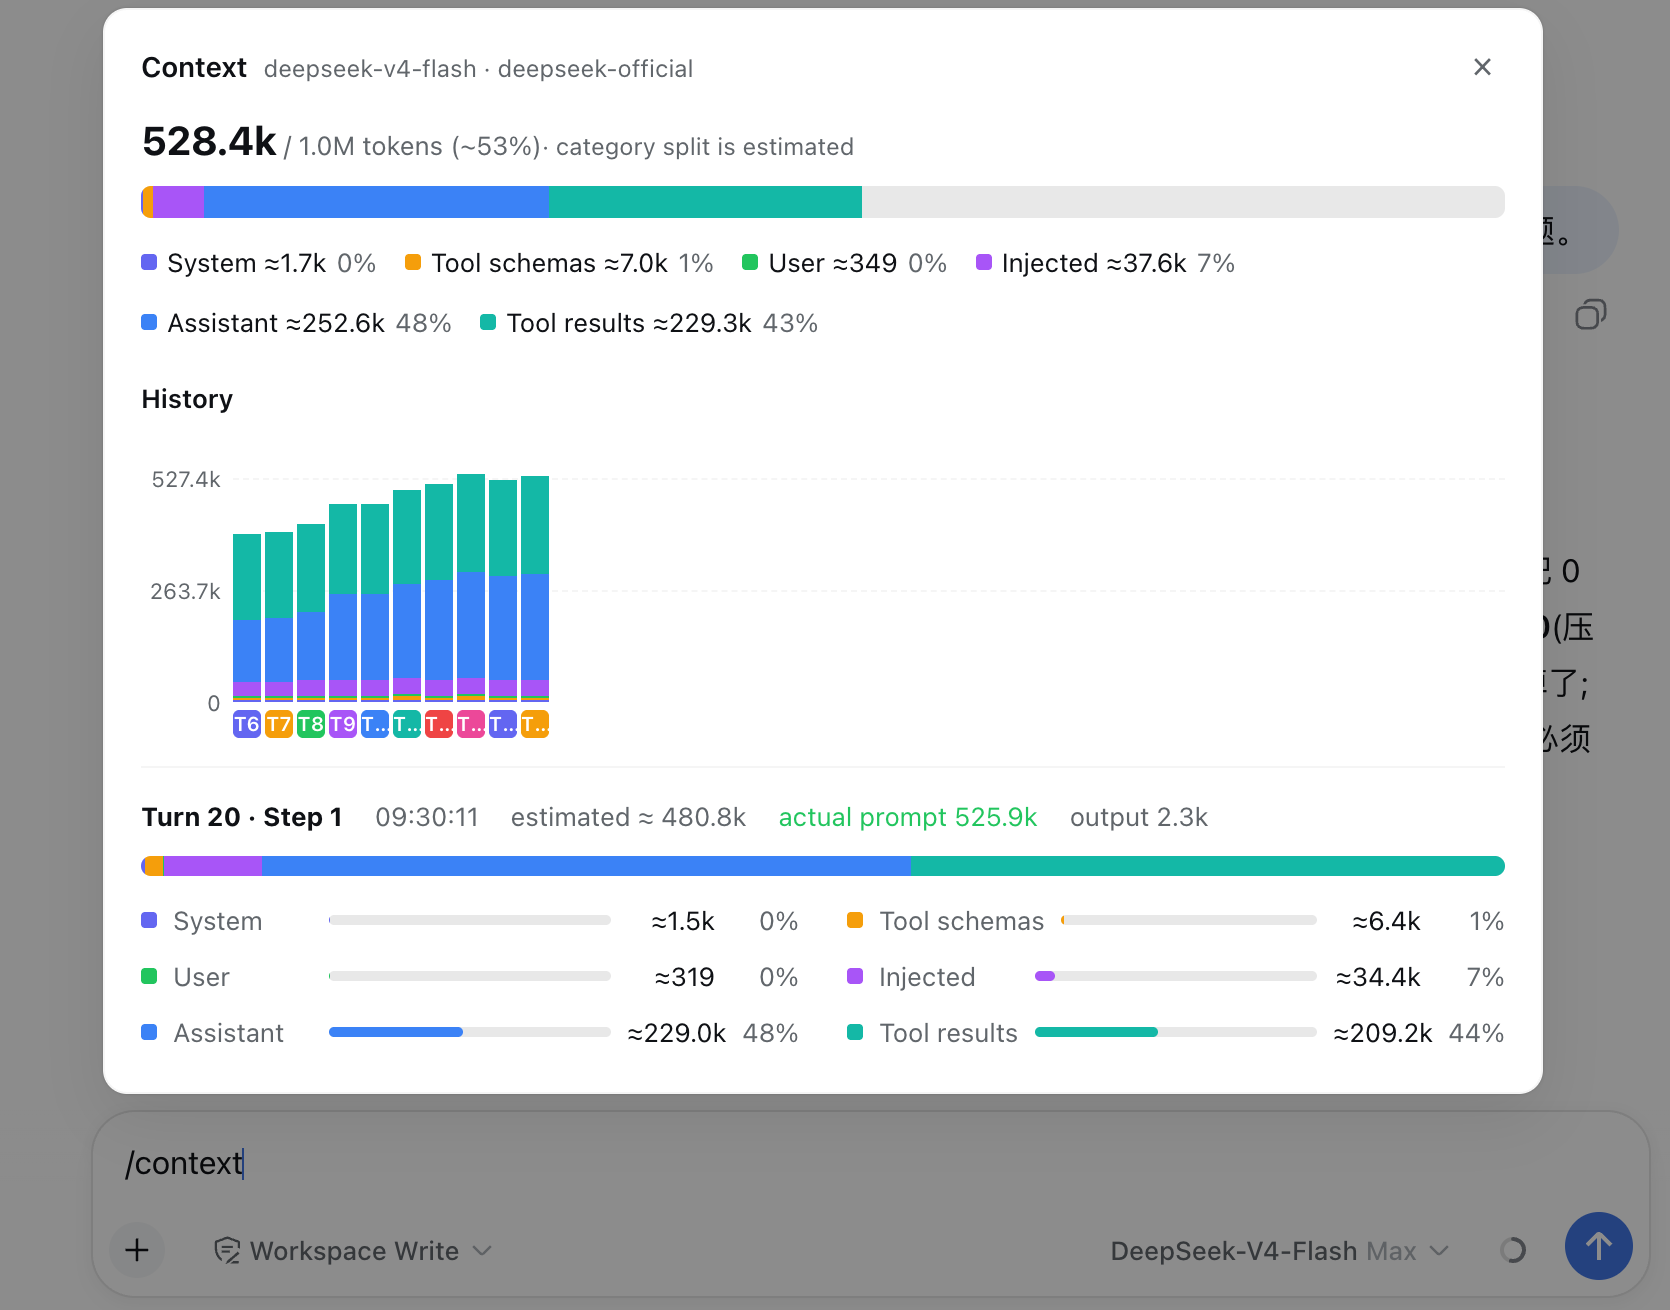
Yes — this is purely a plugin for DeepSeek Harness, and it requires @deepseek-ai/dsh version 0.1.2-rc1 or later.Are the token figures shown exact numbers?Most category breakdowns use dsh's own fixed-density token-estimation heuristic (the same one as its built-in token meter), while provider-reported actual prompt/output/cache numbers are shown alongside pinned trend details for comparison.
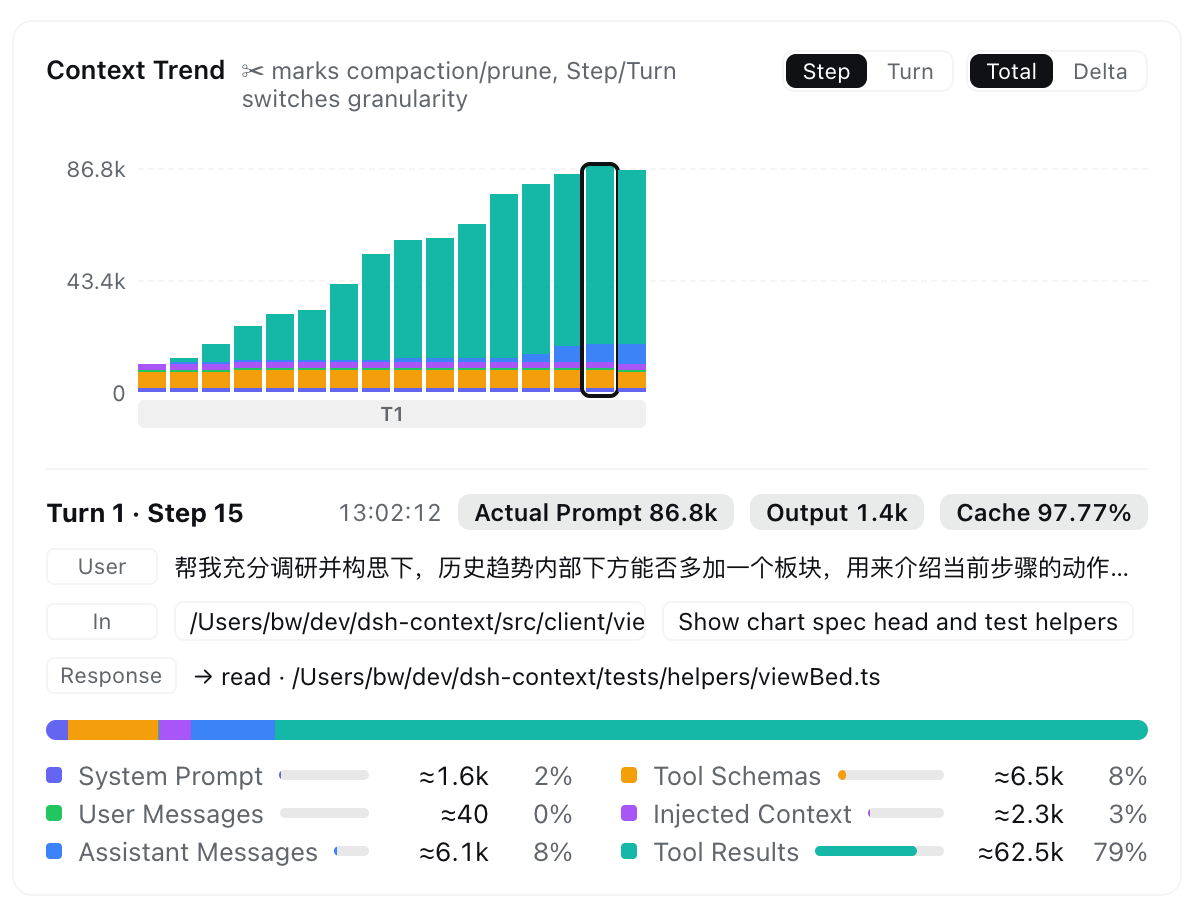
Most category breakdowns use dsh's own fixed-density token-estimation heuristic (the same one as its built-in token meter), while provider-reported actual prompt/output/cache numbers are shown alongside pinned trend details for comparison.What does the Context Trend chart show?One stacked bar per model request showing how the context window grew or shrank turn by turn, with compaction and prune events pinned exactly where they happened, plus a plain-language step brief explaining what entered and left.
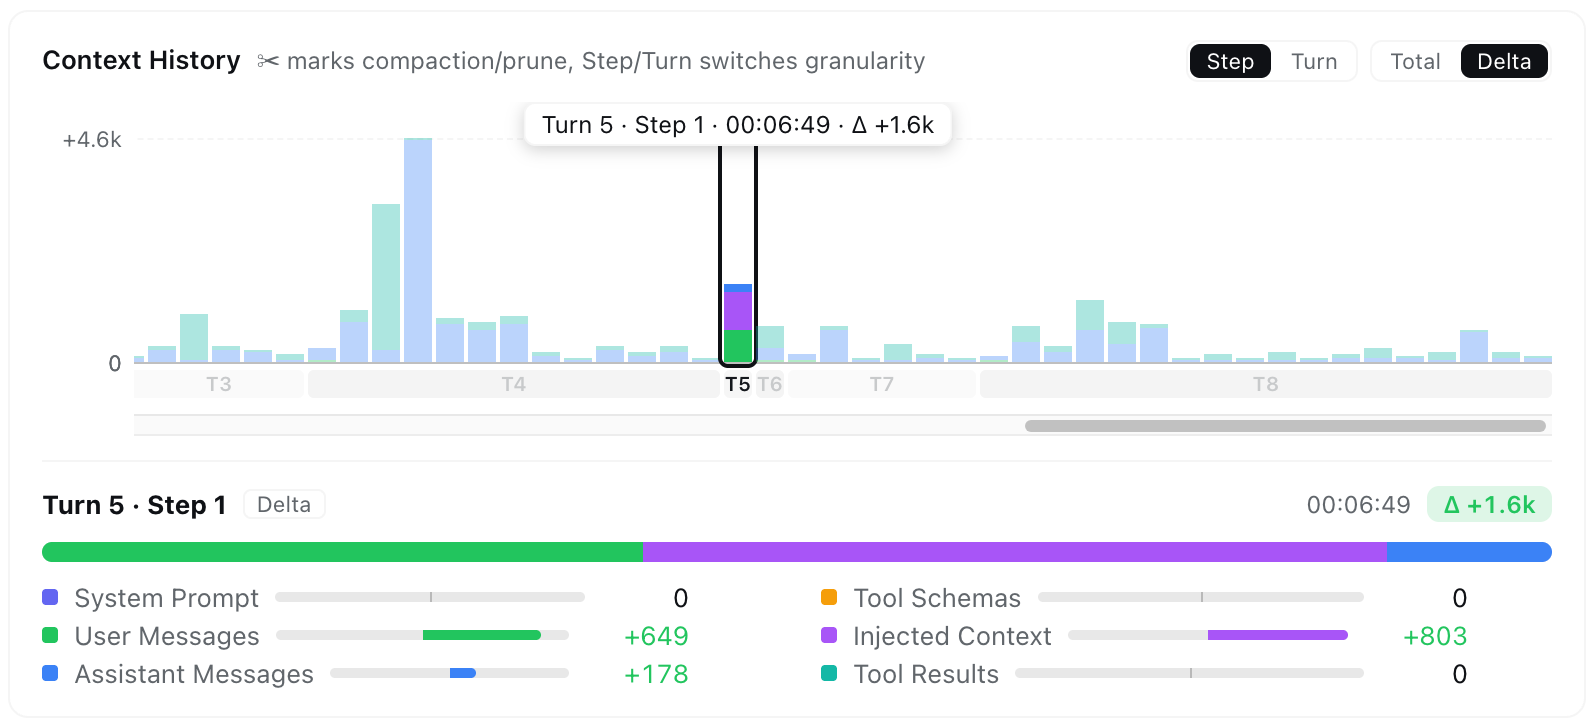
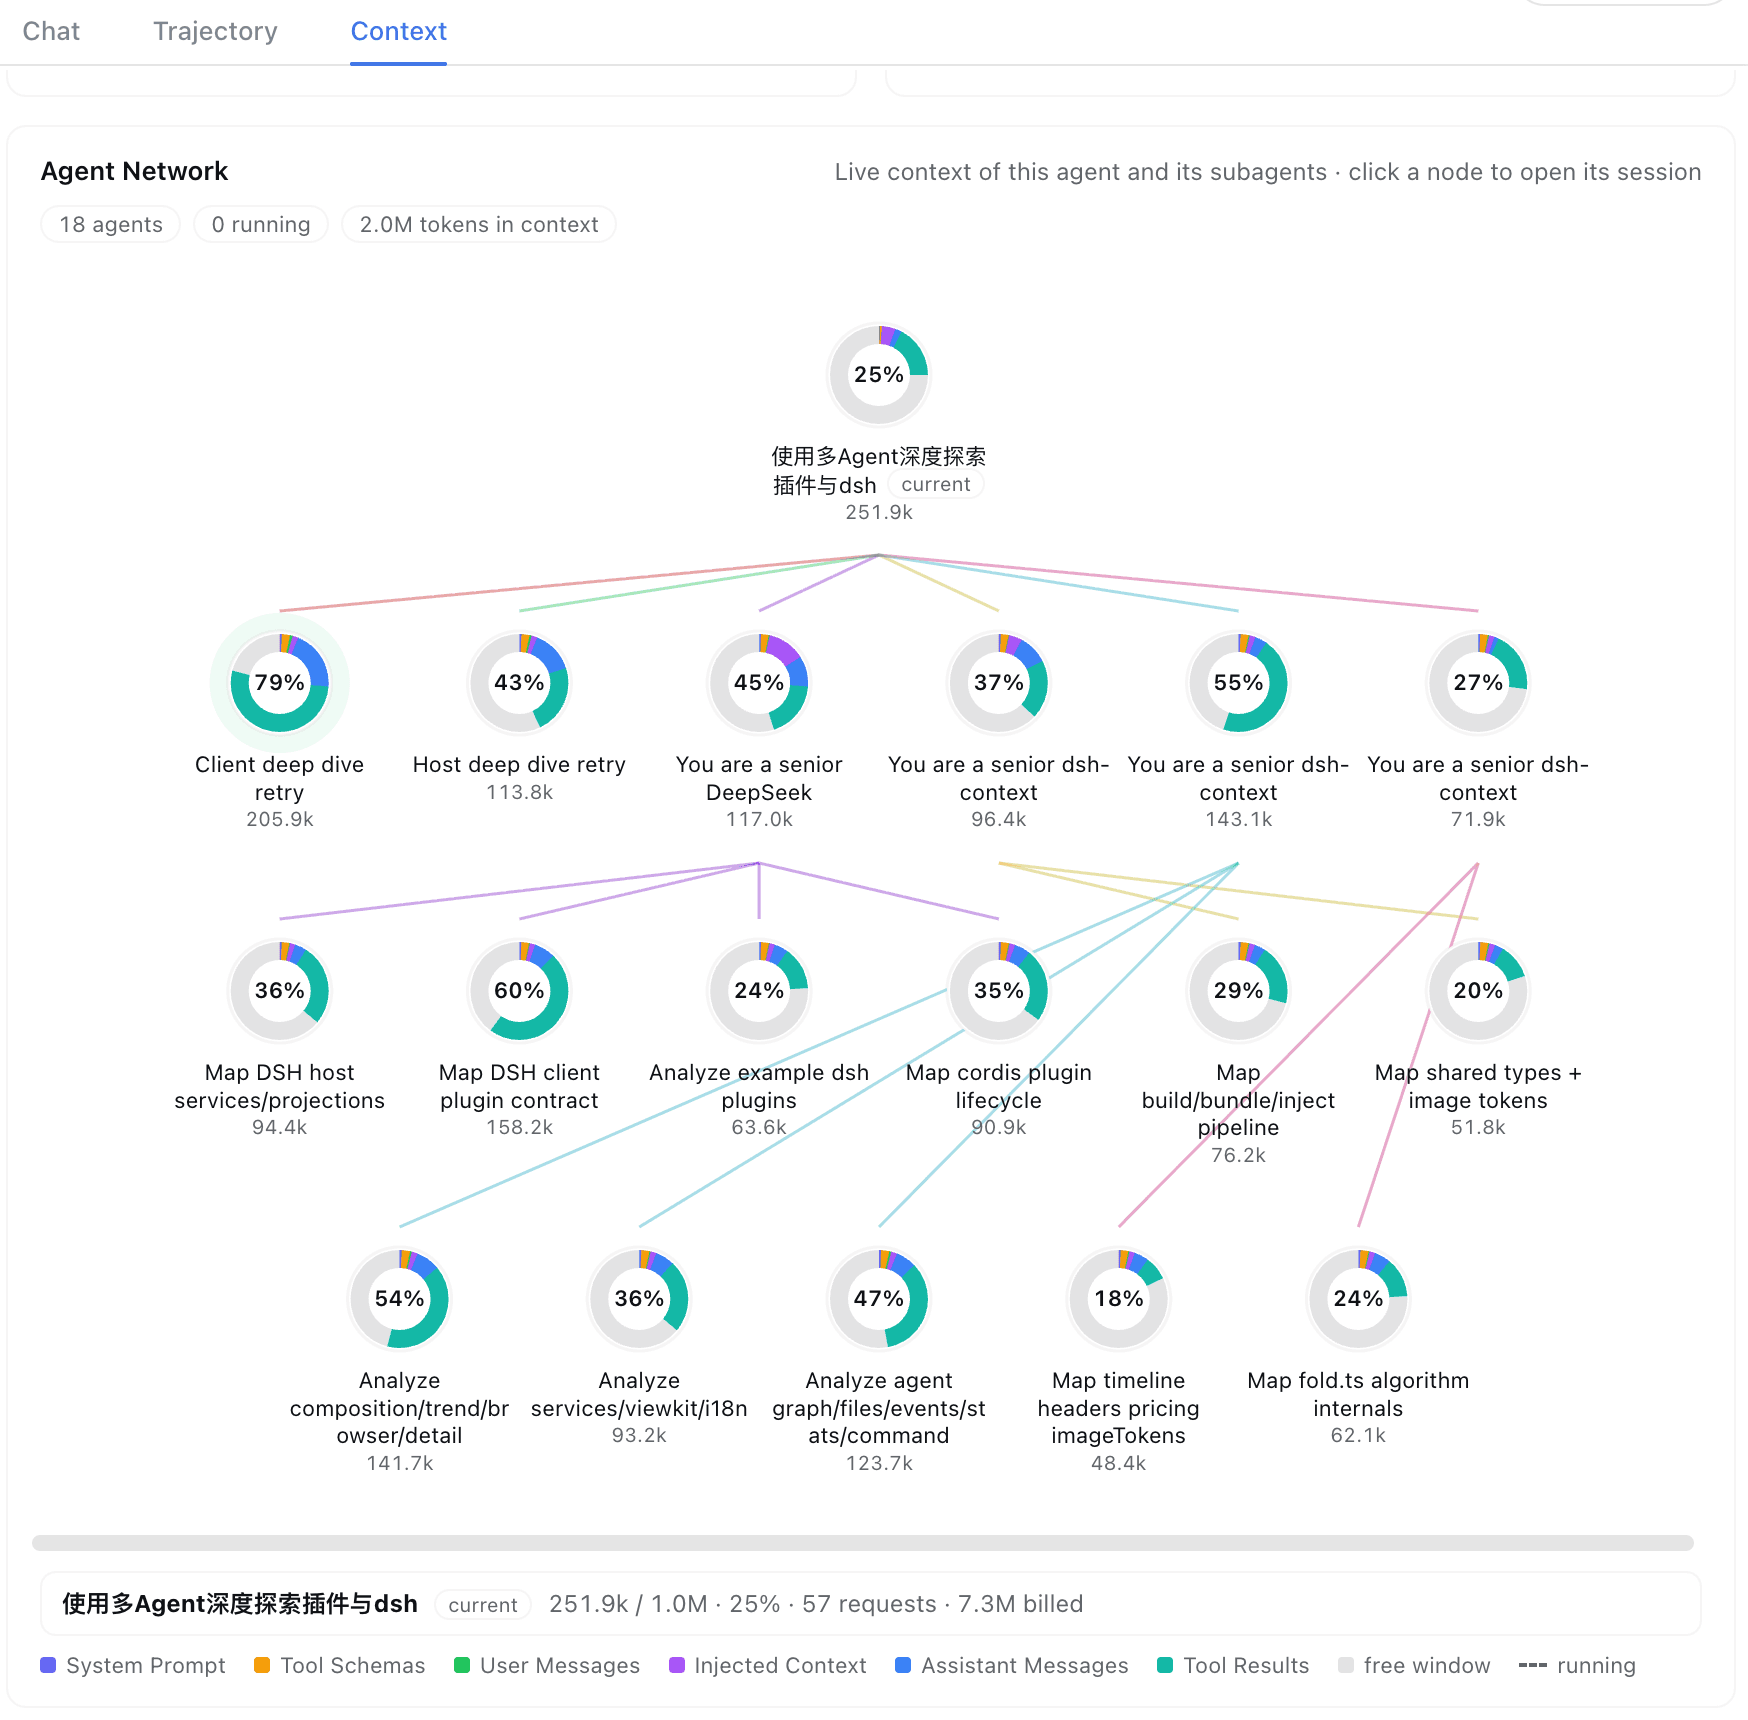
One stacked bar per model request showing how the context window grew or shrank turn by turn, with compaction and prune events pinned exactly where they happened, plus a plain-language step brief explaining what entered and left.What is the Agent Network view for?It maps the current agent together with its parents and every subagent as a family tree, with live rings showing each session's token usage, requests, billing, and active time so multi-agent delegation is visible at a glance.
It maps the current agent together with its parents and every subagent as a family tree, with live rings showing each session's token usage, requests, billing, and active time so multi-agent delegation is visible at a glance.Can I use the UI in Chinese?Yes, dsh-context ships with both English and Simplified Chinese (简体中文) translations.
Yes, dsh-context ships with both English and Simplified Chinese (简体中文) translations.Why would I need this instead of the built-in context ring?The built-in composer ring only shows overall occupancy, while dsh-context breaks that same data down per request, per tool call, and per file, and adds history (trend, events, diffs) so you can see exactly what caused a context change.
The built-in composer ring only shows overall occupancy, while dsh-context breaks that same data down per request, per tool call, and per file, and adds history (trend, events, diffs) so you can see exactly what caused a context change.What are similar projects?dsh-cost-meter, dsh-usage-stats, dsh-agent-team-gui, dsh-gitbash-preset, clearai-dsh, dsh-plugin-agent-workflow, dsh-univer-office, deepseek-harness-for-vscode
dsh-cost-meter, dsh-usage-stats, dsh-agent-team-gui, dsh-gitbash-preset, clearai-dsh, dsh-plugin-agent-workflow, dsh-univer-office, deepseek-harness-for-vscodeWhich topics is it in?context-window, deepseek-harness-plugin, dsh-plugins, token-usage, context-engineering, visualization, dsh-plugin, deepseek-harness, i18n, dashboard, monitoring, plugin
context-window, deepseek-harness-plugin, dsh-plugins, token-usage, context-engineering, visualization, dsh-plugin, deepseek-harness, i18n, dashboard, monitoring, plugin