Arthas








Arthas is a Java Diagnostic tool open sourced by Alibaba.
Arthas allows developers to troubleshoot production issues for Java applications without modifying code or restarting servers.
中文说明/Chinese Documentation
Background
Often times, the production system network is inaccessible from the local development environment. If issues are encountered in production systems, it is impossible to use IDEs to debug the application remotely. More importantly, debugging in production environment is unacceptable, as it will suspend all the threads, resulting in the suspension of business services.
Developers could always try to reproduce the same issue on the test/staging environment. However, this is tricky as some issues cannot be reproduced easily on a different environment, or even disappear once restarted.
And if you're thinking of adding some logs to your code to help troubleshoot the issue, you will have to go through the following lifecycle; test, staging, and then to production. Time is money! This approach is inefficient! Besides, the issue may not be reproducible once the JVM is restarted, as described above.
Arthas was built to solve these issues. A developer can troubleshoot your production issues on-the-fly. No JVM restart, no additional code changes. Arthas works as an observer, which will never suspend your existing threads.
Key features
- Check whether a class is loaded, or where the class is being loaded. (Useful for troubleshooting jar file conflicts)
- Decompile a class to ensure the code is running as expected.
- View classloader statistics, e.g. the number of classloaders, the number of classes loaded per classloader, the classloader hierarchy, possible classloader leaks, etc.
- View the method invocation details, e.g. method parameter, return object, thrown exception, and etc.
- Check the stack trace of specified method invocation. This is useful when a developers wants to know the caller of the said method.
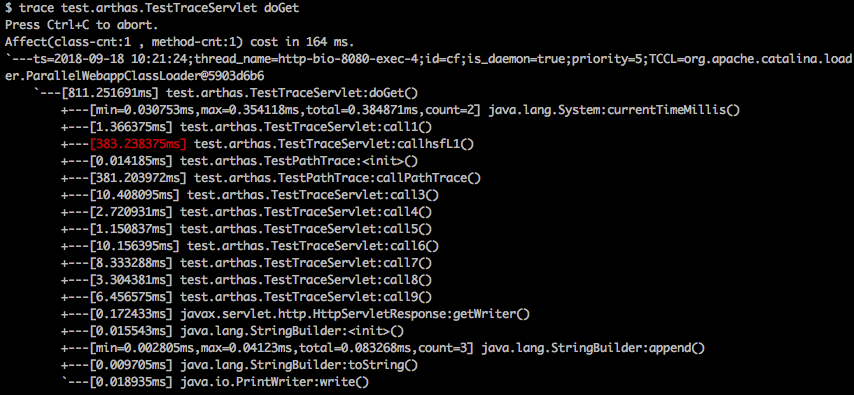
- Trace the method invocation to find slow sub-invocations.
- Monitor method invocation statistics, e.g. qps, rt, success rate and etc.
- Monitor system metrics, thread states and cpu usage, gc statistics, and etc.
- Supports command line interactive mode, with auto-complete feature enabled.
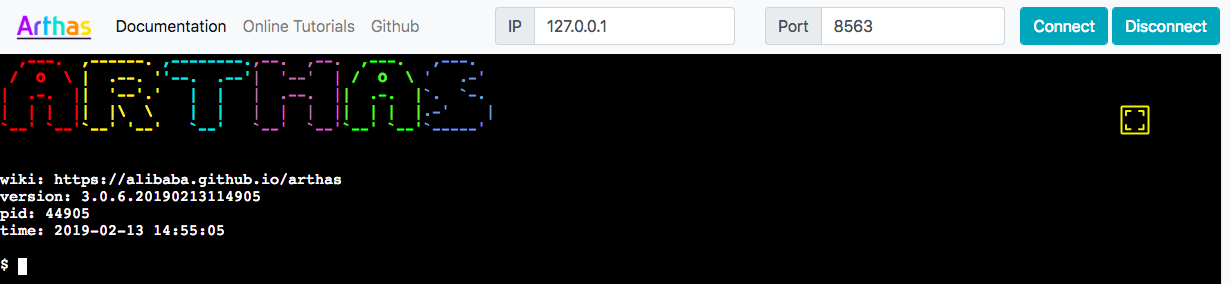
- Supports telnet and websocket, which enables both local and remote diagnostics with command line and browsers.
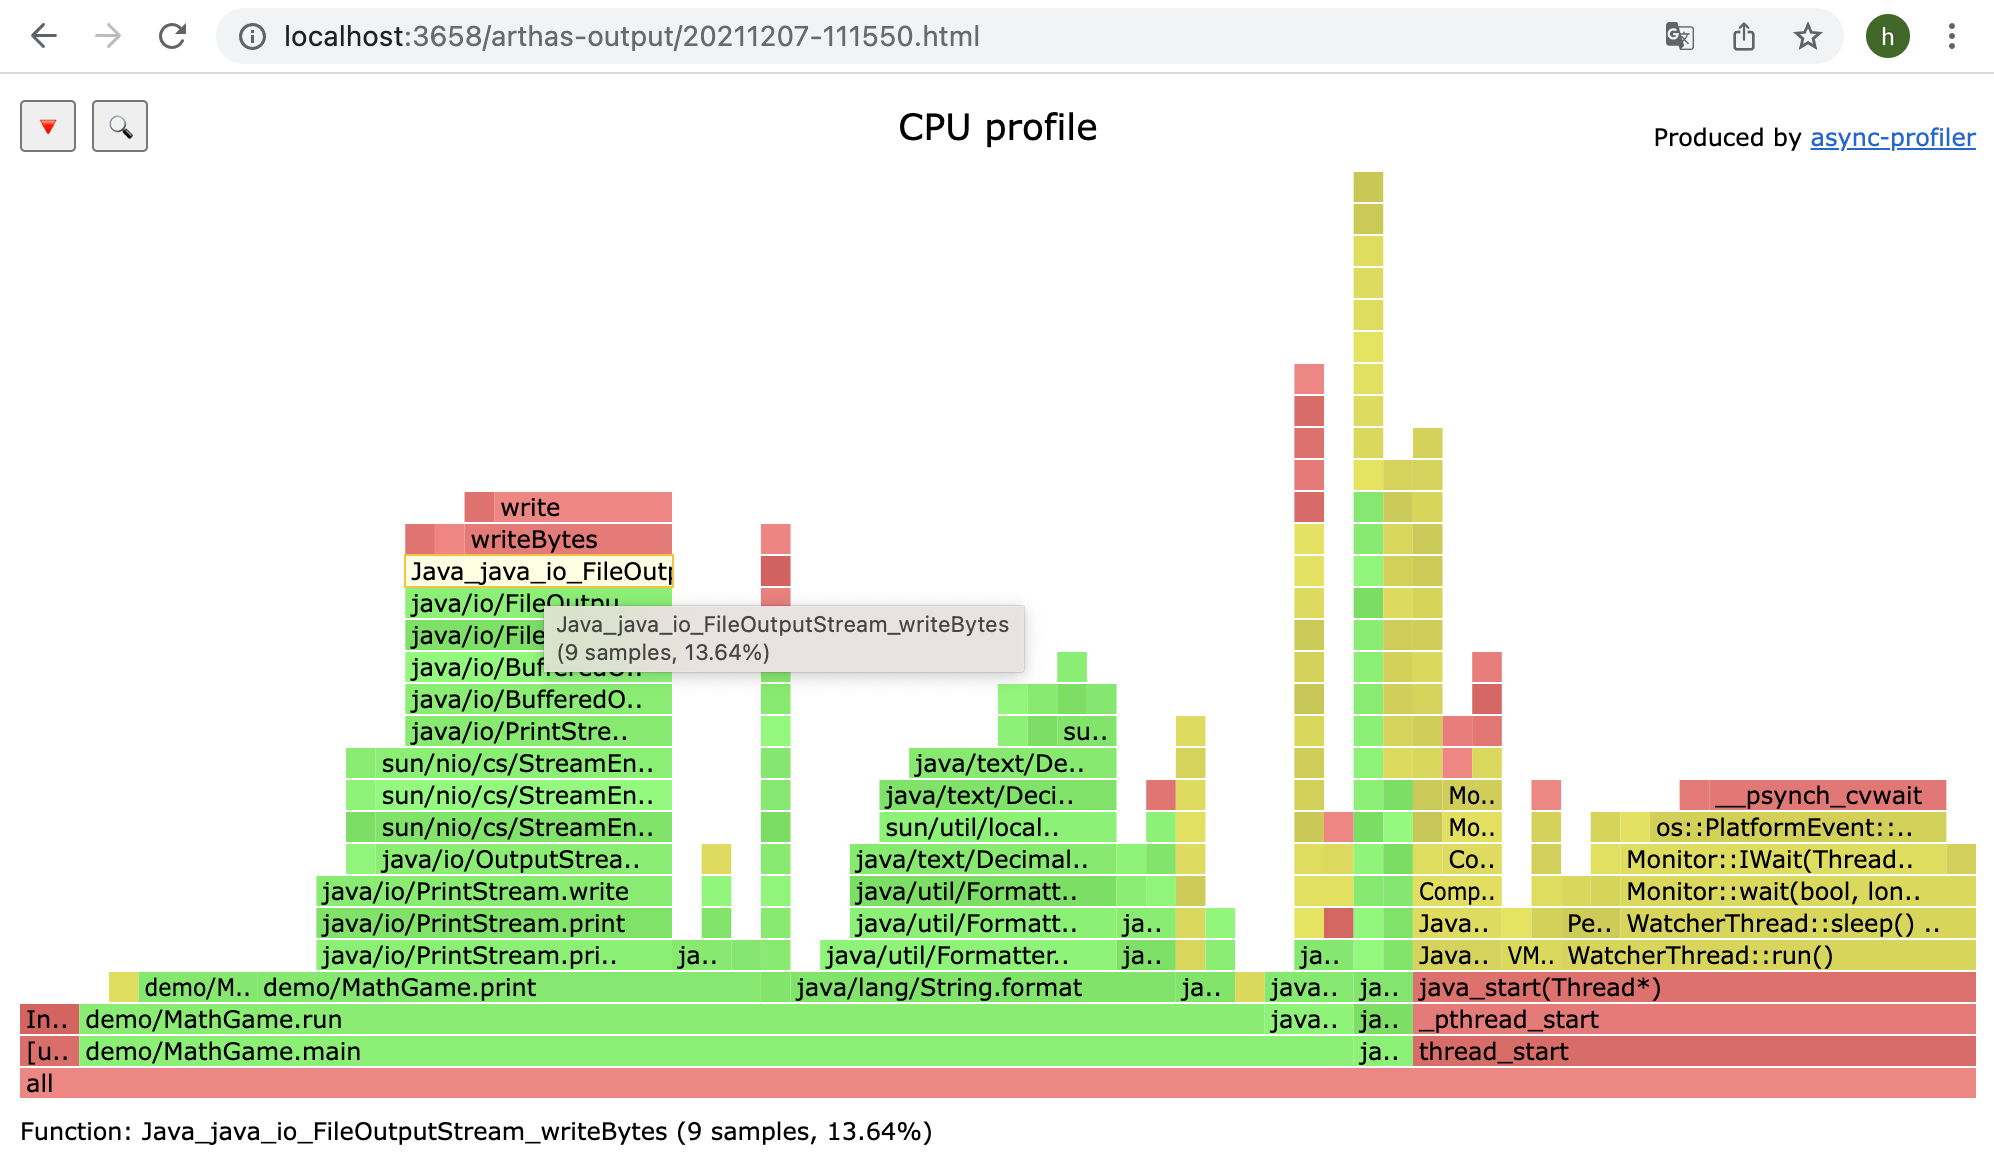
- Supports profiler/Flame Graph
- Support get objects in the heap that are instances of the specified class.
- Supports JDK 8+ in version 4.x, including JDK 17, JDK 21, and JDK 25.
- Supports Linux/Mac/Windows.
Quick start
Use arthas-boot(Recommended)
Downloadarthas-boot.jar,Start with java command:
curl -O https://arthas.aliyun.com/arthas-boot.jar
java -jar arthas-boot.jar
Print usage:
java -jar arthas-boot.jar -h
Use as.sh
You can install Arthas with one single line command on Linux, Unix, and Mac. Copy the following command and paste it into the command line, then press Enter to run:
curl -L https://arthas.aliyun.com/install.sh | sh
The command above will download the bootstrap script as.sh to the current directory. You can move it any other place you want, or put its location in $PATH.
You can enter its interactive interface by executing as.sh, or execute as.sh -h for more help information.
Documentation
Feature Showcase
Dashboard
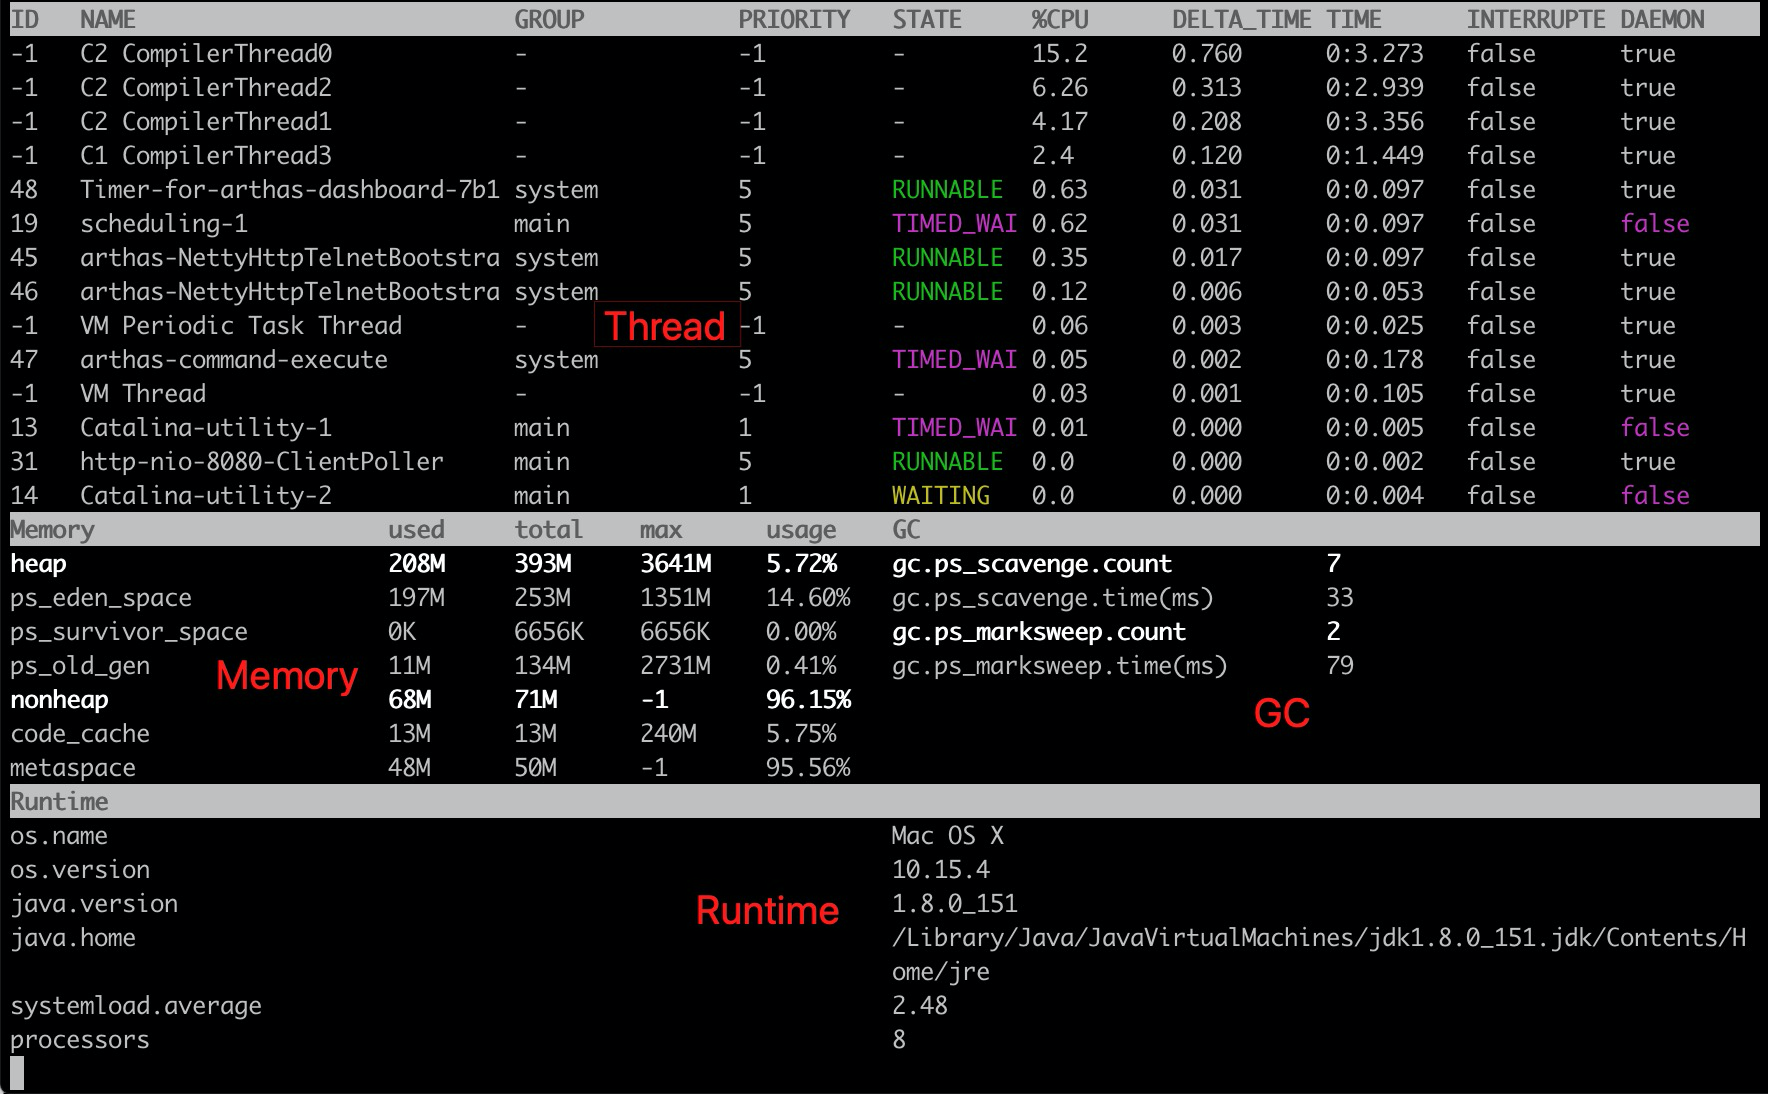
Thread
See what is eating your CPU (ranked by top CPU usage) and what is going on there in one glance:
$ thread -n 3
"as-command-execute-daemon" Id=29 cpuUsage=75% RUNNABLE
    at sun.management.ThreadImpl.dumpThreads0(Native Method)
    at sun.management.ThreadImpl.getThreadInfo(ThreadImpl.java:440)
    at com.taobao.arthas.core.command.monitor200.ThreadCommand$1.action(ThreadCommand.java:58)
    at com.taobao.arthas.core.command.handler.AbstractCommandHandler.execute(AbstractCommandHandler.java:238)
    at com.taobao.arthas.core.command.handler.DefaultCommandHandler.handleCommand(DefaultCommandHandler.java:67)
    at com.taobao.arthas.core.server.ArthasServer$4.run(ArthasServer.java:276)
    at java.util.concurrent.ThreadPoolExecutor.runWorker(ThreadPoolExecutor.java:1145)
    at java.util.concurrent.ThreadPoolExecutor$Worker.run(ThreadPoolExecutor.java:615)
    at java.lang.Thread.run(Thread.java:745)

    Number of locked synchronizers = 1
    - java.util.concurrent.ThreadPoolExecutor$Worker@6cd0b6f8

"as-session-expire-daemon" Id=25 cpuUsage=24% TIMED_WAITING
    at java.lang.Thread.sleep(Native Method)
    at com.taobao.arthas.core.server.DefaultSessionManager$2.run(DefaultSessionManager.java:85)

"Reference Handler" Id=2 cpuUsage=0% WAITING on java.lang.ref.Reference$Lock@69ba0f27
    at java.lang.Object.wait(Native Method)
    -  waiting on java.lang.ref.Reference$Lock@69ba0f27
    at java.lang.Object.wait(Object.java:503)
    at java.lang.ref.Reference$ReferenceHandler.run(Reference.java:133)
jad
Decompile your class with one shot:
$ jad javax.servlet.Servlet

ClassLoader:
+-java.net.URLClassLoader@6108b2d7
  +-sun.misc.Launcher$AppClassLoader@18b4aac2
    +-sun.misc.Launcher$ExtClassLoader@1ddf84b8

Location:
/Users/xxx/work/test/lib/servlet-api.jar

/*
 * Decompiled with CFR 0_122.
 */
package javax.servlet;

import java.io.IOException;
import javax.servlet.ServletConfig;
import javax.servlet.ServletException;
import javax.servlet.ServletRequest;
import javax.servlet.ServletResponse;

public interface Servlet {
    public void init(ServletConfig var1) throws ServletException;

    public ServletConfig getServletConfig();

    public void service(ServletRequest var1, ServletResponse var2) throws ServletException, IOException;

    public String getServletInfo();

    public void destroy();
}
mc
Memory compiler, compiles .java files into .class files in memory.
$ mc /tmp/Test.java
Load the external *.class files to retransform/hotswap the loaded classes in JVM.
retransform /tmp/Test.class
retransform -c 327a647b /tmp/Test.class /tmp/Test\$Inner.class
sc
Search any loaded class with detailed information.
$ sc -d org.springframework.web.context.support.XmlWebApplicationContext
 class-info        org.springframework.web.context.support.XmlWebApplicationContext
 code-source       /Users/xxx/work/test/WEB-INF/lib/spring-web-3.2.11.RELEASE.jar
 name              org.springframework.web.context.support.XmlWebApplicationContext
 isInterface       false
 isAnnotation      false
 isEnum            false
 isAnonymousClass  false
 isArray           false
 isLocalClass      false
 isMemberClass     false
 isPrimitive       false
 isSynthetic       false
 simple-name       XmlWebApplicationContext
 modifier          public
 annotation
 interfaces
 super-class       +-org.springframework.web.context.support.AbstractRefreshableWebApplicationContext
                     +-org.springframework.context.support.AbstractRefreshableConfigApplicationContext
                       +-org.springframework.context.support.AbstractRefreshableApplicationContext
                         +-org.springframework.context.support.AbstractApplicationContext
                           +-org.springframework.core.io.DefaultResourceLoader
                             +-java.lang.Object
 class-loader      +-org.apache.catalina.loader.ParallelWebappClassLoader
                     +-java.net.URLClassLoader@6108b2d7
                       +-sun.misc.Launcher$AppClassLoader@18b4aac2
                         +-sun.misc.Launcher$ExtClassLoader@1ddf84b8
 classLoaderHash   25131501
Get objects in the heap that are instances of the specified class.
$ vmtool --action getInstances --className java.lang.String --limit 10
@String[][
    @String[com/taobao/arthas/core/shell/session/Session],
    @String[com.taobao.arthas.core.shell.session.Session],
    @String[com/taobao/arthas/core/shell/session/Session],
    @String[com/taobao/arthas/core/shell/session/Session],
    @String[com/taobao/arthas/core/shell/session/Session.class],
    @String[com/taobao/arthas/core/shell/session/Session.class],
    @String[com/taobao/arthas/core/shell/session/Session.class],
    @String[com/],
    @String[java/util/concurrent/ConcurrentHashMap$ValueIterator],
    @String[java/util/concurrent/locks/LockSupport],
]
stack
View the call stack of test.arthas.TestStack#doGet:
$ stack test.arthas.TestStack doGet
Press Ctrl+C to abort.
Affect(class-cnt:1 , method-cnt:1) cost in 286 ms.
ts=2018-09-18 10:11:45;thread_name=http-bio-8080-exec-10;id=d9;is_daemon=true;priority=5;TCCL=org.apache.catalina.loader.ParallelWebappClassLoader@25131501
    @test.arthas.TestStack.doGet()
        at javax.servlet.http.HttpServlet.service(HttpServlet.java:624)
        at javax.servlet.http.HttpServlet.service(HttpServlet.java:731)
        at org.apache.catalina.core.ApplicationFilterChain.internalDoFilter(ApplicationFilterChain.java:303)
        at org.apache.catalina.core.ApplicationFilterChain.doFilter(ApplicationFilterChain.java:208)
        at org.apache.tomcat.websocket.server.WsFilter.doFilter(WsFilter.java:52)
        at org.apache.catalina.core.ApplicationFilterChain.internalDoFilter(ApplicationFilterChain.java:241)
        at org.apache.catalina.core.ApplicationFilterChain.doFilter(ApplicationFilterChain.java:208)
        at org.apache.catalina.core.ApplicationFilterChain.internalDoFilter(ApplicationFilterChain.java:241)
        at org.apache.catalina.core.ApplicationFilterChain.doFilter(ApplicationFilterChain.java:208)
        at org.apache.catalina.core.StandardWrapperValve.invoke(StandardWrapperValve.java:220)
        at org.apache.catalina.core.StandardContextValve.invoke(StandardContextValve.java:110)
        ...
        at org.apache.catalina.core.StandardHostValve.invoke(StandardHostValve.java:169)
        at org.apache.catalina.valves.ErrorReportValve.invoke(ErrorReportValve.java:103)
        at org.apache.catalina.core.StandardEngineValve.invoke(StandardEngineValve.java:116)
        at org.apache.catalina.connector.CoyoteAdapter.service(CoyoteAdapter.java:451)
        at org.apache.coyote.http11.AbstractHttp11Processor.process(AbstractHttp11Processor.java:1121)
        at org.apache.coyote.AbstractProtocol$AbstractConnectionHandler.process(AbstractProtocol.java:637)
        at org.apache.tomcat.util.net.JIoEndpoint$SocketProcessor.run(JIoEndpoint.java:316)
        at java.util.concurrent.ThreadPoolExecutor.runWorker(ThreadPoolExecutor.java:1142)
        at java.util.concurrent.ThreadPoolExecutor$Worker.run(ThreadPoolExecutor.java:617)
        at org.apache.tomcat.util.threads.TaskThread$WrappingRunnable.run(TaskThread.java:61)
        at java.lang.Thread.run(Thread.java:745)
Trace
See what is slowing down your method invocation with trace command:
Watch
Watch the first parameter and thrown exception of test.arthas.TestWatch#doGet only if it throws exception.
$ watch test.arthas.TestWatch doGet {params[0], throwExp} -e
Press Ctrl+C to abort.
Affect(class-cnt:1 , method-cnt:1) cost in 65 ms.
ts=2018-09-18 10:26:28;result=@ArrayList[
    @RequestFacade[org.apache.catalina.connector.RequestFacade@79f922b2],
    @NullPointerException[java.lang.NullPointerException],
]
Monitor
Monitor a specific method invocation statistics, including the total number of invocations, average response time, success rate, and every 5 seconds:
$ monitor -c 5 org.apache.dubbo.demo.provider.DemoServiceImpl sayHello
Press Ctrl+C to abort.
Affect(class-cnt:1 , method-cnt:1) cost in 109 ms.
 timestamp            class                                           method    total  success  fail  avg-rt(ms)  fail-rate
----------------------------------------------------------------------------------------------------------------------------
 2018-09-20 09:45:32  org.apache.dubbo.demo.provider.DemoServiceImpl  sayHello  5      5        0     0.67        0.00%

 timestamp            class                                           method    total  success  fail  avg-rt(ms)  fail-rate
----------------------------------------------------------------------------------------------------------------------------
 2018-09-20 09:45:37  org.apache.dubbo.demo.provider.DemoServiceImpl  sayHello  5      5        0     1.00        0.00%

 timestamp            class                                           method    total  success  fail  avg-rt(ms)  fail-rate
----------------------------------------------------------------------------------------------------------------------------
 2018-09-20 09:45:42  org.apache.dubbo.demo.provider.DemoServiceImpl  sayHello  5      5        0     0.43        0.00%
Time Tunnel(tt)
Record method invocation data, so that you can check the method invocation parameters, returned value, and thrown exceptions later. It works as if you could come back and replay the past method invocation via time tunnel.
$ tt -t org.apache.dubbo.demo.provider.DemoServiceImpl sayHello
Press Ctrl+C to abort.
Affect(class-cnt:1 , method-cnt:1) cost in 75 ms.
 INDEX   TIMESTAMP            COST(ms)  IS-RET  IS-EXP   OBJECT         CLASS                          METHOD
-------------------------------------------------------------------------------------------------------------------------------------
 1000    2018-09-20 09:54:10  1.971195  true    false    0x55965cca     DemoServiceImpl                sayHello
 1001    2018-09-20 09:54:11  0.215685  true    false    0x55965cca     DemoServiceImpl                sayHello
 1002    2018-09-20 09:54:12  0.236303  true    false    0x55965cca     DemoServiceImpl                sayHello
 1003    2018-09-20 09:54:13  0.159598  true    false    0x55965cca     DemoServiceImpl                sayHello
 1004    2018-09-20 09:54:14  0.201982  true    false    0x55965cca     DemoServiceImpl                sayHello
 1005    2018-09-20 09:54:15  0.214205  true    false    0x55965cca     DemoServiceImpl                sayHello
 1006    2018-09-20 09:54:16  0.241863  true    false    0x55965cca     DemoServiceImpl                sayHello
 1007    2018-09-20 09:54:17  0.305747  true    false    0x55965cca     DemoServiceImpl                sayHello
 1008    2018-09-20 09:54:18  0.18468   true    false    0x55965cca     DemoServiceImpl                sayHello
Classloader
$ classloader
 name                                                  numberOfInstances  loadedCountTotal
 BootstrapClassLoader                                  1                  3346
 com.taobao.arthas.agent.ArthasClassloader             1                  1262
 java.net.URLClassLoader                               2                  1033
 org.apache.catalina.loader.ParallelWebappClassLoader  1                  628
 sun.reflect.DelegatingClassLoader                     166                166
 sun.misc.Launcher$AppClassLoader                      1                  31
 com.alibaba.fastjson.util.ASMClassLoader              6                  15
 sun.misc.Launcher$ExtClassLoader                      1                  7
 org.jvnet.hk2.internal.DelegatingClassLoader          2                  2
 sun.reflect.misc.MethodUtil                           1                  1
Web Console
Profiler/FlameGraph
$ profiler start
Started [cpu] profiling
$ profiler stop
profiler output file: /tmp/demo/arthas-output/20211207-111550.html
OK
View profiler results under arthas-output via browser:
Arthas Spring Boot Starter
Known Users
Arthas has more than 120 registered users, View All.
Welcome to register the company name in this issue: https://github.com/alibaba/arthas/issues/111 (in order of registration)














Derivative Projects
Credits
Contributors
This project exists, thanks to all the people who contributed.

Projects
- bytekit Java Bytecode Kit.
- greys-anatomy: The Arthas code base has derived from Greys, we thank for the excellent work done by Greys.
- termd: Art

 Arthas 是阿里巴巴开发的 Java 诊断工具,开发人员可以用它排查线上 JVM 运行中的问题,无需修改代码,也无需重启服务器。