



visx README

The project's README from github.com/airbnb/visx. As one markdown file: README.md.

visx

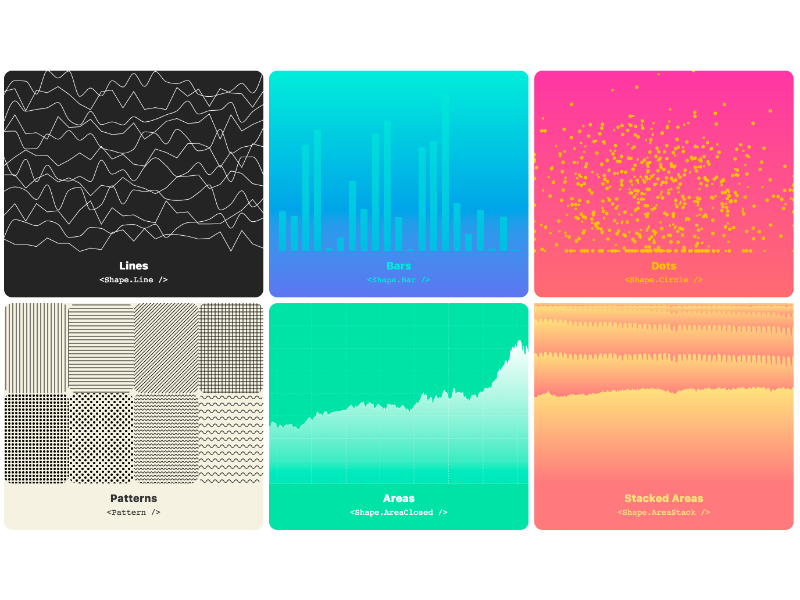
visx is a collection of reusable low-level visualization components. visx combines the power of d3 to generate your visualization with the benefits of react for updating the DOM.

[!IMPORTANT] visx v4 is the current stable release and requires React 18 or 19.

npm install @visx/shape

Upgrading from v3? See the visx 4 migration guide.


Docs • Gallery • Changelog • Migration

Usage

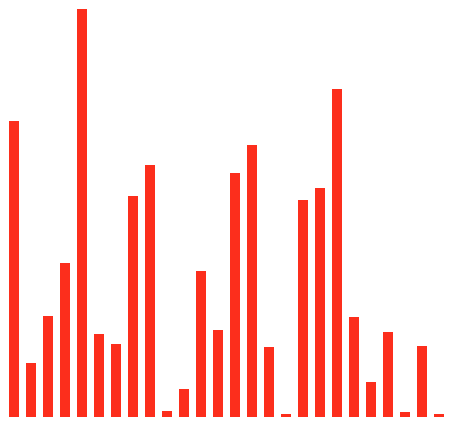
Let's make a simple bar graph.

First we'll install the relevant packages:

npm install --save @visx/mock-data @visx/group @visx/shape @visx/scale
import React from 'react';
import { letterFrequency } from '@visx/mock-data';
import { Group } from '@visx/group';
import { Bar } from '@visx/shape';
import { scaleLinear, scaleBand } from '@visx/scale';

// We'll use some mock data from `@visx/mock-data` for this.
const data = letterFrequency;

// Define the graph dimensions and margins
const width = 500;
const height = 500;
const margin = { top: 20, bottom: 20, left: 20, right: 20 };

// Then we'll create some bounds
const xMax = width - margin.left - margin.right;
const yMax = height - margin.top - margin.bottom;

// Accessors
const getLetter = (d) => d.letter;
const getFrequency = (d) => d.frequency * 100;

// And then scale the graph by our data
const xScale = scaleBand({
  range: [0, xMax],
  round: true,
  domain: data.map(getLetter),
  padding: 0.4,
});
const yScale = scaleLinear({
  range: [yMax, 0],
  round: true,
  domain: [0, Math.max(...data.map(getFrequency))],
});

// Finally we'll embed it all in an SVG
function BarGraph() {
  return (
    <svg width={width} height={height}>
      {data.map((d) => {
        const letter = getLetter(d);
        const barHeight = yMax - (yScale(getFrequency(d)) ?? 0);
        return (
          <Group key={`bar-${letter}`}>
            <Bar
              x={xScale(letter)}
              y={yMax - barHeight}
              height={barHeight}
              width={xScale.bandwidth()}
              fill="#fc2e1c"
            />
          </Group>
        );
      })}
    </svg>
  );
}

For more examples using visx, check out the gallery.

Motivation

Goal

The goal is to create a library of components you can use to make both your own reusable chart library or your slick custom one-off chart. visx is largely unopinionated and is meant to be built upon. Keep your bundle sizes down and use only the packages you need.

How?

Under the hood, visx is using d3 for the calculations and math. If you're creating your own awesome chart library on top of visx, it's easy to create a component api that hides d3 entirely. Meaning your team could create charts as easily as using reusable react components.

But why?

Mixing two mental models for updating the DOM is never a good time. Copy and pasting d3 code into useEffect() is just that. This collection of components lets you easily build your own reusable visualization charts or library without having to learn d3. No more selections or enter()/exit()/update().

FAQ

  1. What does visx stand for?

    visx stands for visualization components.

  2. Do you plan on supporting animation/transitions?

    A common criticism of visx is it doesn't have animation baked in, but this was a conscious choice. It's a powerful feature to not bake it in.

    Imagine your app already bundles react-motion, adding a hypothetical @visx/animation is bloat. Since visx is react, it already supports all react animation libs.

    Charting libraries are like style guides. Each org or app will eventually want full control over their own implementation.

    visx makes this easier for everyone. No need to reinvent the wheel each time.

    more info: https://github.com/airbnb/visx/issues/6

  3. Do I have to use every package to make a chart?

    nope! pick and choose the packages you need.

  4. Can I use this to create my own library of charts for my team?

    Please do.

  5. Does visx work with preact?

    yup! alias react + react-dom to preact/compat. For visx v4, configure your package manager to satisfy the React 18/19 peer dependency range.

  6. I like using d3.

    Me too.

Thanks

Thanks to Happo for providing the visual regression testing platform that helps us review UI changes and catch unintended visual regressions.

Happo

Development

Please see CONTRIBUTING.md

:v:

MIT

visx (airbnb/visx)

Searching Database…

21.1K ·GitHub
这是什么?visx 是一套可复用的 React 底层可视化组件集合:由 d3 负责计算和数学运算,由 React 负责渲染和更新 DOM。你可以像搭积木一样用组件拼出图表,而不用去写 d3 的选择集代码。
它和直接用 d3 有什么不一样?visx 底层用 d3 做数学计算,但把所有功能都封装成 React 组件,所以你不用学 selection,也没有 enter()/exit()/update() 那一套。你甚至可以把它再包一层,做成完全隐藏 d3 的自己的组件 API。
怎么把它加到项目里?只安装你需要的 @visx 软件包就行——visx 被拆成了很多小模块,这样打包体积不会太大——然后在你的 React 应用里组合使用。README 里带了一个柱状图的完整示例,示例画廊里还有更多例子。
它需要哪个版本的 React?当前正式稳定版 visx v4 需要 React 18 或 19。用 Preact 也可以,只要把 react 和 react-dom 别名指向 preact/compat,并满足 React 18/19 的 peer dependency 版本范围即可。
它自带动画功能吗?不带——这是有意为之的设计。因为 visx 就是普通的 React,它天然能配合任何 React 动画库使用,所以已经打包了 react-motion 之类的应用不必再引入一个重复的动画包。
这些是现成的图表,还是用来搭建我自己图表库的积木?两者都是。它的目标是让你既能用它搭建自己可复用的图表库,也能快速做出一个漂亮的定制一次性图表。visx 基本上不做 opinionated 的限定,就是给人拿来往上构建的——官方明确鼓励你为团队把它再封装一层。
visx 这个名字是什么意思?它是 visualization components(可视化组件)的缩写——这个名字就是这个库用途的直接缩写。
这个项目还在积极开发吗?是的——v4 是当前的正式稳定版,还提供了官方的 v3 迁移到 v4 的指南,而且这个仓库在每次 push 和 pull request 时都会运行 CI 工作流。
它适合 TypeScript 项目吗?适合——代码库本身就是用 TypeScript 写的,各个软件包也是从 .ts 和 .tsx 源码编译出来的,所以从头到尾你用的都是带类型的代码。
What are similar projects?victory, G2, recharts, apexcharts.js, blobatar, vue-echarts, d3, vega
Creator
airbnb
Size
16.4 MB
Stars
21.1K
Age
9y
Commits · 90 Days