



Что это такое?
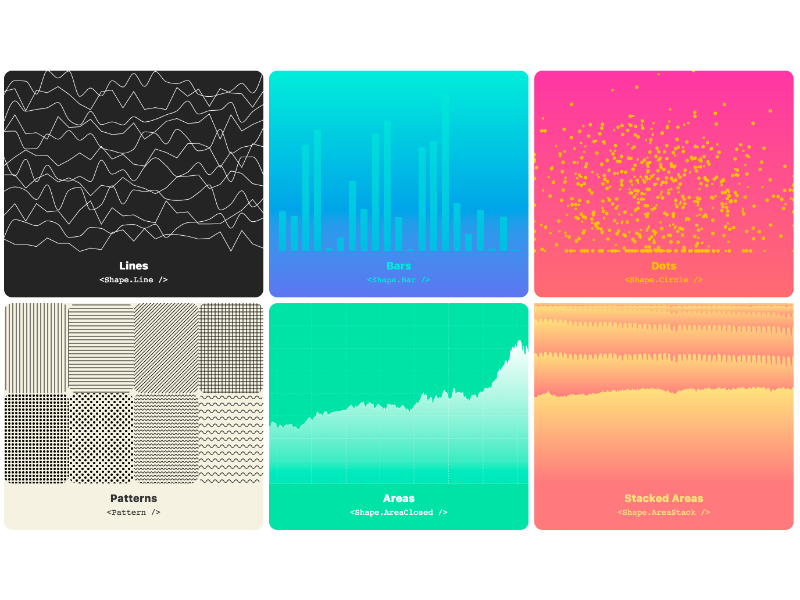
 visx — это набор переиспользуемых низкоуровневых компонентов для визуализации в React: все вычисления и математика на d3, а рендеринг и обновление DOM берёт на себя React. Вы собираете графики из готовых компонентов вместо того, чтобы писать код выборок d3.
visx — это набор переиспользуемых низкоуровневых компонентов для визуализации в React: все вычисления и математика на d3, а рендеринг и обновление DOM берёт на себя React. Вы собираете графики из готовых компонентов вместо того, чтобы писать код выборок d3.Чем это отличается от обычного d3?Под капотом visx использует d3 для математики, но оборачивает всё в React-компоненты, поэтому не нужно разбираться с выборками и enter()/exit()/update(). Можно даже обернуть это в собственный API компонентов, который полностью скроет d3.
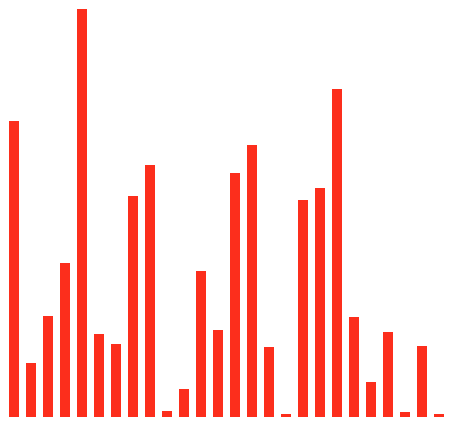
Под капотом visx использует d3 для математики, но оборачивает всё в React-компоненты, поэтому не нужно разбираться с выборками и enter()/exit()/update(). Можно даже обернуть это в собственный API компонентов, который полностью скроет d3.Как добавить его в проект?Установите только нужные вам пакеты @visx — visx разбит на небольшие модули, чтобы размер бандла не разрастался, — и собирайте из них интерфейс в своём React-приложении. В README разобран пример столбчатой диаграммы, а в галерее ещё много примеров.
Установите только нужные вам пакеты @visx — visx разбит на небольшие модули, чтобы размер бандла не разрастался, — и собирайте из них интерфейс в своём React-приложении. В README разобран пример столбчатой диаграммы, а в галерее ещё много примеров.Какая версия React нужна?visx v4, текущий стабильный релиз, требует React 18 или 19. Работает и Preact, если назначить алиасы react и react-dom на preact/compat и удовлетворить диапазон peer-зависимости React 18/19.
visx v4, текущий стабильный релиз, требует React 18 или 19. Работает и Preact, если назначить алиасы react и react-dom на preact/compat и удовлетворить диапазон peer-зависимости React 18/19.Анимация встроена?Нет — это осознанное решение. visx — обычный React, поэтому он и так работает с любой библиотекой анимации для React; приложение, где уже есть, скажем, react-motion, не будет тянуть дублирующий пакет анимации.
Нет — это осознанное решение. visx — обычный React, поэтому он и так работает с любой библиотекой анимации для React; приложение, где уже есть, скажем, react-motion, не будет тянуть дублирующий пакет анимации.Это готовые графики или конструктор для моей собственной библиотеки диаграмм?И то и другое. Цель — компоненты, из которых можно собрать и свою переиспользуемую библиотеку графиков, и красивый разовый кастомный график. visx почти ничего не навязывает и задуман как основа для надстройки — обернуть его под свою команду прямо поощряется.
И то и другое. Цель — компоненты, из которых можно собрать и свою переиспользуемую библиотеку графиков, и красивый разовый кастомный график. visx почти ничего не навязывает и задуман как основа для надстройки — обернуть его под свою команду прямо поощряется.Что означает название visx?Это сокращение от visualization components — название буквально повторяет то, чем является библиотека.
Это сокращение от visualization components — название буквально повторяет то, чем является библиотека.Проект ещё активно развивается?Да — текущий стабильный релиз v4 с официальным руководством по миграции с v3 на v4, а в репозитории CI-процессы запускаются на каждый push и pull request.
Да — текущий стабильный релиз v4 с официальным руководством по миграции с v3 на v4, а в репозитории CI-процессы запускаются на каждый push и pull request.Он хорошо подходит для проектов на TypeScript?Да — сама кодовая база написана на TypeScript, а пакеты компилируются из исходников .ts и .tsx, так что вы всё время работаете с типизированным кодом.
Да — сама кодовая база написана на TypeScript, а пакеты компилируются из исходников .ts и .tsx, так что вы всё время работаете с типизированным кодом.What are similar projects?victory, G2, recharts, apexcharts.js, blobatar, vue-echarts, d3, vega
victory, G2, recharts, apexcharts.js, blobatar, vue-echarts, d3, vegaWhich topics is it in?preact, d3, chart, svg, visualization, monorepo, component-library, data-visualization, ui-components, ui, web-development, react
preact, d3, chart, svg, visualization, monorepo, component-library, data-visualization, ui-components, ui, web-development, react