




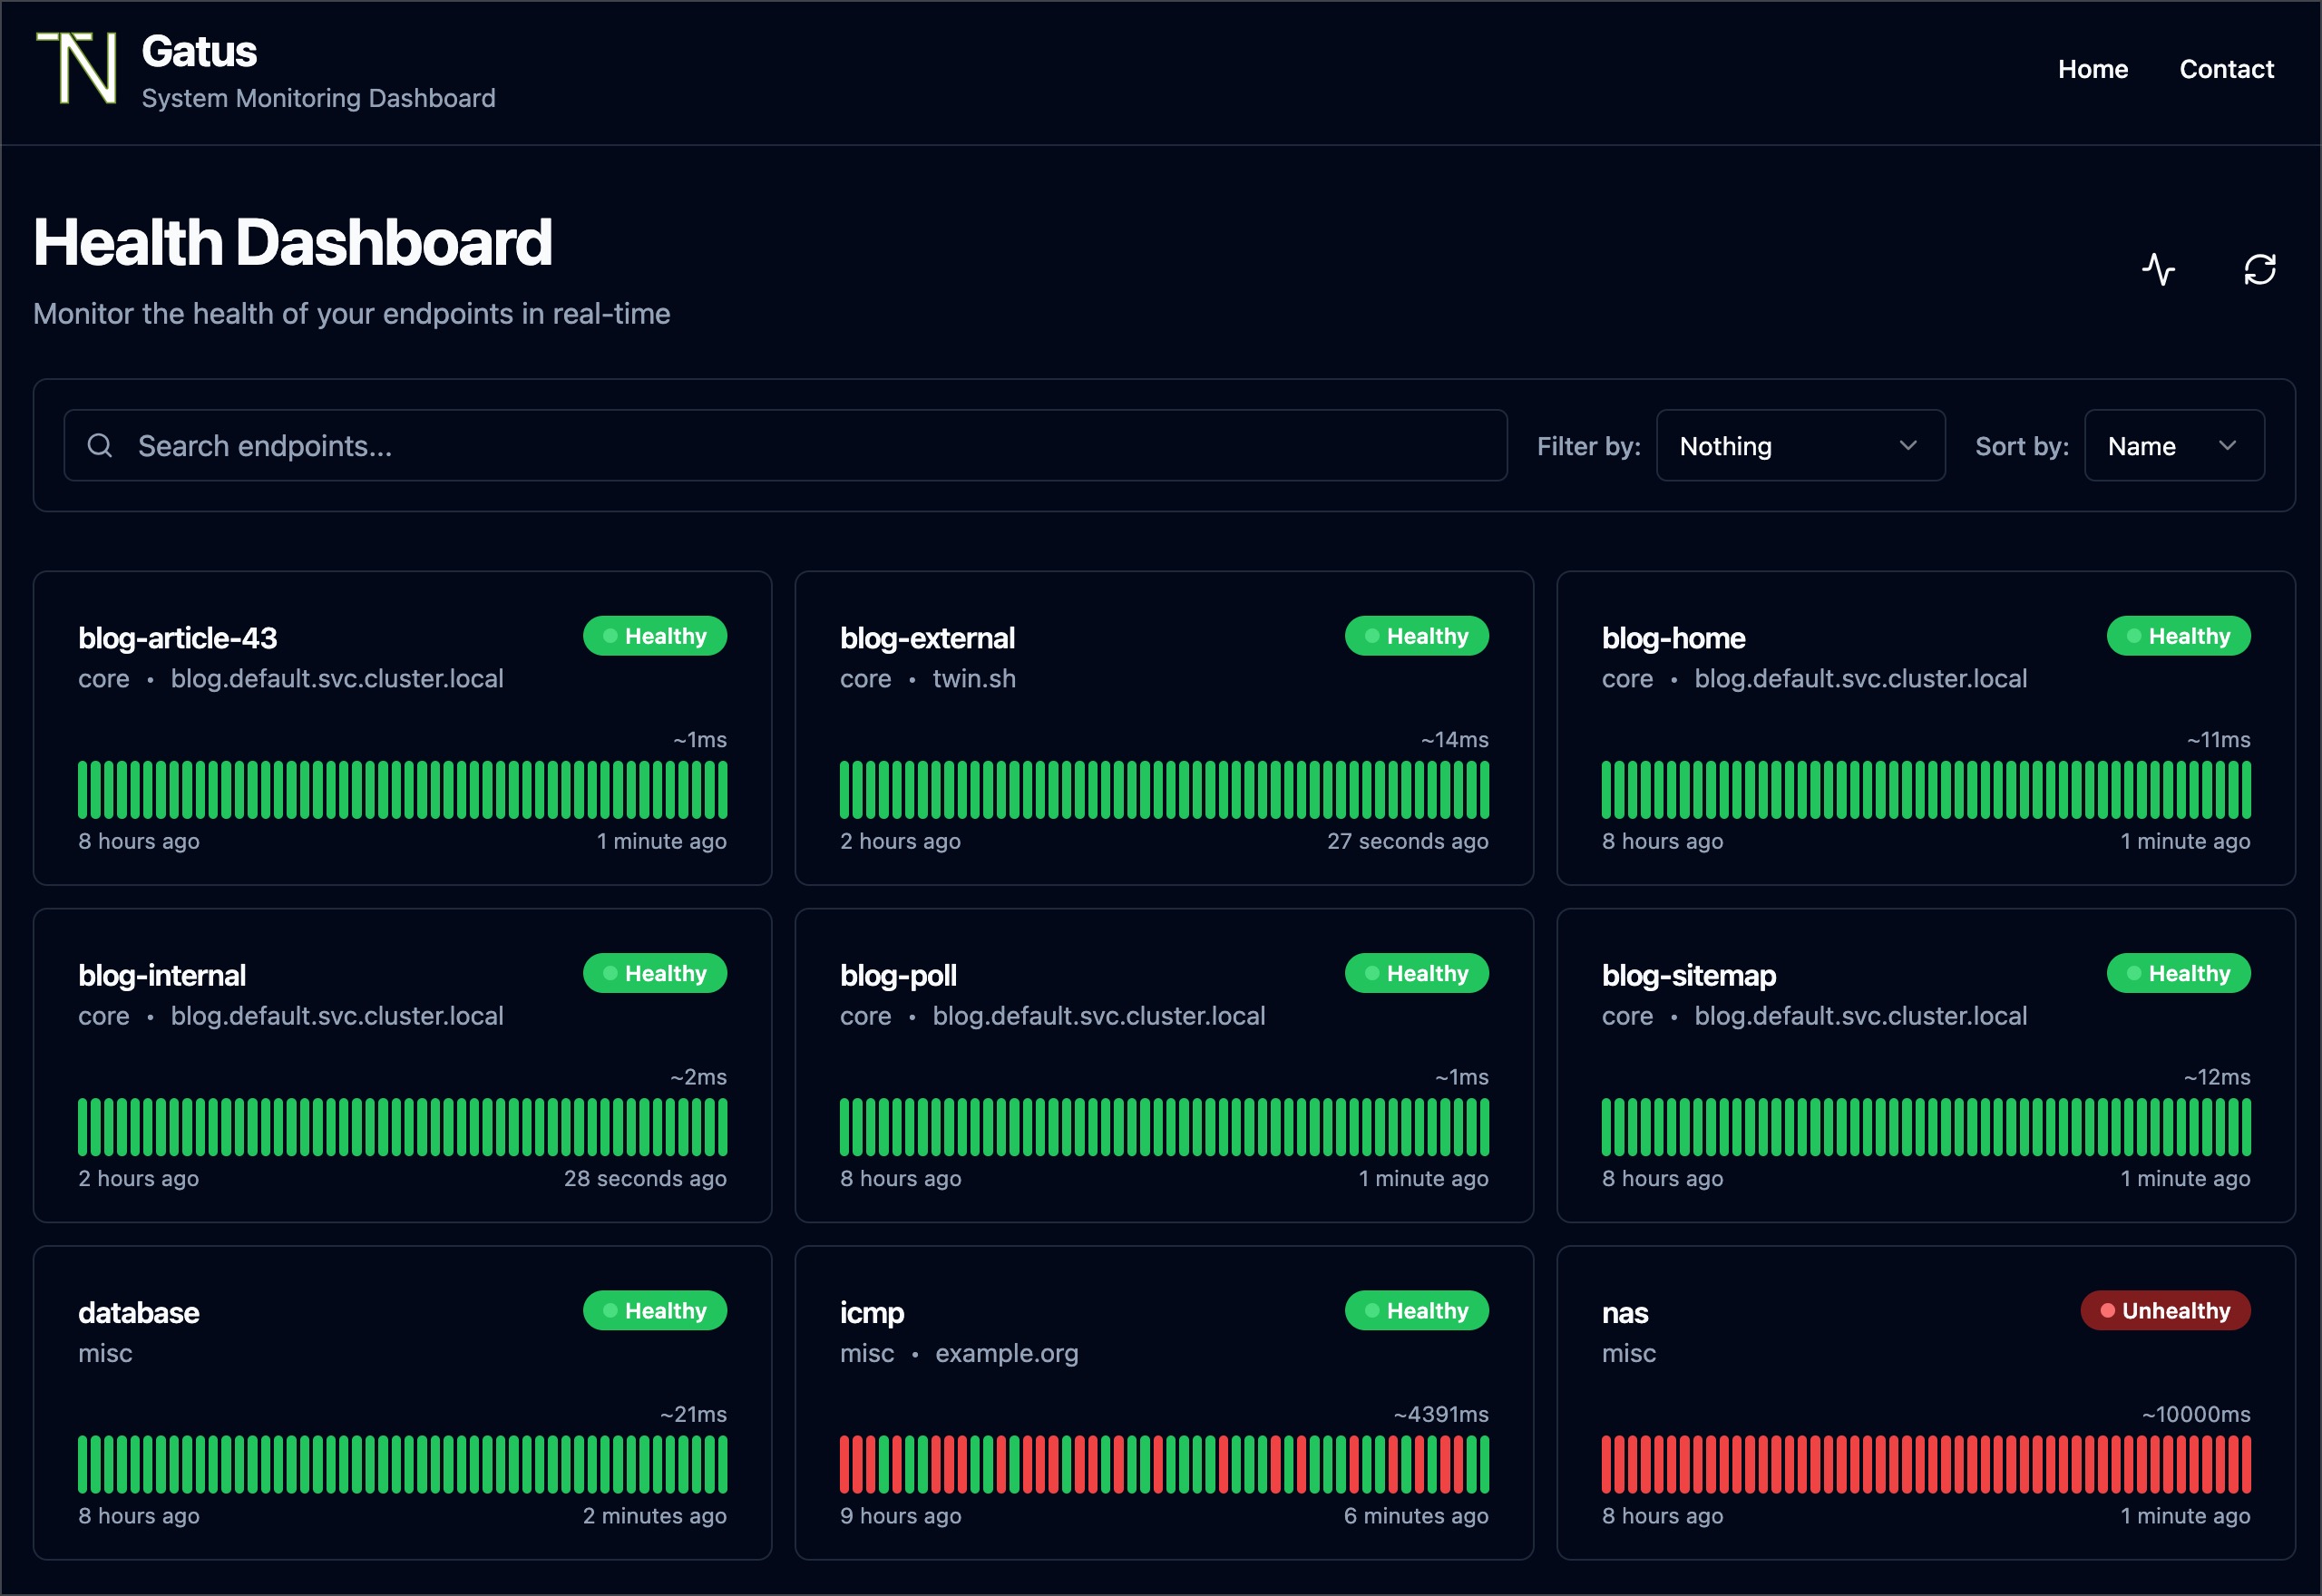
Gatus is a developer-oriented health dashboard that gives you the ability to monitor your services using HTTP, ICMP, TCP, and even DNS
queries as well as evaluate the result of said queries by using a list of conditions on values like the status code,
the response time, the certificate expiration, the body and many others. The icing on top is that each of these health
checks can be paired with alerting via Slack, Teams, PagerDuty, Discord, Twilio and many more.
I personally deploy it in my Kubernetes cluster and let it monitor the status of my
core applications: https://status.twin.sh/
Looking for a managed solution? Check out Gatus.io.
Quick start
docker run -p 8080:8080 --name gatus ghcr.io/twin/gatus:stable
You can also use Docker Hub if you prefer:
docker run -p 8080:8080 --name gatus twinproduction/gatus:stable
For more details, see Usage
❤ Like this project? Please consider sponsoring me.
Have any feedback or questions? Create a discussion.
Table of Contents
Why Gatus?
Before getting into the specifics, I want to address the most common question:
Why would I use Gatus when I can just use Prometheus’ Alertmanager, Cloudwatch or even Splunk?
Neither of these can tell you that there’s a problem if there are no clients actively calling the endpoint.
In other words, it's because monitoring metrics mostly rely on existing traffic, which effectively means that unless
your clients are already experiencing a problem, you won't be notified.
Gatus, on the other hand, allows you to configure health checks for each of your features, which in turn allows it to
monitor these features and potentially alert you before any clients are impacted.
A sign you may want to look into Gatus is by simply asking yourself whether you'd receive an alert if your load balancer
was to go down right now. Will any of your existing alerts be triggered? Your metrics won’t report an increase in errors
if no traffic makes it to your applications. This puts you in a situation where your clients are the ones
that will notify you about the degradation of your services rather than you reassuring them that you're working on
fixing the issue before they even know about it.
Features
The main features of Gatus are:
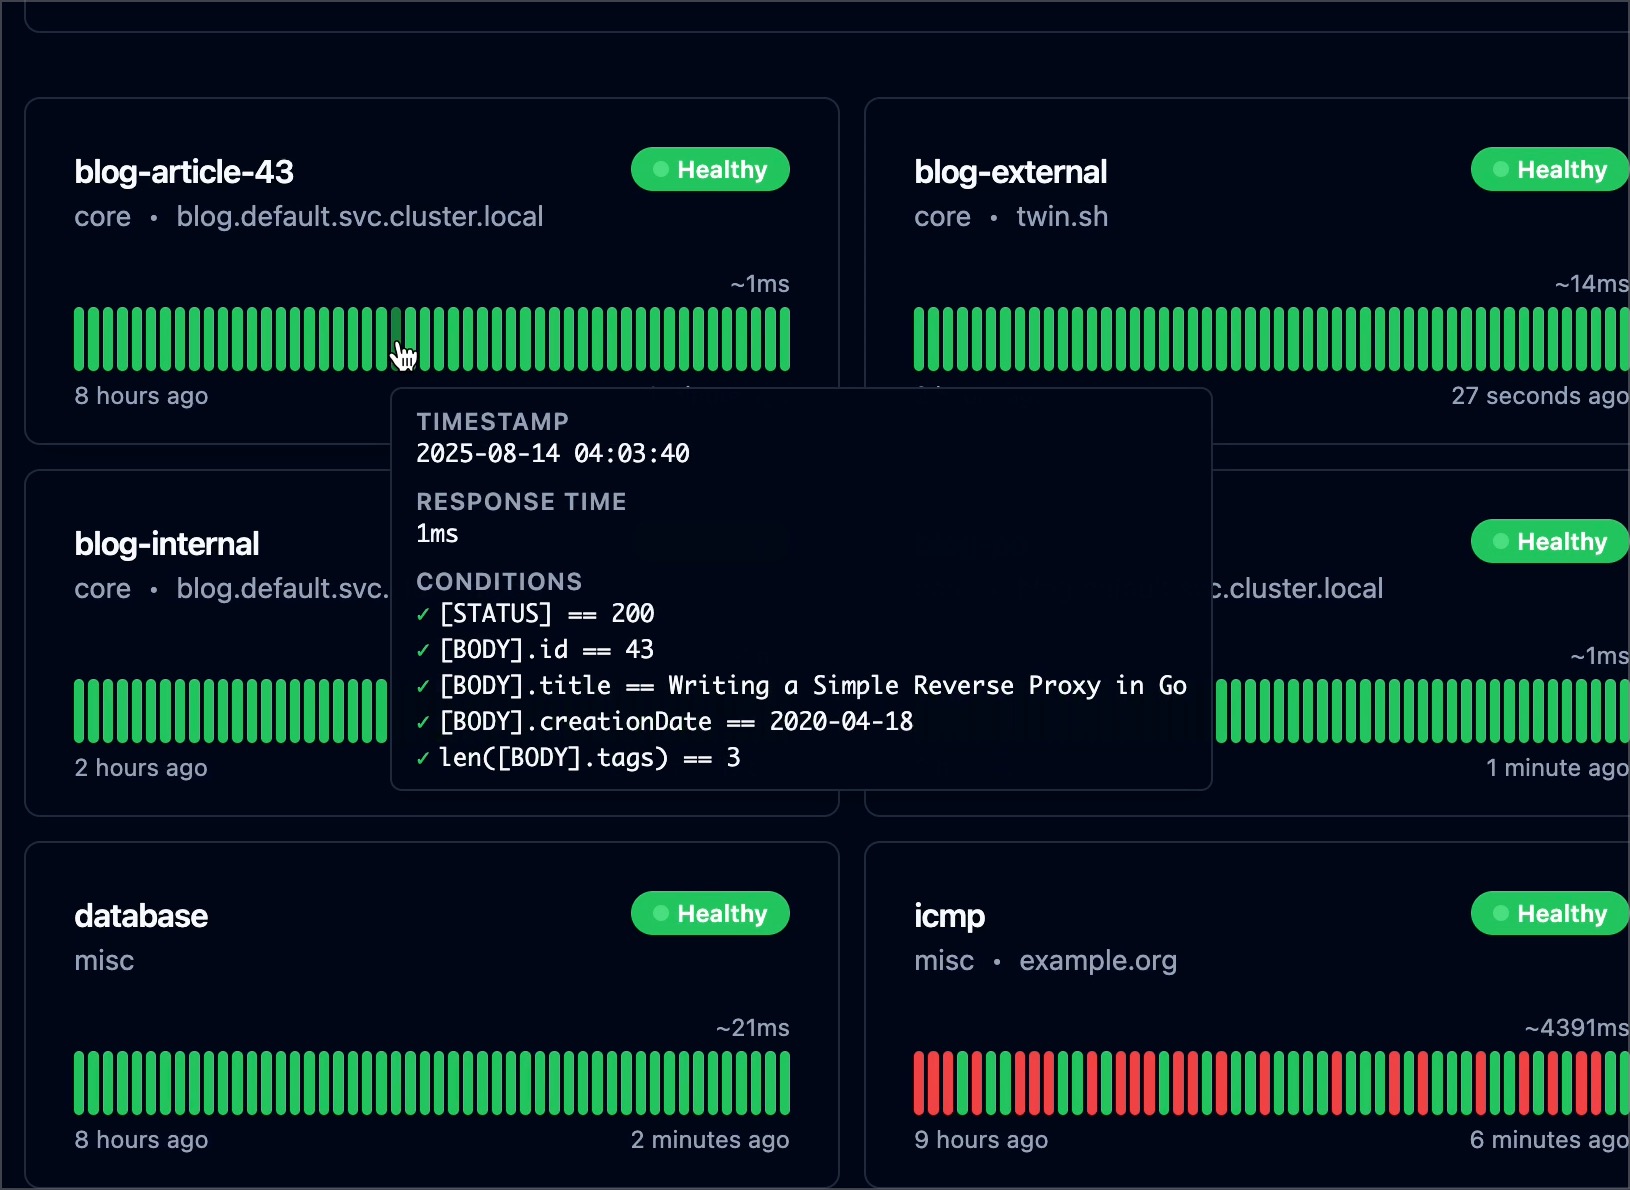
- Highly flexible health check conditions: While checking the response status may be enough for some use cases, Gatus goes much further and allows you to add conditions on the response time, the response body and even the IP address.
- Ability to use Gatus for user acceptance tests: Thanks to the point above, you can leverage this application to create automated user acceptance tests.
- Very easy to configure: Not only is the configuration designed to be as readable as possible, it's also extremely easy to add a new service or a new endpoint to monitor.
- Alerting: While having a pretty visual dashboard is useful to keep track of the state of your application(s), you probably don't want to stare at it all day. Thus, notifications via Slack, Mattermost, Messagebird, PagerDuty, Twilio, Google chat and Teams are supported out of the box with the ability to configure a custom alerting provider for any needs you might have, whether it be a different provider or a custom application that manages automated rollbacks.
- Metrics
- Low resource consumption: As with most Go applications, the resource footprint that this application requires is negligibly small.
- Badges:


- Dark mode
Usage
docker run -p 8080:8080 --name gatus ghcr.io/twin/gatus:stable
You can also use Docker Hub if you prefer:
docker run -p 8080:8080 --name gatus twinproduction/gatus:stable
If you want to create your own configuration, see Docker for information on how to mount a configuration file.
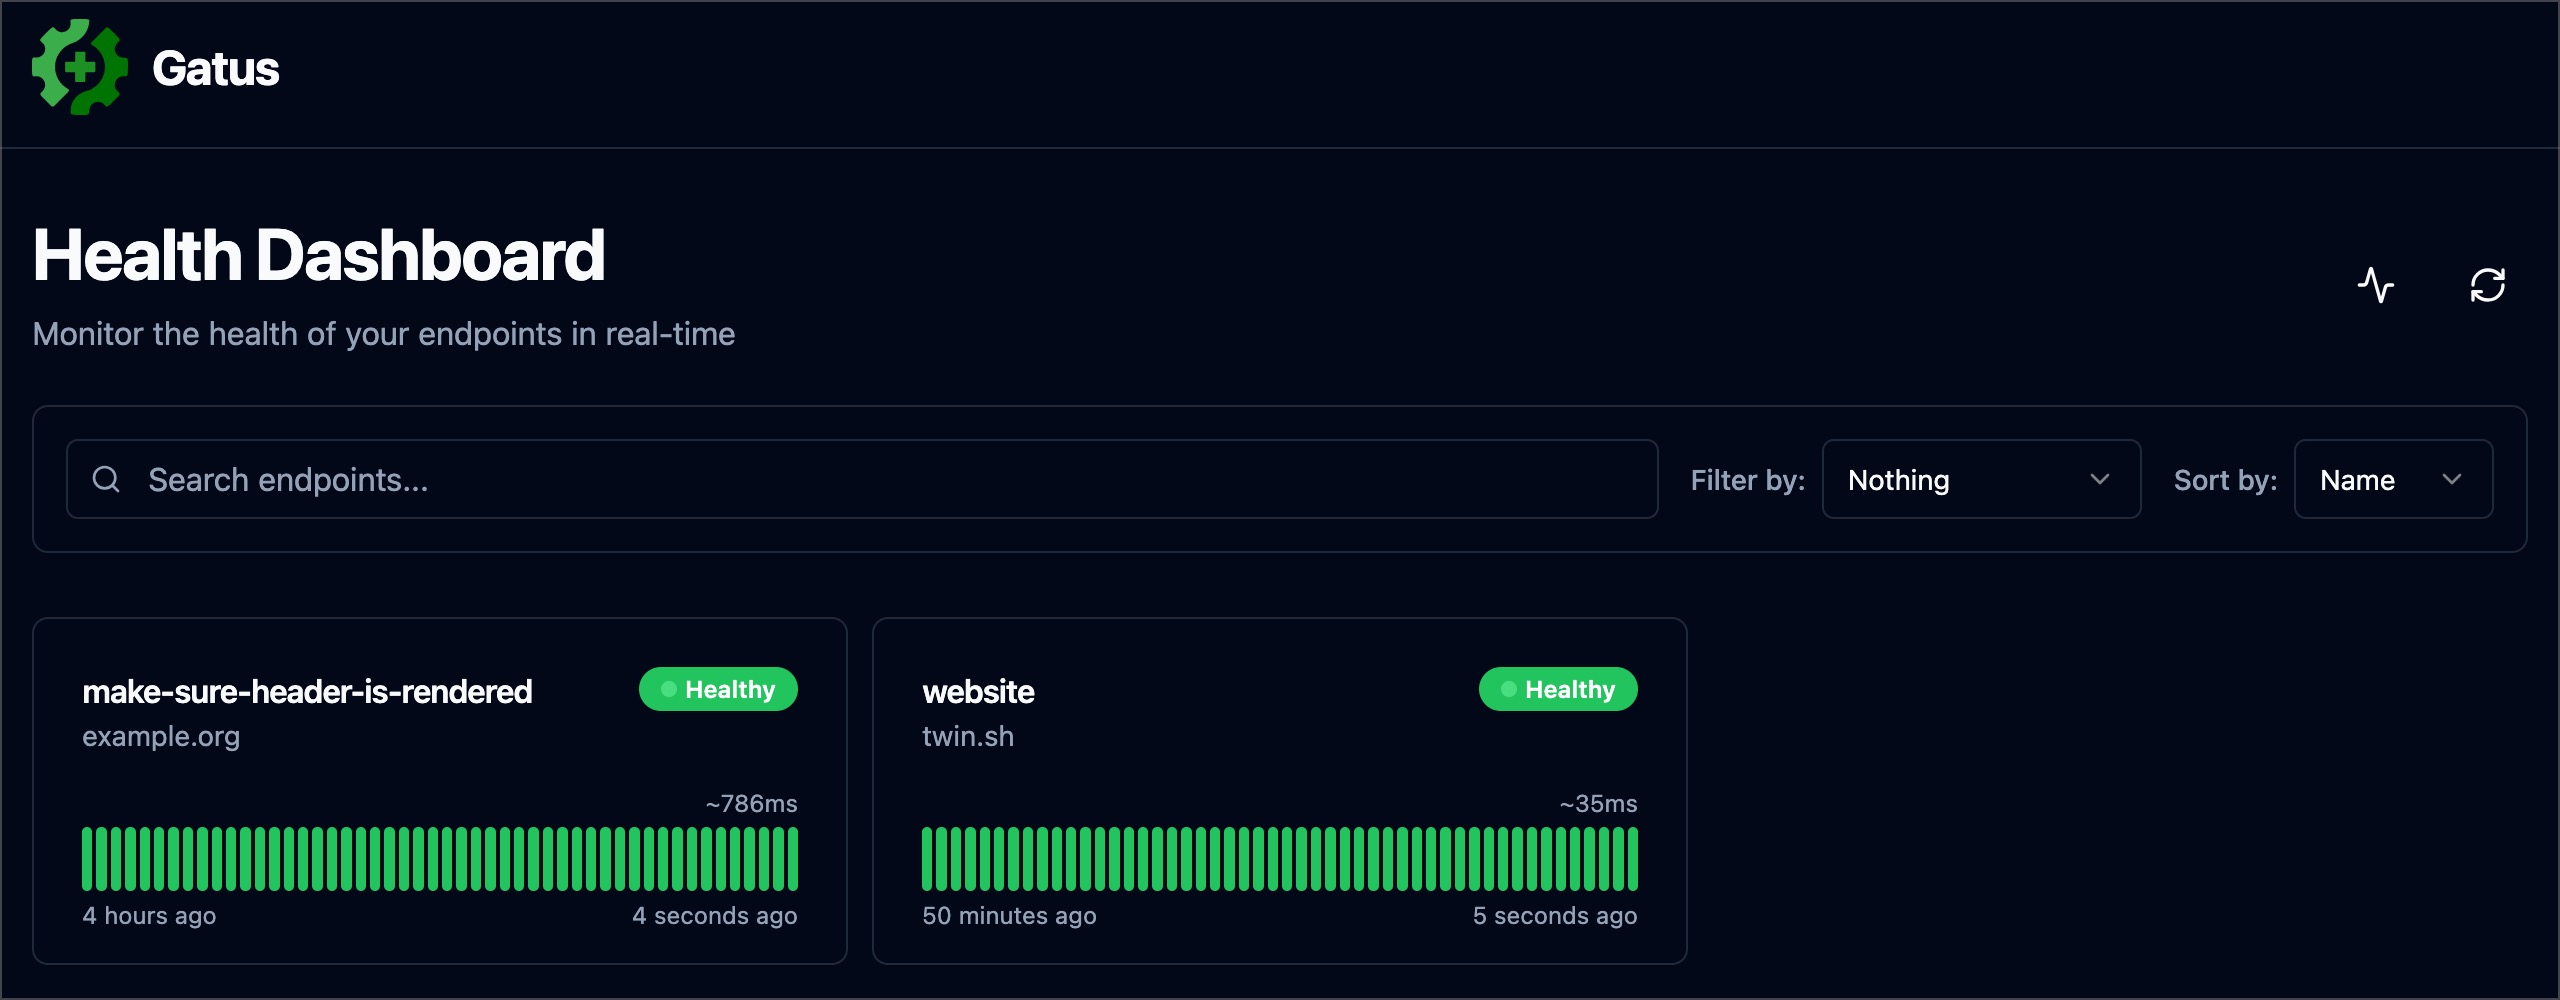
Here's a simple example:
endpoints:
  - name: website                 # Name of your endpoint, can be anything
    url: "https://twin.sh/health"
    interval: 5m                  # Duration to wait between every status check (default: 60s)
    conditions:
      - "[STATUS] == 200"         # Status must be 200
      - "[BODY].status == UP"     # The json path "$.status" must be equal to UP
      - "[RESPONSE_TIME] < 300"   # Response time must be under 300ms

  - name: make-sure-header-is-rendered
    url: "https://example.org/"
    interval: 60s
    conditions:
      - "[STATUS] == 200"                          # Status must be 200
      - "[BODY] == pat(*<h1>Example Domain</h1>*)" # Body must contain the specified header
This example would look similar to this:
If you want to test it locally, see Docker.
Configuration
By default, the configuration file is expected to be at config/config.yaml.
You can specify a custom path by setting the GATUS_CONFIG_PATH environment variable.
If GATUS_CONFIG_PATH points to a directory, all *.yaml and *.yml files inside said directory and its
subdirectories are merged like so:
- All maps/objects are deep merged (i.e. you could define
alerting.slack in one file and alerting.pagerduty in another file)
- All slices/arrays are appended (i.e. you can define
endpoints in multiple files and each endpoint will be added to the final list of endpoints)
- Parameters with a primitive value (e.g.
metrics, alerting.slack.webhook-url, etc.) may only be defined once to forcefully avoid any ambiguity
- To clarify, this also means that you could not define
alerting.slack.webhook-url in two files with different values. All files are merged into one before they are processed. This is by design.
💡 You can also use environment variables in the configuration file (e.g. $DOMAIN, ${DOMAIN})
⚠️ When your configuration parameter contains a $ symbol, you have to escape $ with $$.
See Use environment variables in config files or examples/docker-compose-postgres-storage/config/config.yaml for examples.
If you want to test it locally, see Docker.
Configuration
If you want more verbose logging, you may set the GATUS_LOG_LEVEL environment variable to DEBUG.
Conversely, if you want less verbose logging, you can set the aforementioned environment variable to WARN, ERROR or FATAL.
The default value for GATUS_LOG_LEVEL is INFO.
Endpoints
Endpoints are URLs, applications, or services that you want to monitor. Each endpoint has a list of conditions that are
evaluated on an interval that you define. If any condition fails, the endpoint is considered as unhealthy.
You can then configure alerts to be triggered when an endpoint is unhealthy once a certain threshold is reached.
| Parameter |
Description |
Default |
endpoints |
List of endpoints to monitor. |
Required [] |
endpoints[].enabled |
Whether to monitor the endpoint. |
true |
endpoints[].name |
Name of the endpoint. Can be anything. |
Required "" |
endpoints[].group |
Group name. Used to group multiple endpoints together on the dashboard.
See Endpoint groups. |
"" |
endpoints[].url |
URL to send the request to. |
Required "" |
endpoints[].method |
Request method. |
GET |
endpoints[].conditions |
Conditions used to determine the health of the endpoint.
See Conditions. |
[] |
endpoints[].interval |
Duration to wait between every status check. |
60s |
endpoints[].graphql |
Whether to wrap the body in a query param ({"query":"$body"}). |
false |
endpoints[].body |
Request body. |
"" |
endpoints[].headers |
Request headers. |
{} |
endpoints[].dns |
Configuration for an endpoint |
|

 Gatus 是一个面向开发者的开源状态页和健康监控面板:它会主动通过 HTTP、TCP、ICMP 或 DNS 探测你的服务,把结果展示在网页面板上,并在检查失败时向你发出警报。