






What is this?
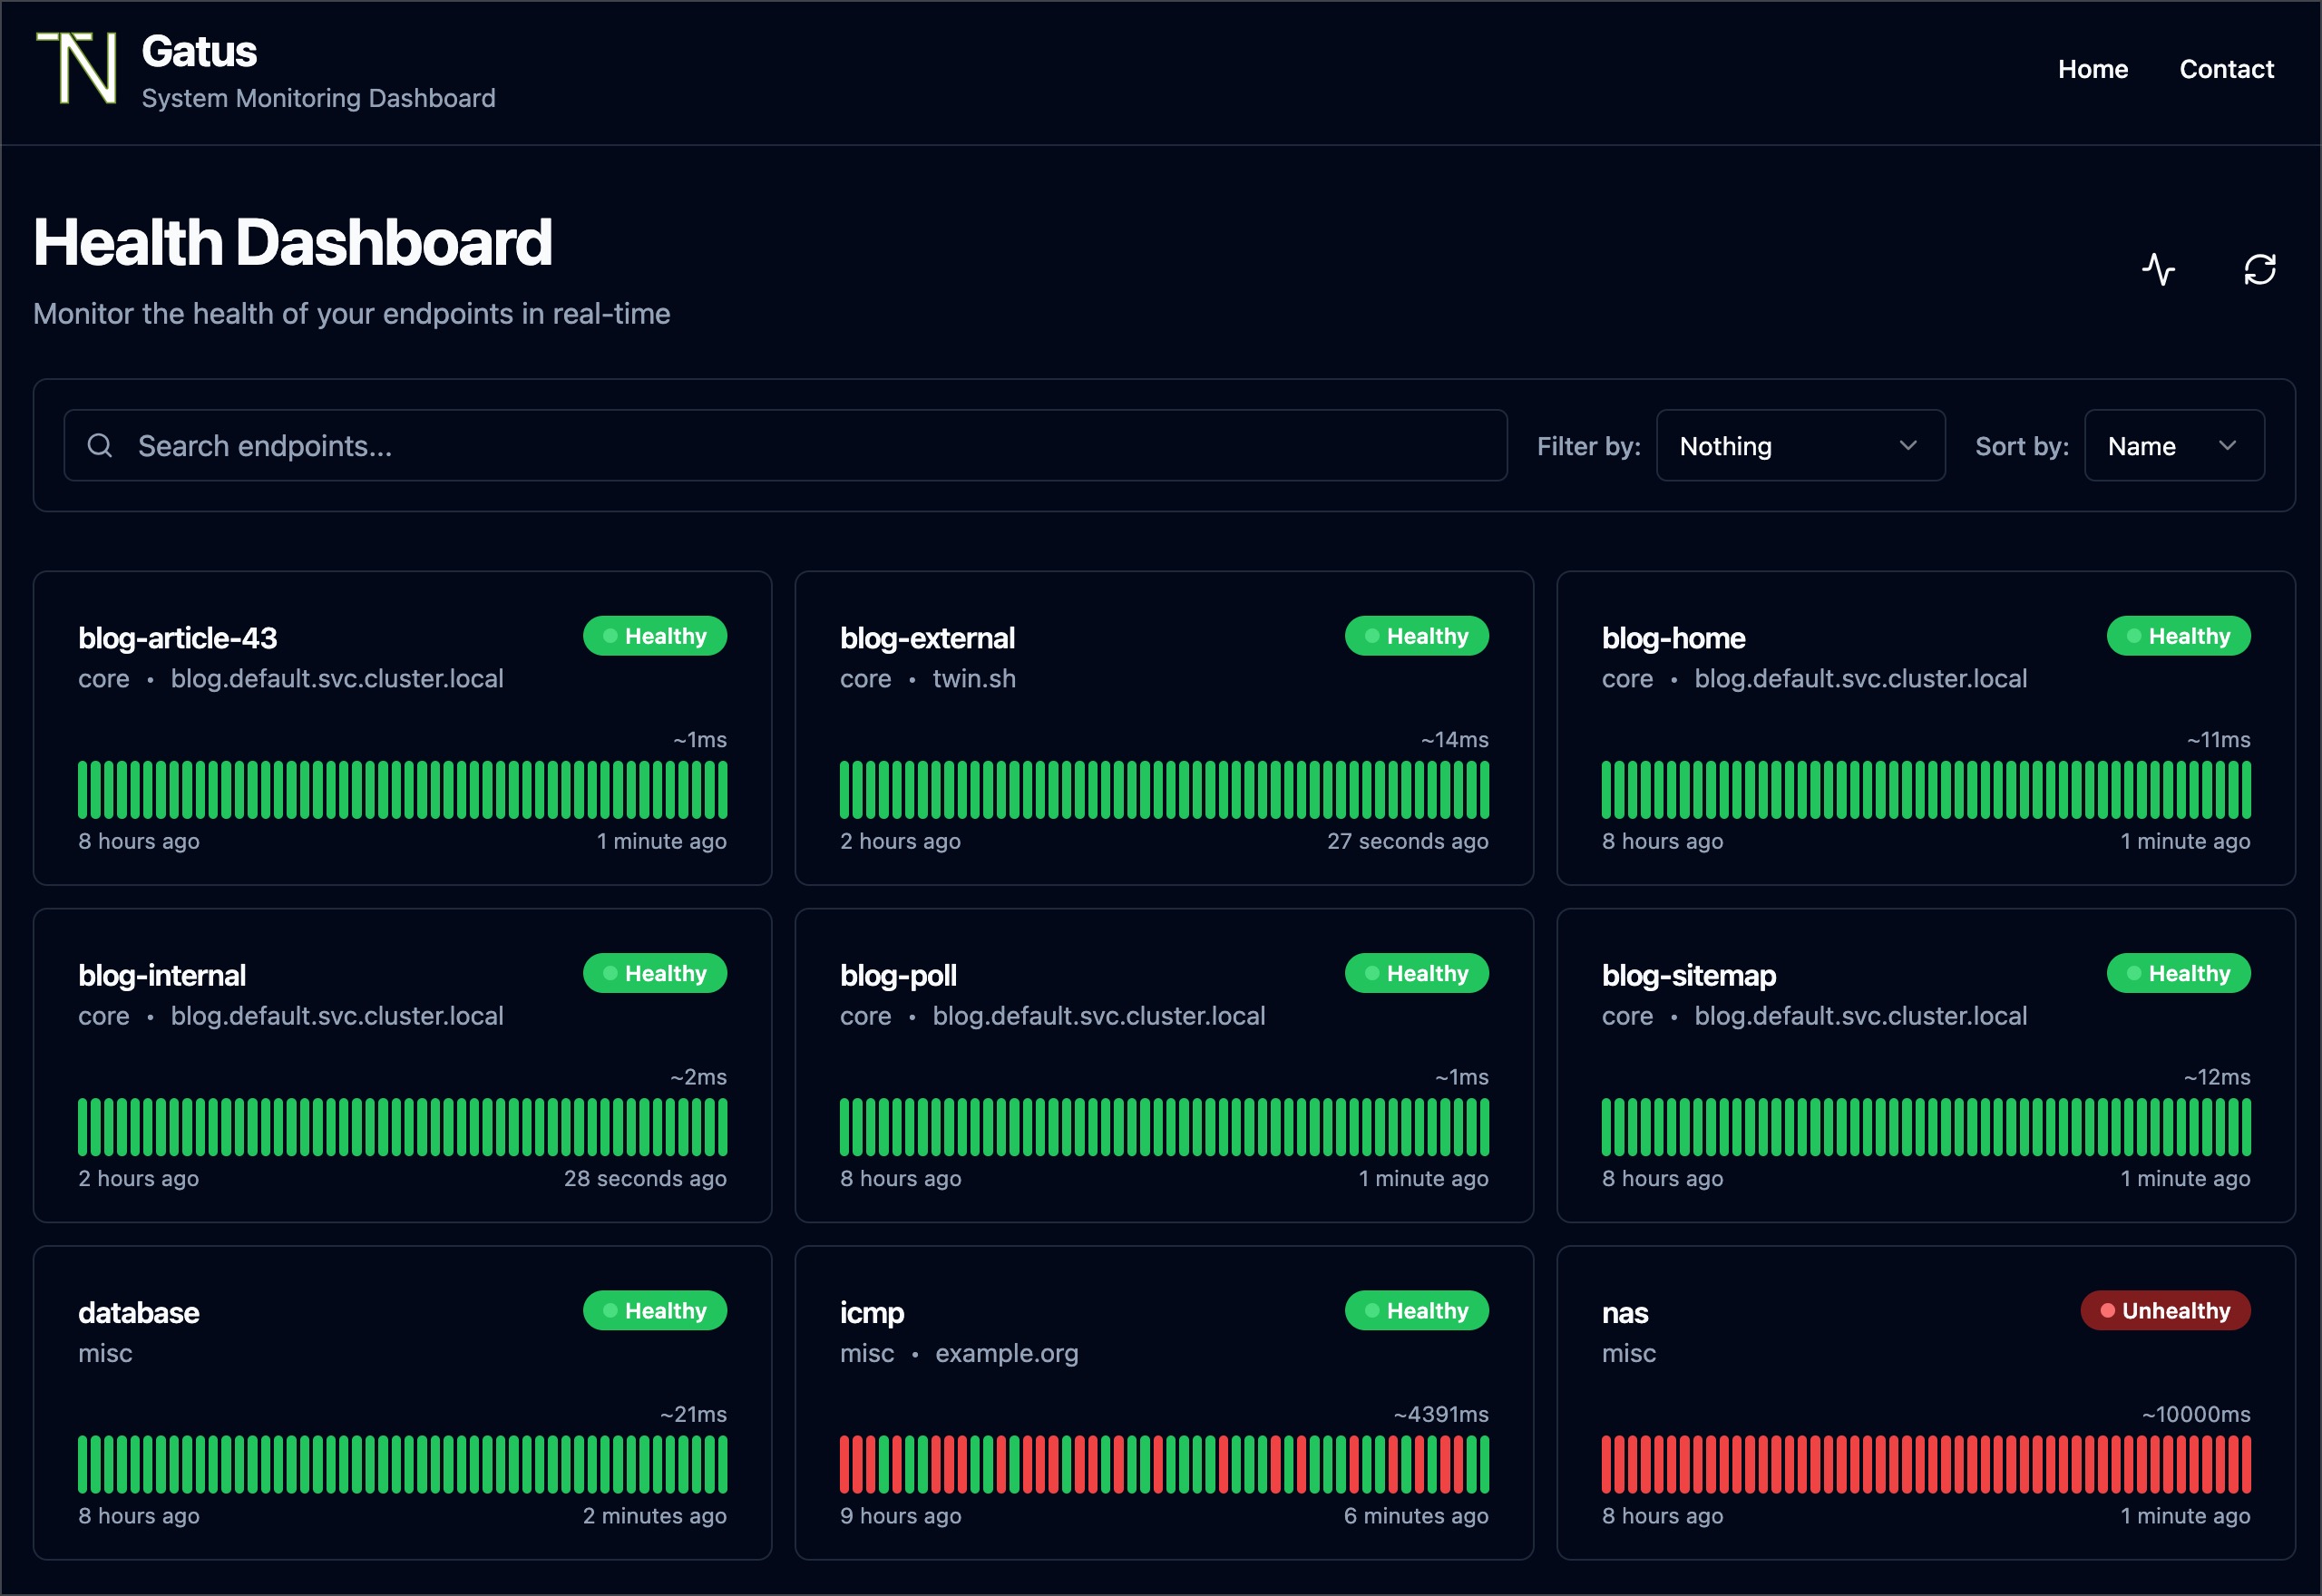
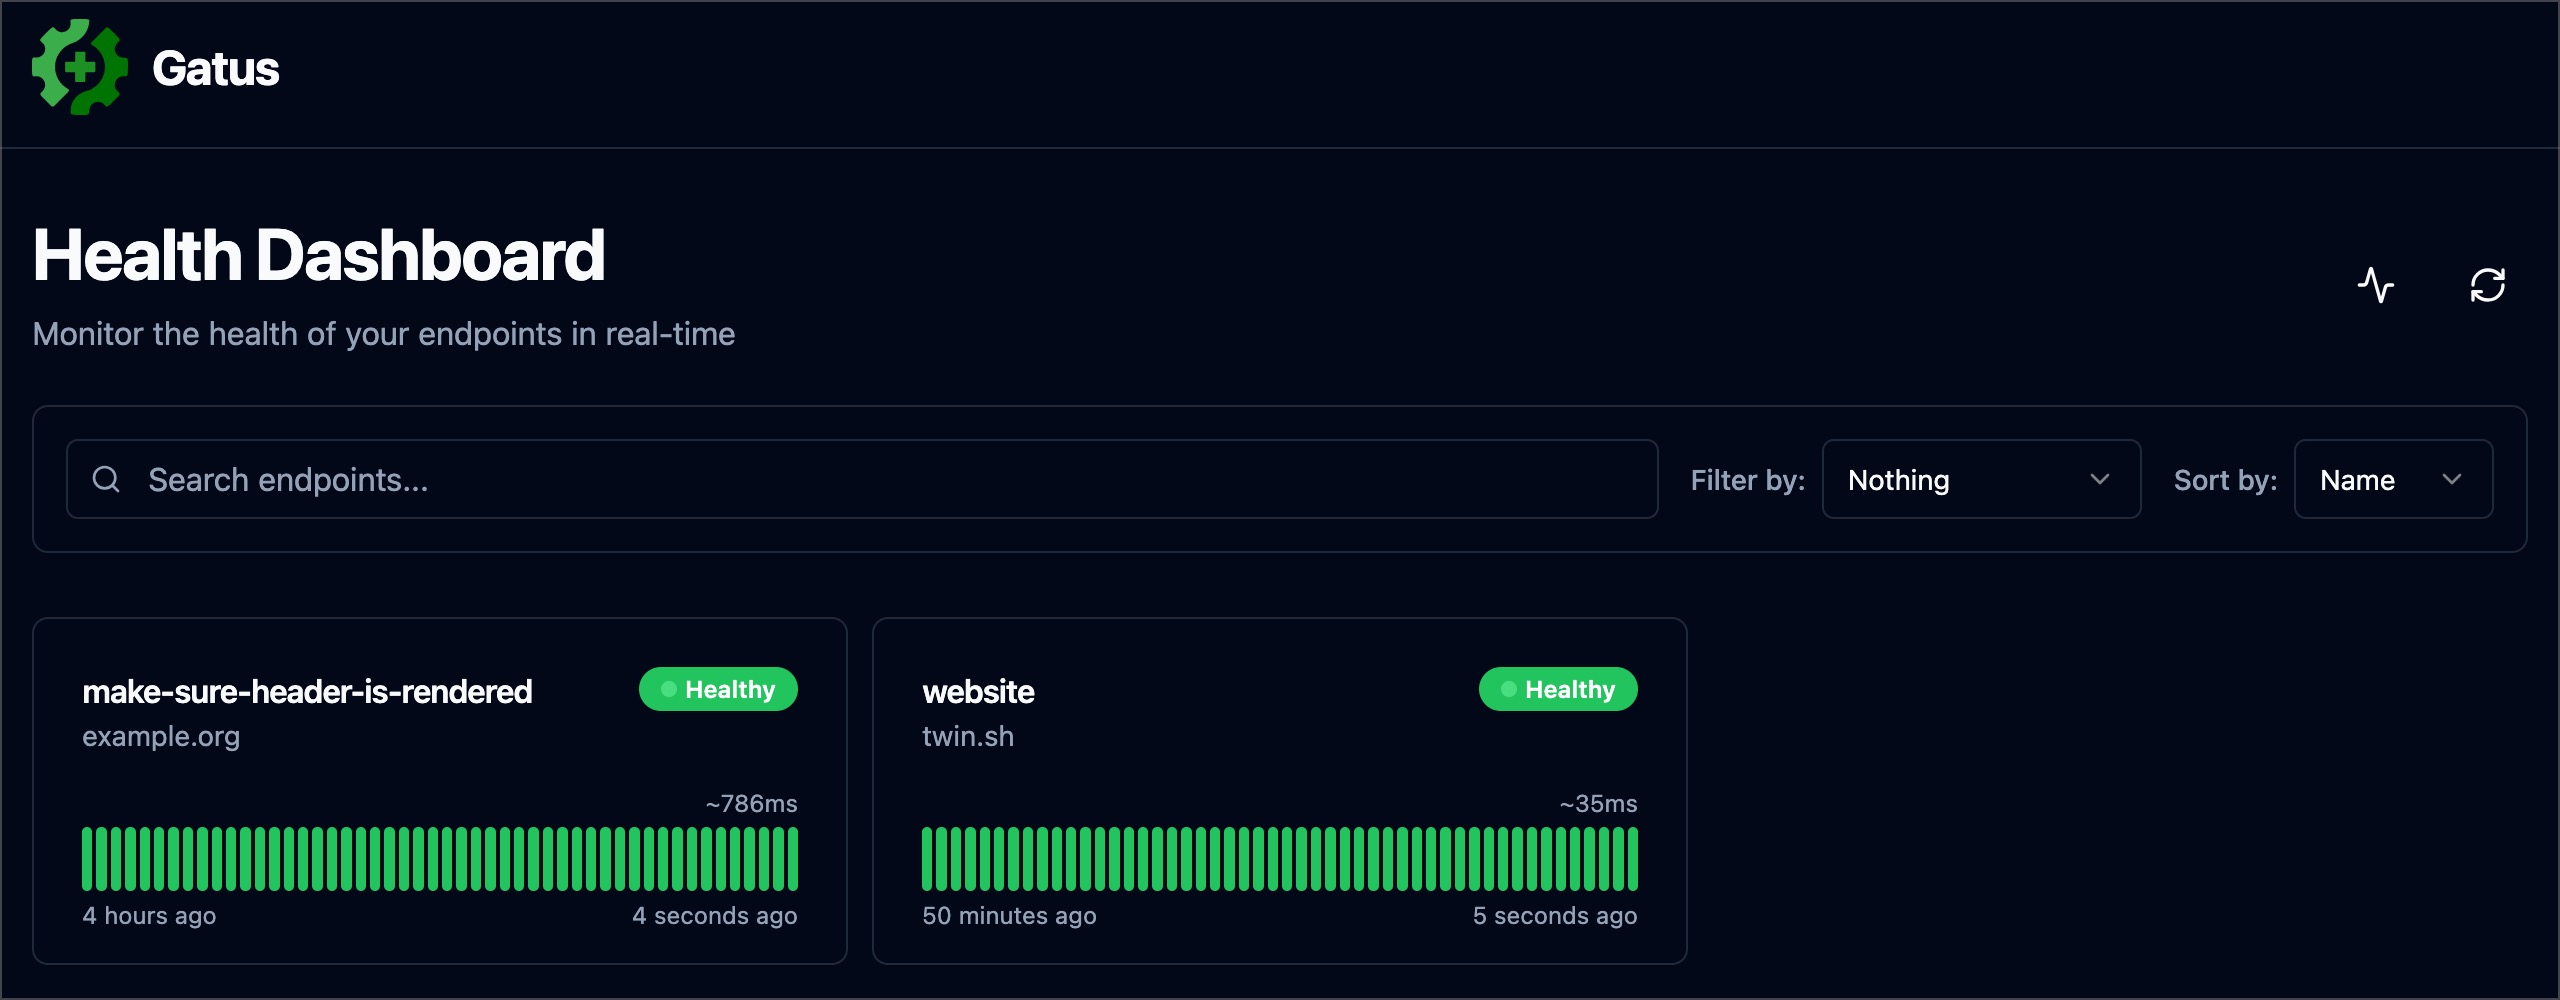
 Gatus is an open-source, developer-oriented status page and health dashboard: it actively probes your services over HTTP, TCP, ICMP or DNS, shows the results on a web dashboard, and can alert you when checks fail.
Gatus is an open-source, developer-oriented status page and health dashboard: it actively probes your services over HTTP, TCP, ICMP or DNS, shows the results on a web dashboard, and can alert you when checks fail.How is this different from Prometheus Alertmanager or Cloudwatch alerts?Metric-based alerting relies on existing traffic, so nothing fires if no client is calling the failing service. Gatus runs its own scheduled health checks, so it can alert you before your users notice an outage.
Metric-based alerting relies on existing traffic, so nothing fires if no client is calling the failing service. Gatus runs its own scheduled health checks, so it can alert you before your users notice an outage.How do I get it running?Run the Docker image (docker run -p 8080:8080 twinproduction/gatus) and mount your config file. Helm chart, Terraform, Kubernetes manifests and a plain binary install are also documented. Config is read from config/config.yaml by default.
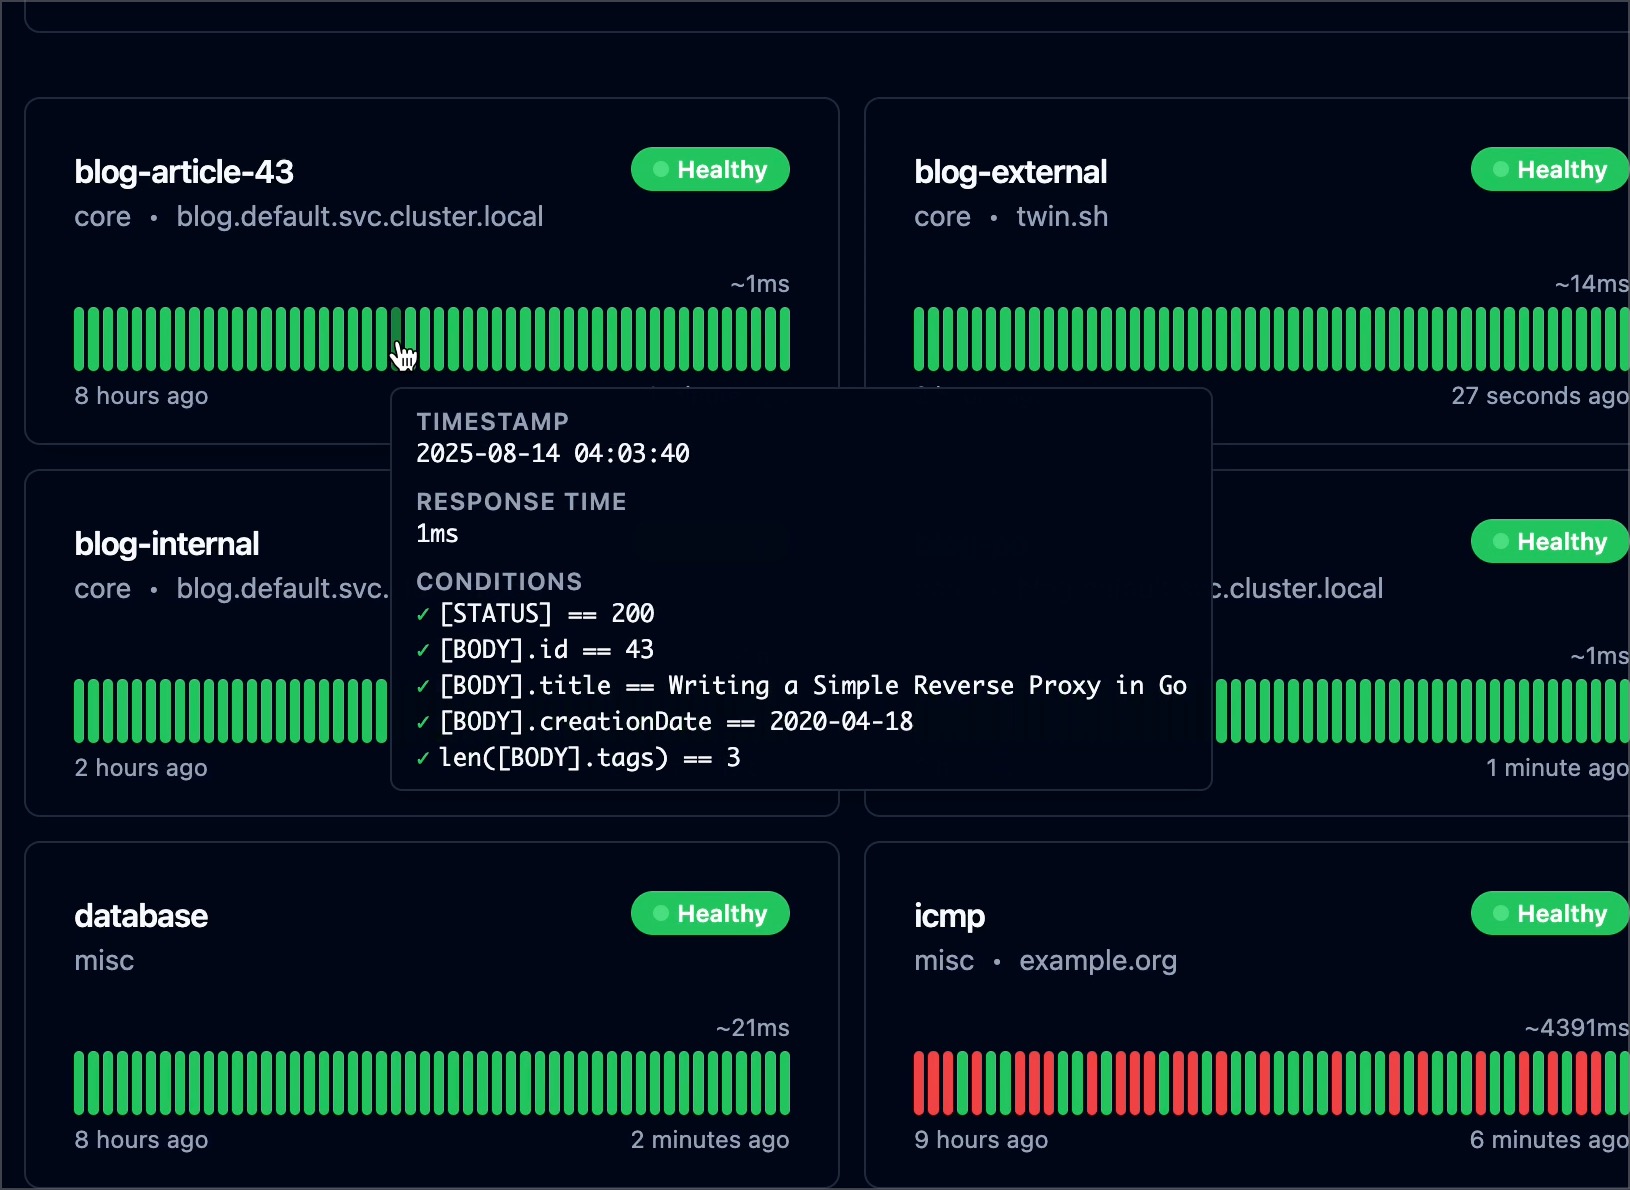
Run the Docker image (docker run -p 8080:8080 twinproduction/gatus) and mount your config file. Helm chart, Terraform, Kubernetes manifests and a plain binary install are also documented. Config is read from config/config.yaml by default.What does configuring a health check look like?Just YAML: each endpoint gets a name, a URL, a method, an interval and a list of conditions on values like status code, response time, response body or certificate expiration. No agent is installed on the monitored services.
Just YAML: each endpoint gets a name, a URL, a method, an interval and a list of conditions on values like status code, response time, response body or certificate expiration. No agent is installed on the monitored services.Anything still experimental or deprecated I should know about?Yes — Suites are marked ALPHA, remote instances are EXPERIMENTAL, and the old Teams alerting is deprecated in favor of Teams Workflow alerts. Config files are also strict: a primitive parameter defined twice across merged files is rejected.
Yes — Suites are marked ALPHA, remote instances are EXPERIMENTAL, and the old Teams alerting is deprecated in favor of Teams Workflow alerts. Config files are also strict: a primitive parameter defined twice across merged files is rejected.Is this built for ops teams or solo developers?Developer-oriented by design: the author runs it in his own Kubernetes cluster to watch core applications, and deployments range from a single Docker container to Helm and Terraform — a fit for anyone self-hosting services.
Developer-oriented by design: the author runs it in his own Kubernetes cluster to watch core applications, and deployments range from a single Docker container to Helm and Terraform — a fit for anyone self-hosting services.Does it phone home or send my data anywhere?It is fully self-hosted: checks run from wherever you deploy it and results stay in your own storage (a docker-compose example for PostgreSQL is included). Sensitive config values can be injected via environment variables; a managed alternative exists at Gatus.io.
It is fully self-hosted: checks run from wherever you deploy it and results stay in your own storage (a docker-compose example for PostgreSQL is included). Sensitive config values can be injected via environment variables; a managed alternative exists at Gatus.io.What can it check besides plain HTTP URLs?Beyond HTTP/HTTPS it can probe TCP, UDP and SCTP ports, ping hosts via ICMP, run DNS queries, hit WebSocket and gRPC endpoints, check SSH, STARTTLS and TLS services, send GraphQL requests, and even track domain expiration dates.
Beyond HTTP/HTTPS it can probe TCP, UDP and SCTP ports, ping hosts via ICMP, run DNS queries, hit WebSocket and gRPC endpoints, check SSH, STARTTLS and TLS services, send GraphQL requests, and even track domain expiration dates.What happens when a check fails?Once a failure threshold is reached, Gatus alerts you through one of its many built-in providers — Slack, Teams, PagerDuty, Discord, Telegram, Twilio, email and dozens more — or a custom alerting provider you write yourself. A default alert can be configured for all endpoints at once.
Once a failure threshold is reached, Gatus alerts you through one of its many built-in providers — Slack, Teams, PagerDuty, Discord, Telegram, Twilio, email and dozens more — or a custom alerting provider you write yourself. A default alert can be configured for all endpoints at once.Can I pull data out or embed status badges elsewhere?Yes. There is a programmatic API exposing raw data, uptime and response-time series, plus generated badges for uptime, health (Shields.io-compatible) and response time, with configurable color thresholds.
Yes. There is a programmatic API exposing raw data, uptime and response-time series, plus generated badges for uptime, health (Shields.io-compatible) and response time, with configurable color thresholds.Could I use this as an automated smoke-test runner?That is an advertised use case: since conditions can assert on status codes, response bodies, response times and even the resolved IP, the README suggests leveraging Gatus to create automated user acceptance tests.
That is an advertised use case: since conditions can assert on status codes, response bodies, response times and even the resolved IP, the README suggests leveraging Gatus to create automated user acceptance tests.What are similar projects?uptime-kuma, Checkmate, nezha, upptime, keep, healthchecks, labtether, kubeshark
uptime-kuma, Checkmate, nezha, upptime, keep, healthchecks, labtether, kubesharkWhich topics is it in?uptime-monitoring, monitoring-tool, status, monitor, health, selfhosted, alerting, container, helm, prometheus, notifications, slack
uptime-monitoring, monitoring-tool, status, monitor, health, selfhosted, alerting, container, helm, prometheus, notifications, slack