Compare models, prices and allowances · English / 中文
English | 中文
Real API Pricing
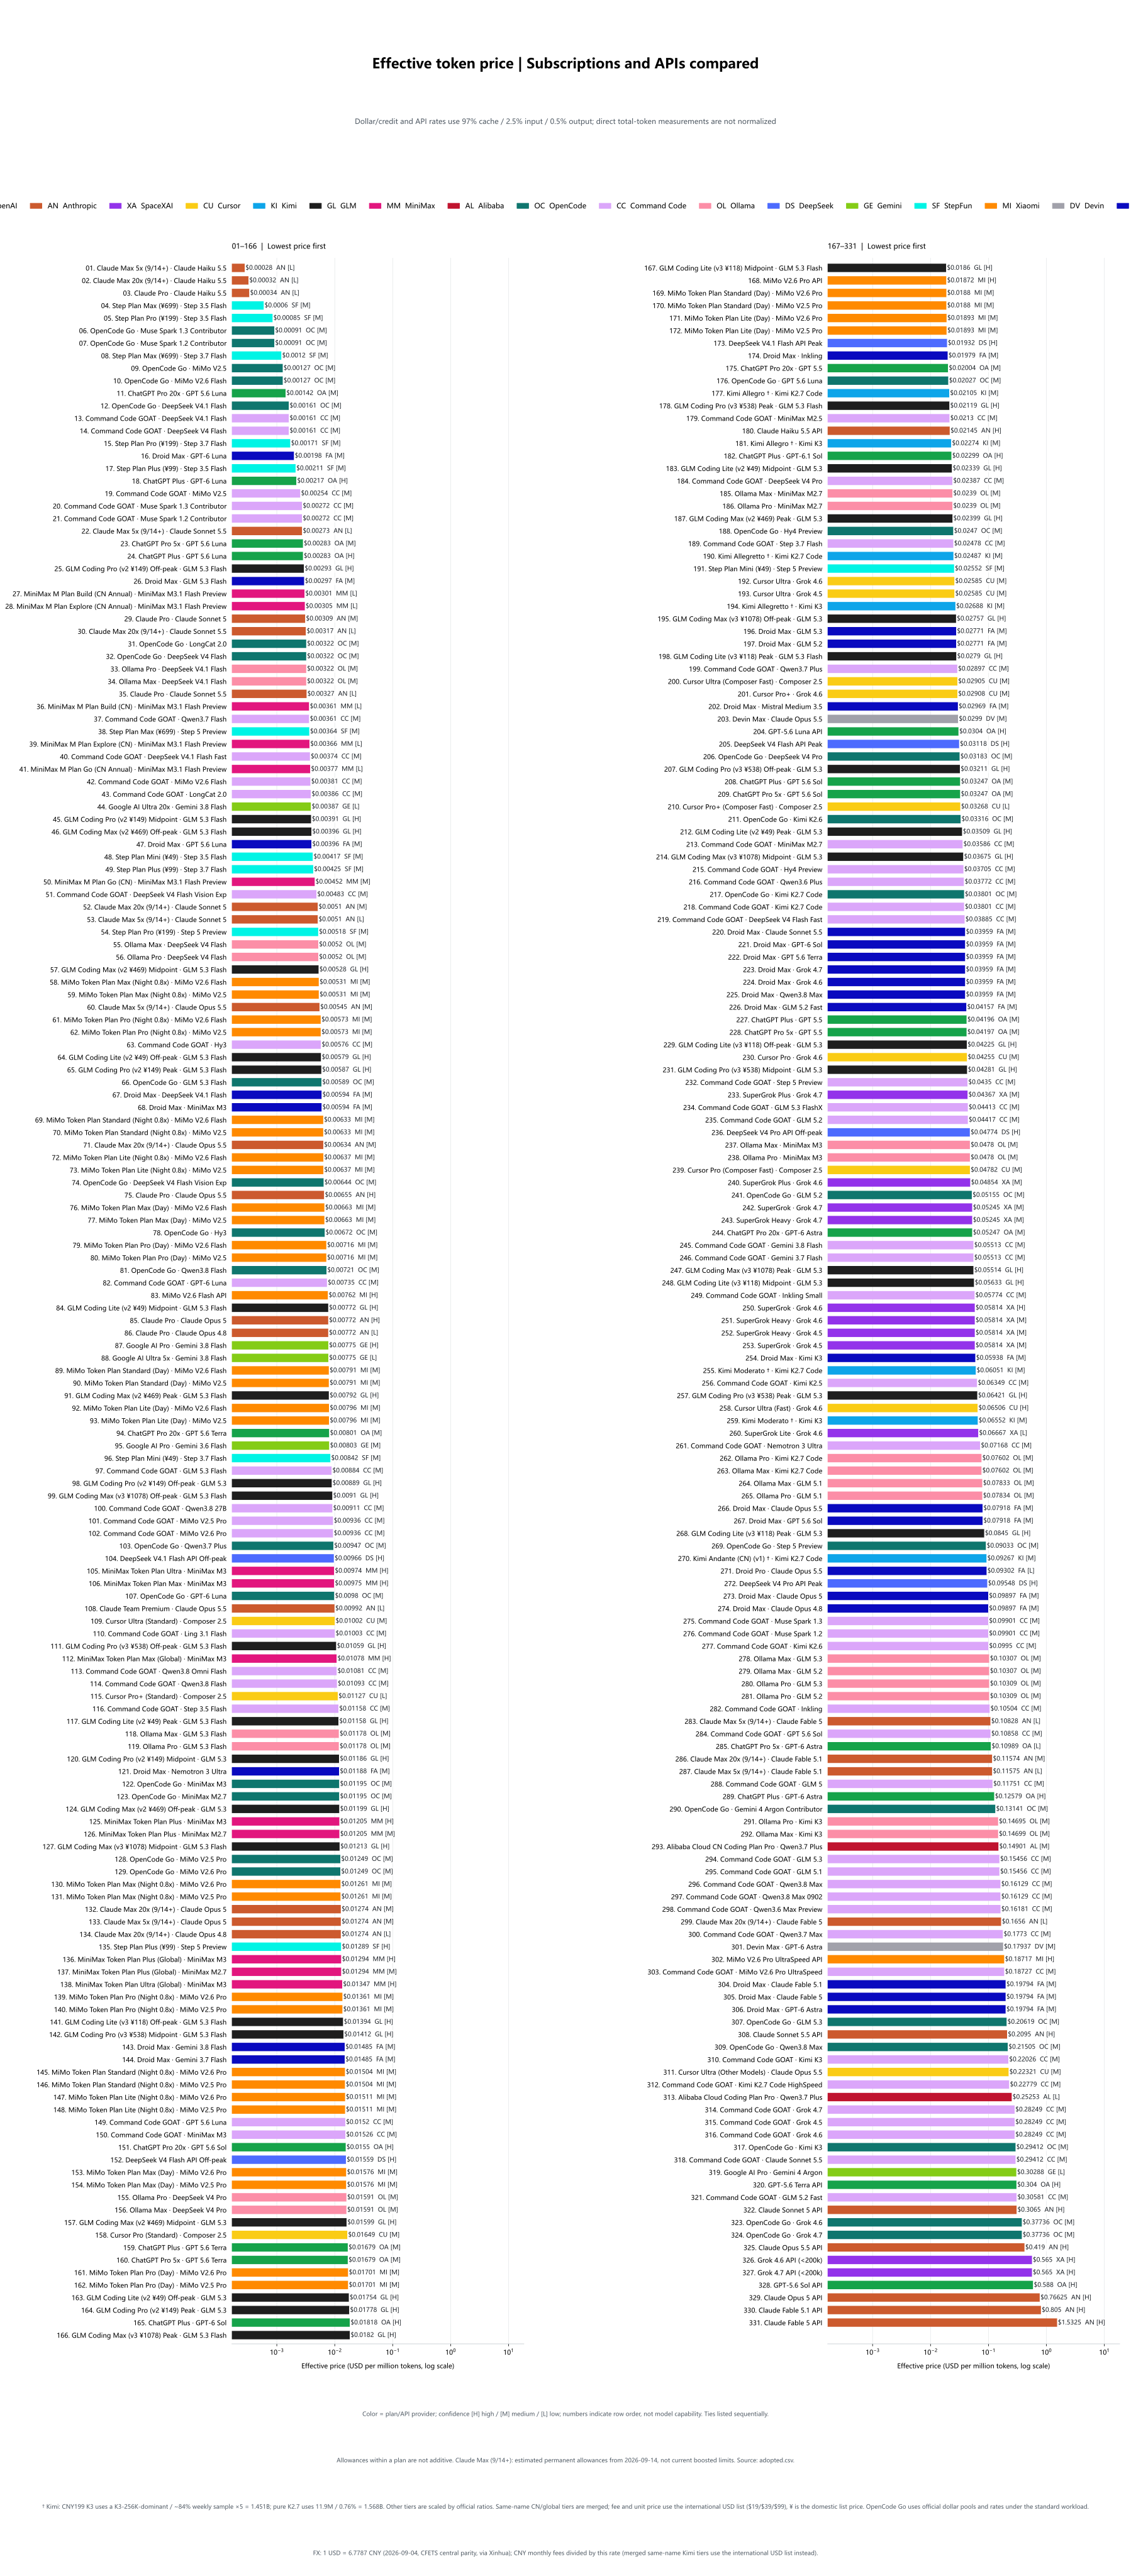
Real unit price = monthly subscription fee ÷ monthly usable tokens.
Full adopted data is shown first, followed by one Pareto chart per leaderboard. Monthly figures default to four weeks of saturated use; vendor-defined monthly pools remain as defined (Kimi's monthly pool is 5× its weekly pool). Input, output and cache tokens are all included. Prices use a logarithmic axis, with cheaper points farther right.
Dollar/credit pools and three-part token prices are converted with one project-wide standard workload: 97.5% cache reads, 2.15% fresh input, and 0.35% output. This is a comparison convention, not a claim about any provider's actual workload. Measurements that already report total tokens—dashboard back-calculations, local usage logs, controlled saturation tests, and official absolute-token tables—are not normalized again. Where only total tokens and a cost-weighted percentage are available but the token-type split is unknown, the observed total is retained and the limitation is recorded rather than inventing a split. Cache writes are not modeled separately; where a provider charges for them, converted token allowances may be overstated. See conventions and the token-mix audit.
GLM Coding Plan is recomputed from Zhipu's official weekly credits and cache/input/output coefficients under the same standard workload. Peak, midpoint and off-peak scenarios are shown separately instead of copying the official 95%-cache example table. A Caijing saturation-cost test and community evidence are consistent in scale, but there is still no fully specified independent V3 Pro/Max saturation test. See the official-table archive and community-evidence review.
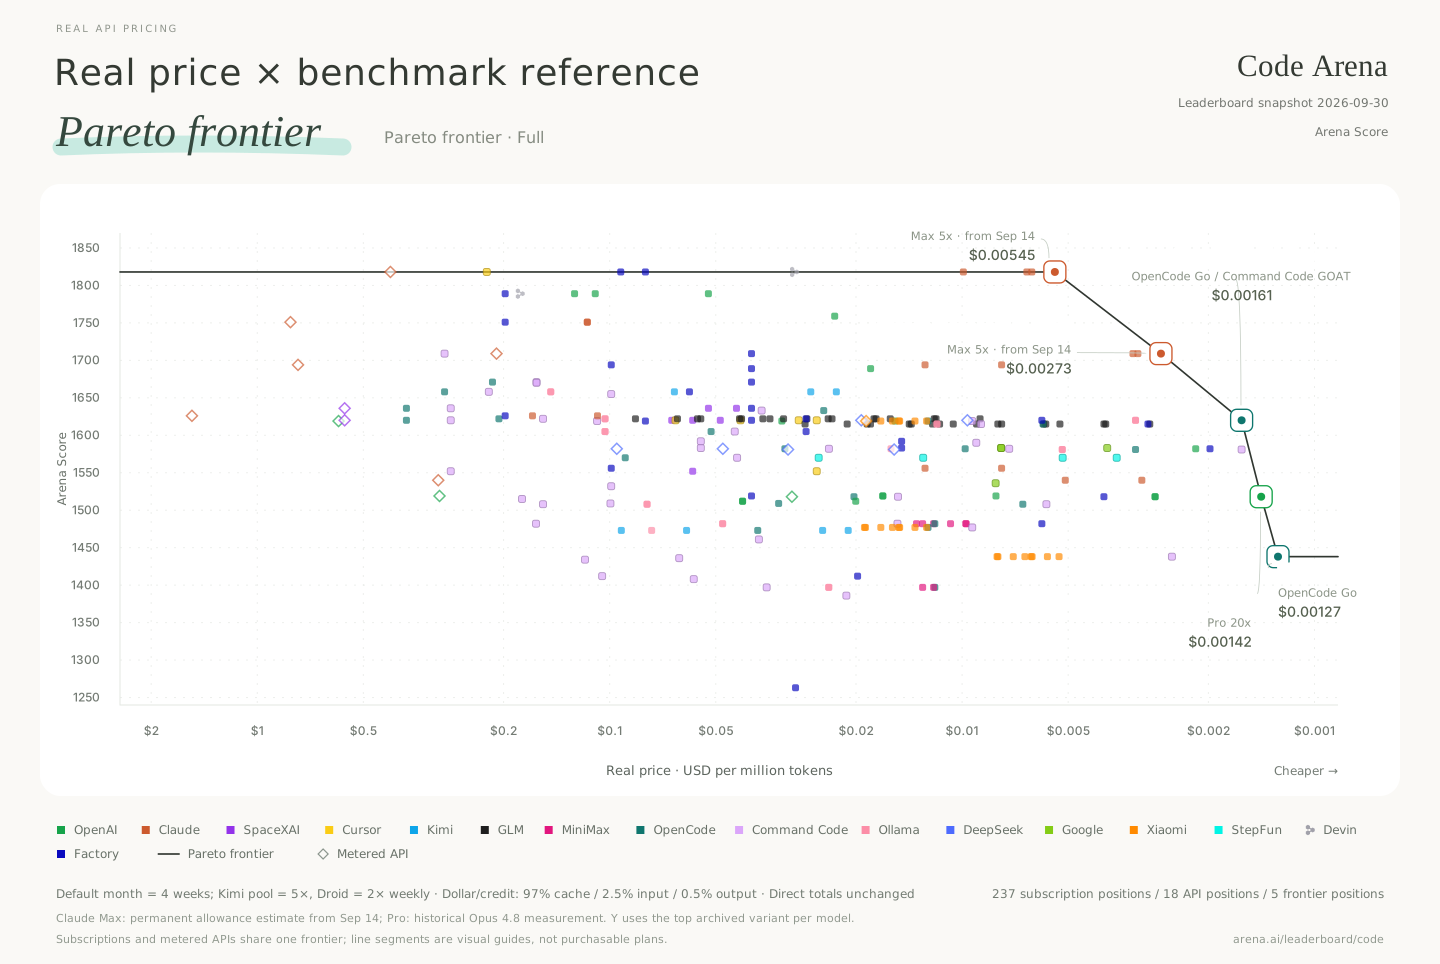
Each chart uses scores from its named leaderboard only. Code Arena here specifically means the WebDev Overall Arena Score, not general coding ability. OpenDesign Arena uses the 0–100 average task score (requirements 30 + design quality 70); its cost/speed-weighted recommendation score is not used. GPT-5.6 Luna now uses a ChatGPT Plus dashboard measurement: 112.67 million total tokens consumed about 6% of the weekly allowance, giving 7.511 billion tokens/month for Plus. The 5x and 20x plans are scaled from that measured Plus baseline, so the rightmost Luna point is 150.222 billion tokens/month at medium confidence rather than the superseded 240.24 billion Sol-credit derivation. Claude Max's 15.7 billion-token estimate applies to the permanent terms from September 14, 2026, not a promotional ceiling. Chinese charts use 100-million-token units: 77.37 in Chinese equals 7.737 billion in English.
All charts: English / 中文, SVG / PNG · English files · 中文文件
Data snapshot
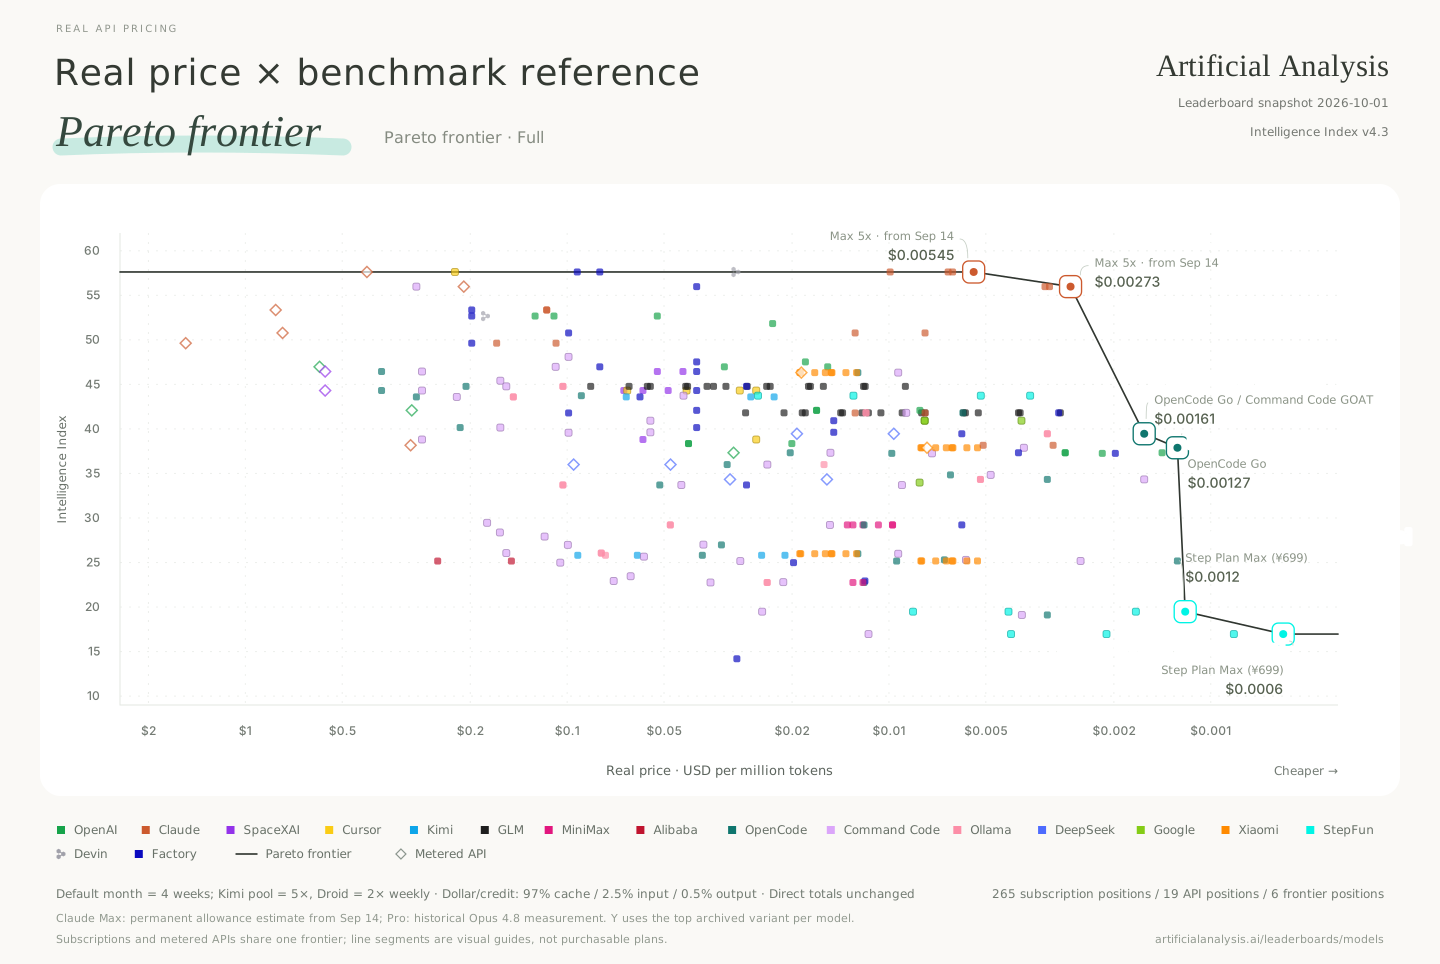
AA Intelligence now uses Intelligence Index v4.3 (announced September 7, 2026); AA Coding Agent remains v1.4. The new intelligence methodology replaces the old snapshot as a whole: lower numerical scores are not evidence of model regression across index versions. All configurations within the selected snapshot are retained, including explicitly marked AA estimates. Historical evidence stays in data/research/.
Snapshot: 2026-09-09. Each row is one plan × actual served model; allowances of different models under the same plan are alternatives and must not be added together.
| Coverage |
Rows |
| All adopted plan × model points |
188 |
| Subscription points with monthly allowance |
175 |
| Metered API baselines |
13 |
| OpenCode Go / Command Code GOAT / Ollama models |
27 / 37 / 20 |
| Code Arena / Agent Arena scored points |
136 / 140 |
| AA Intelligence / AA Coding Agent scored points |
165 / 71 |
| OpenDesign Arena scored points |
65 |
Download the data: adopted values (CSV) · computed points (CSV) · computed points (JSON) · data notes and score coverage · dated evidence
Monthly allowance overview
The 175 subscription plan × model points are split by adopted USD monthly fee so GitHub can show them without packing every bar into one chart: $0–30 inclusive, >$30 and ≤$100, >$100–$300. Each band ranks monthly usable tokens independently. The undivided chart and hybrid-scale view stay in the chart index.
$0–30
English SVG · 中文 SVG · English PNG · 中文 PNG
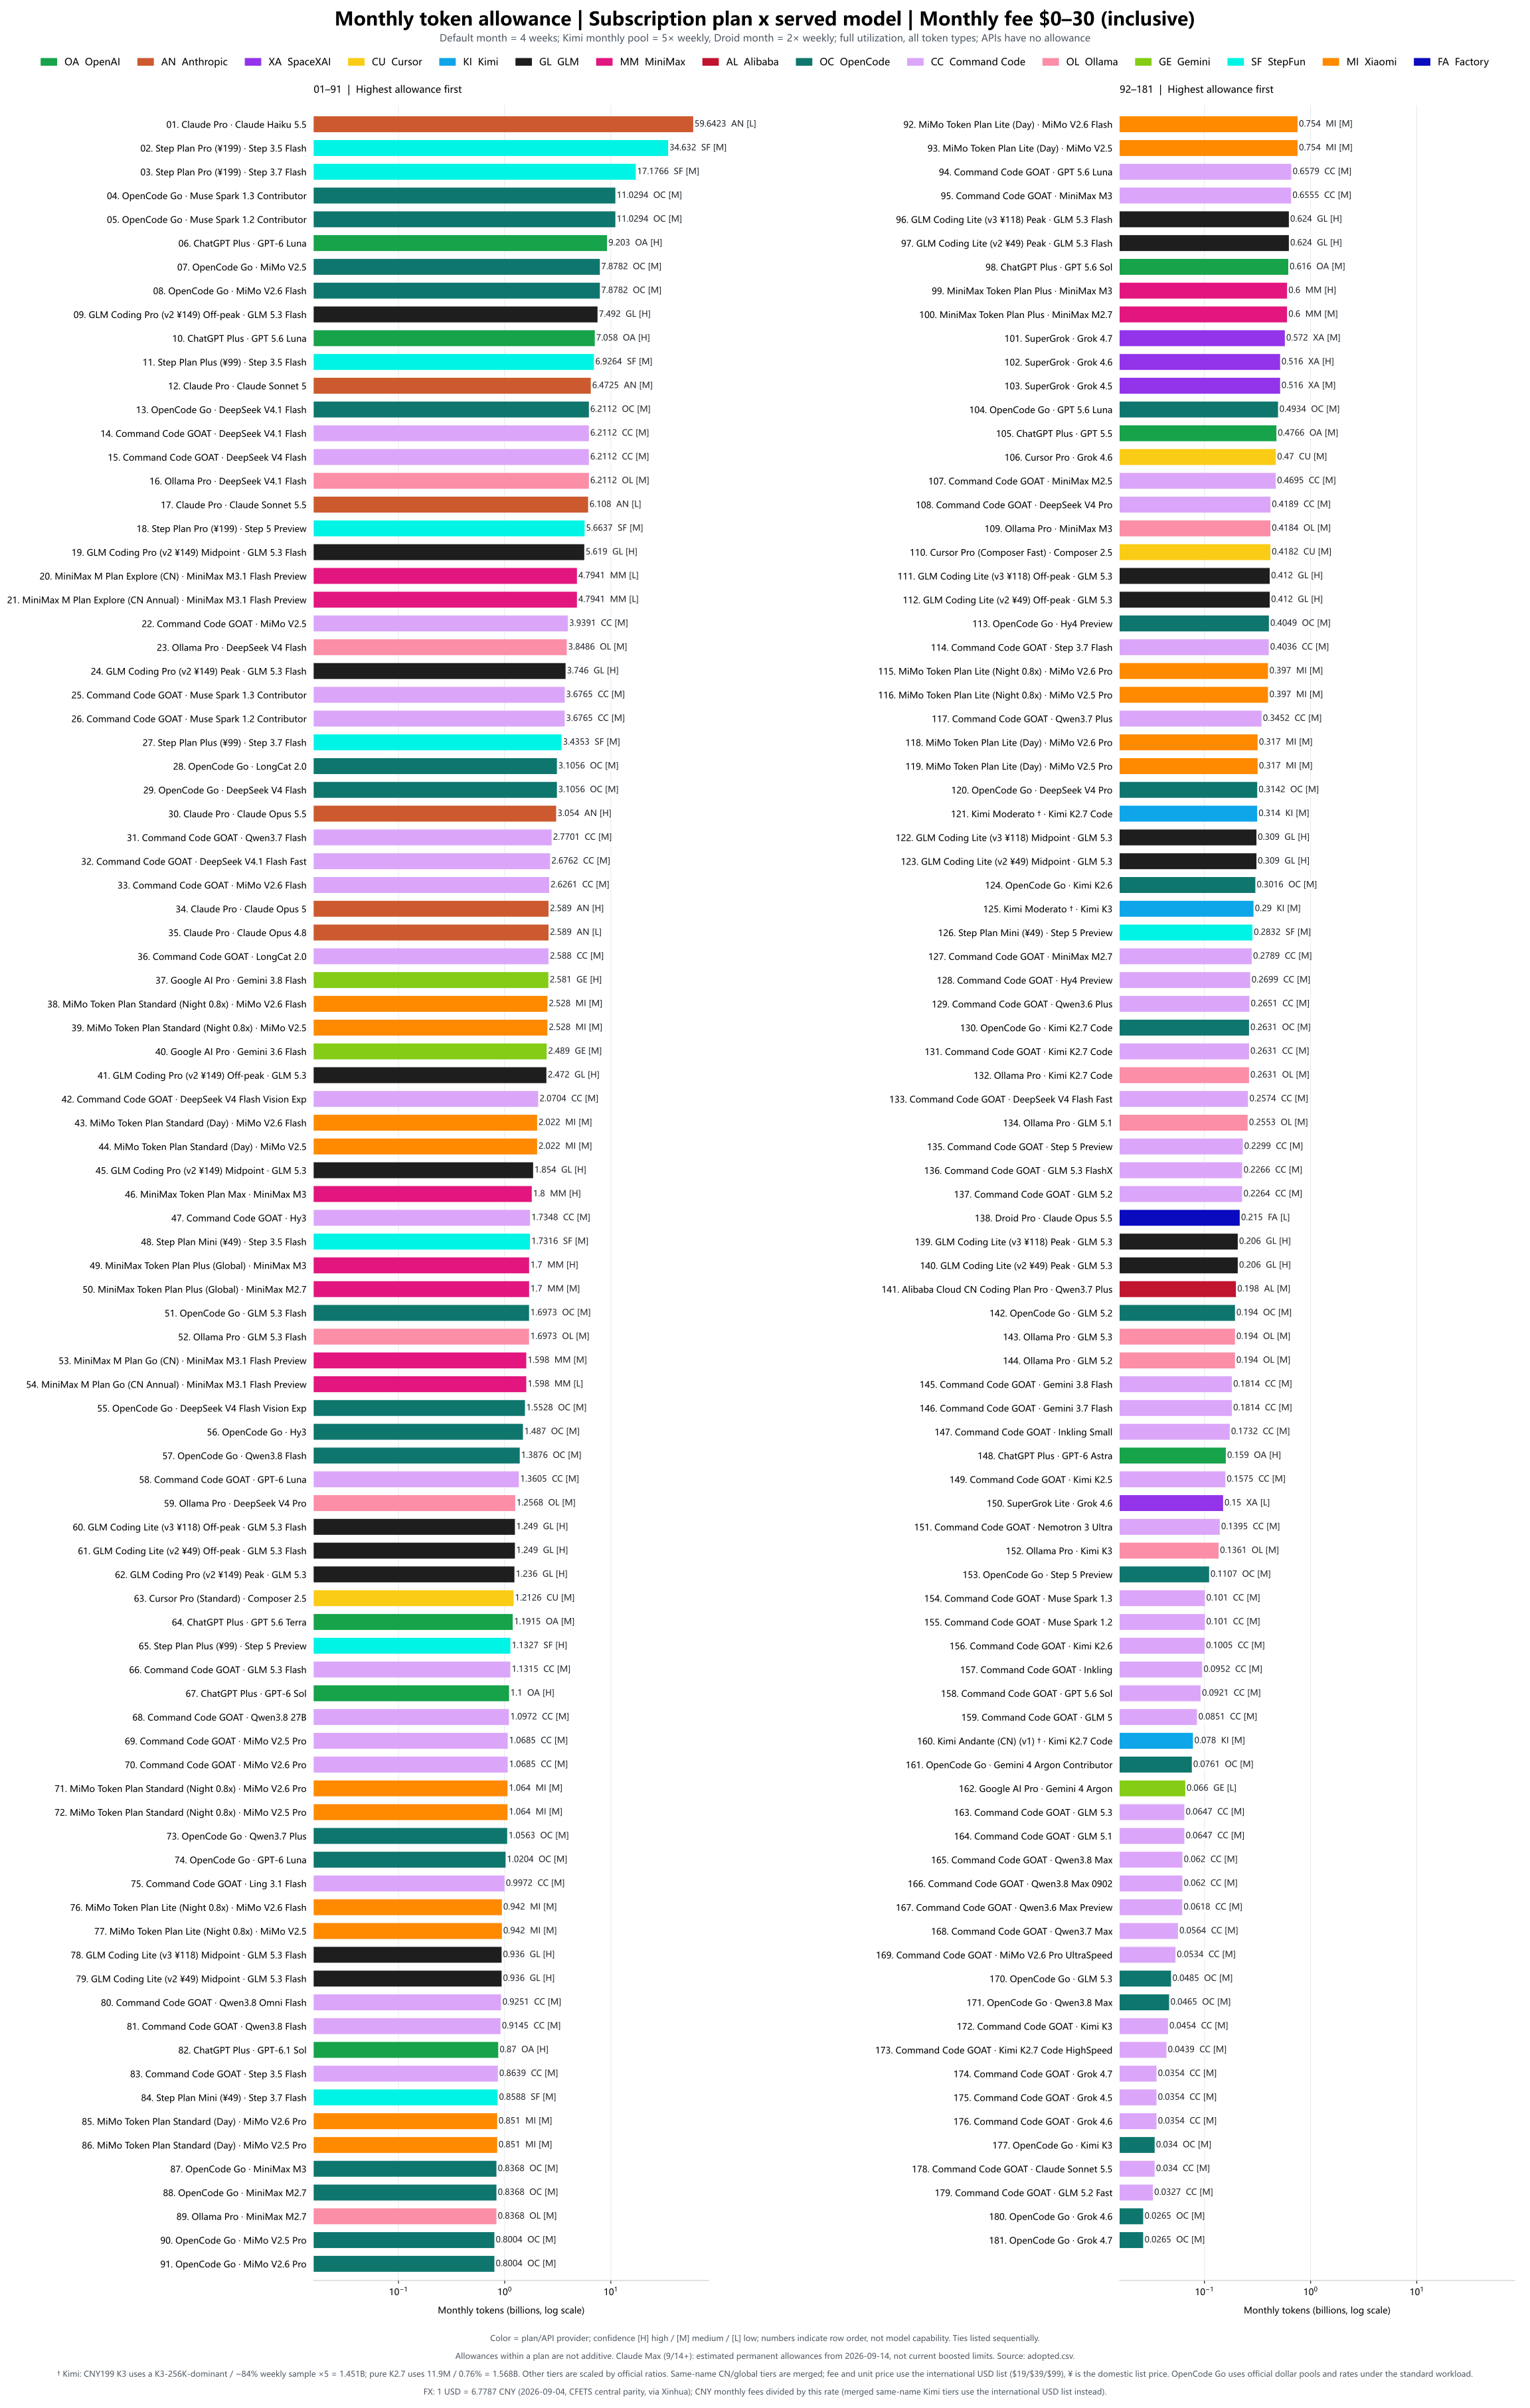
Table: English TXT · 中文 TXT
>$30–$100
English SVG · 中文 SVG · English PNG · 中文 PNG
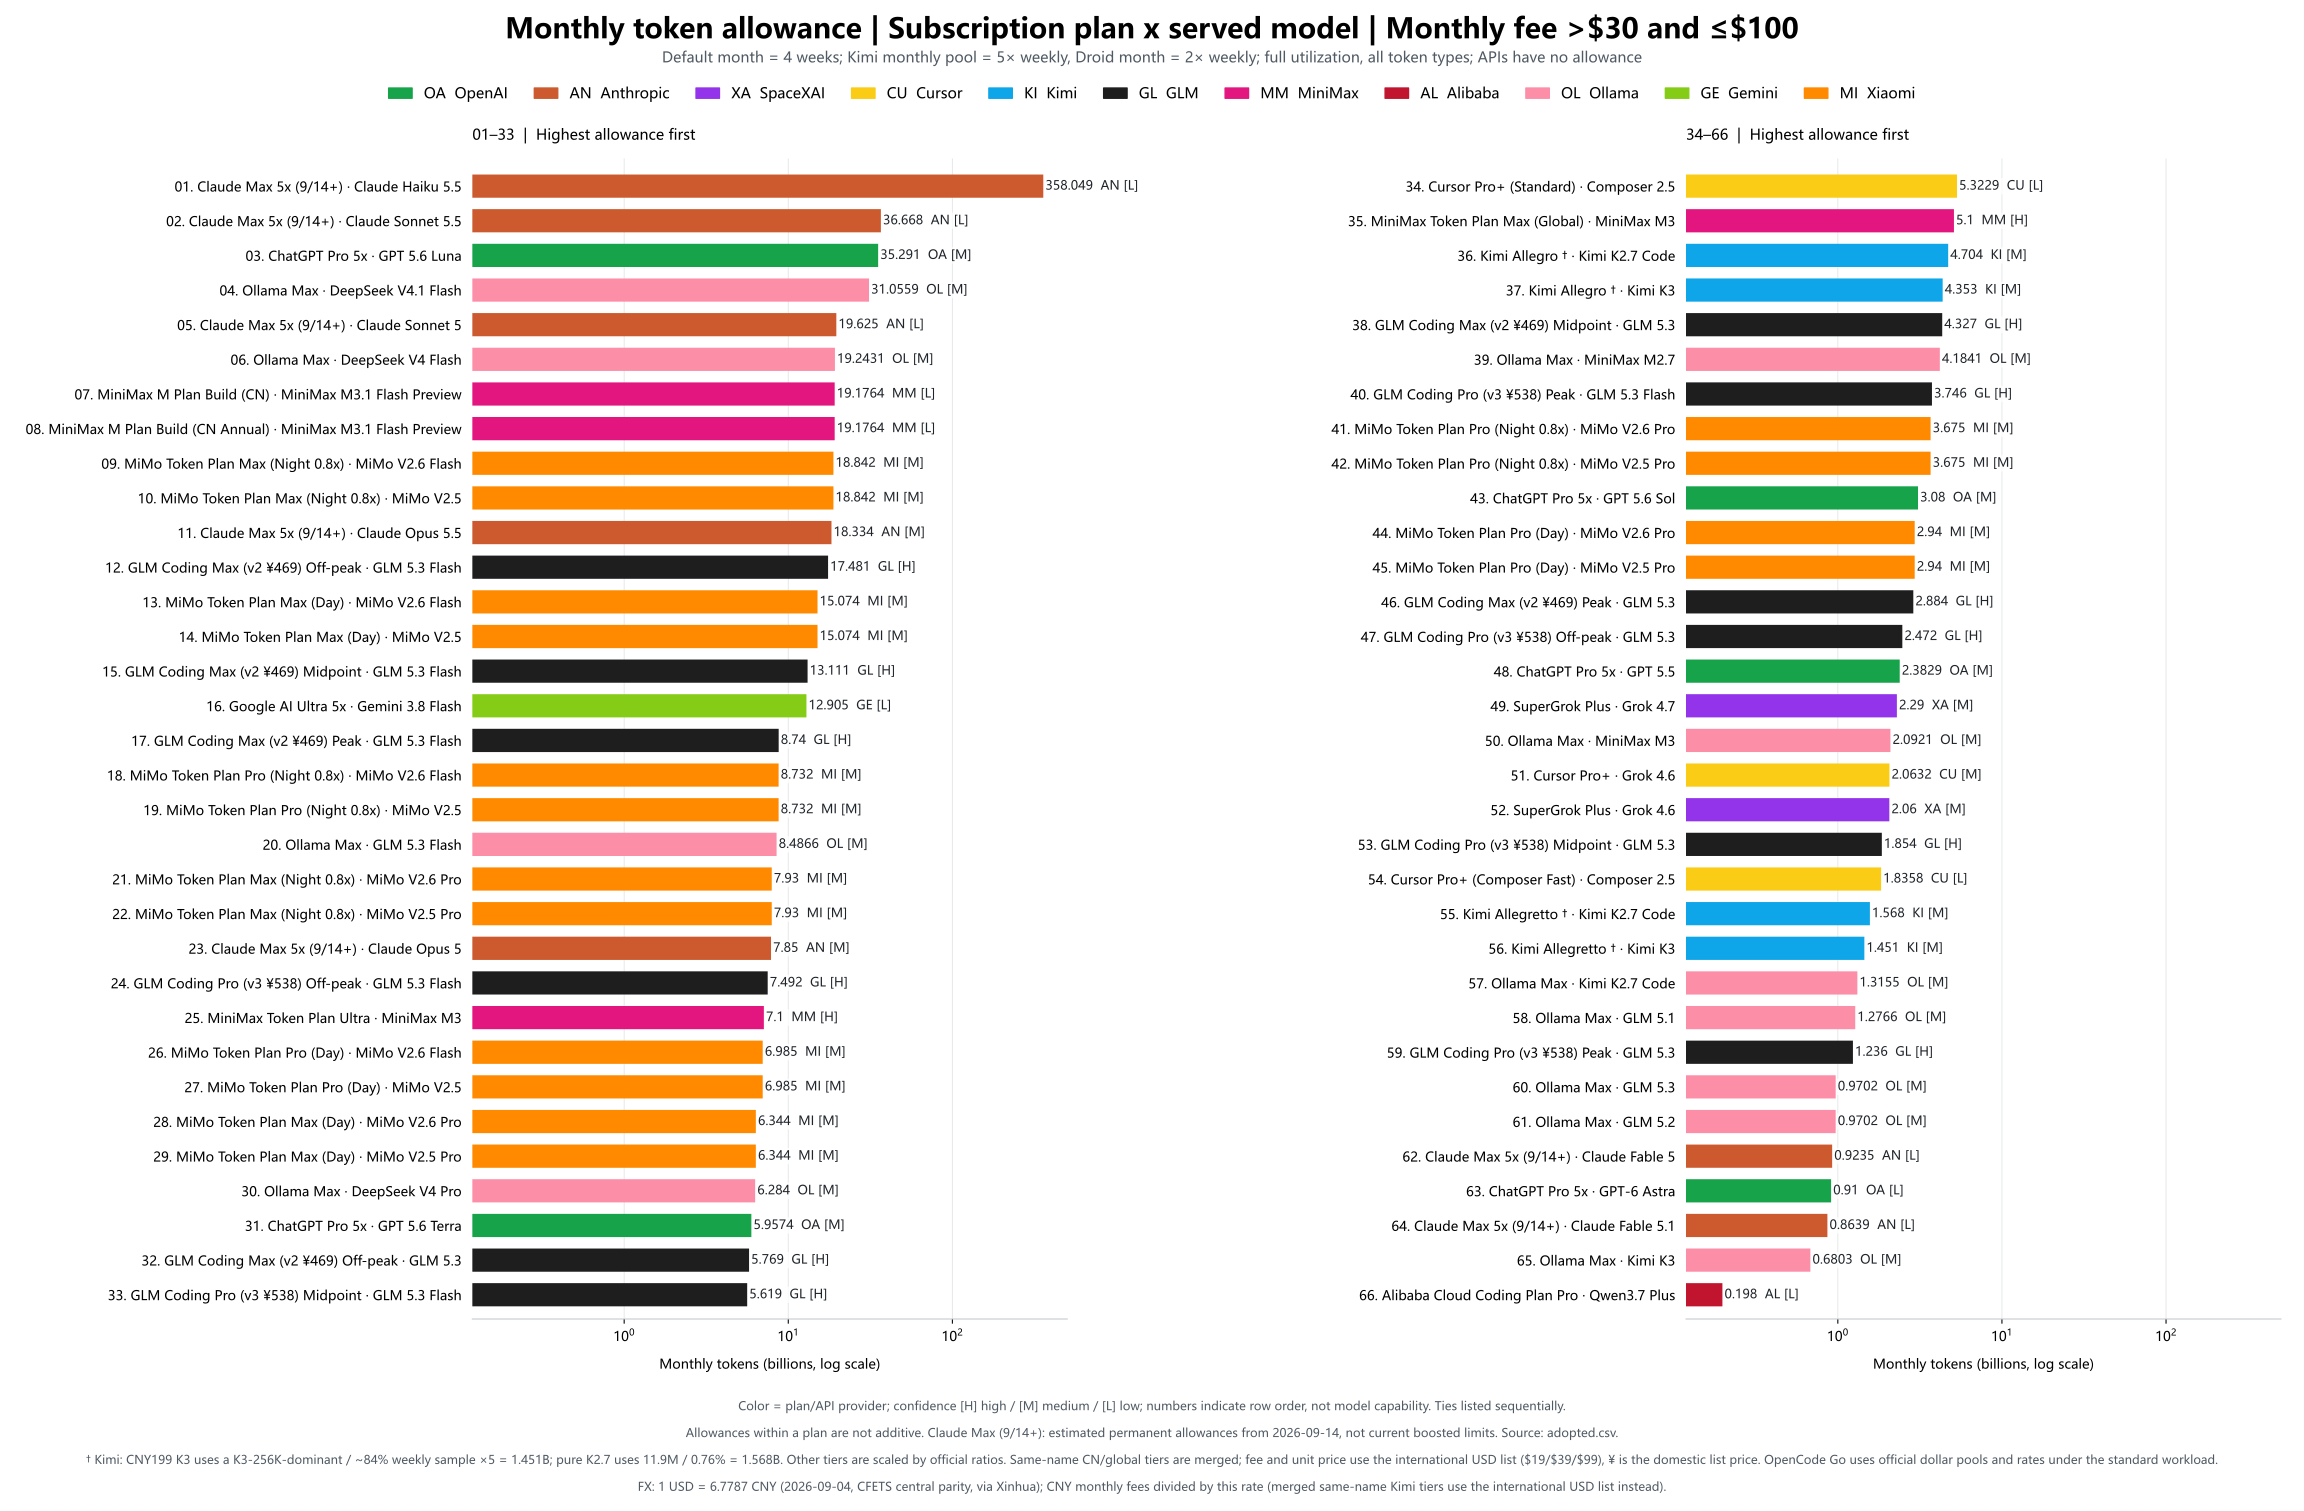
Table: English TXT · 中文 TXT
>$100 and ≤$300
English SVG · 中文 SVG · English PNG · 中文 PNG
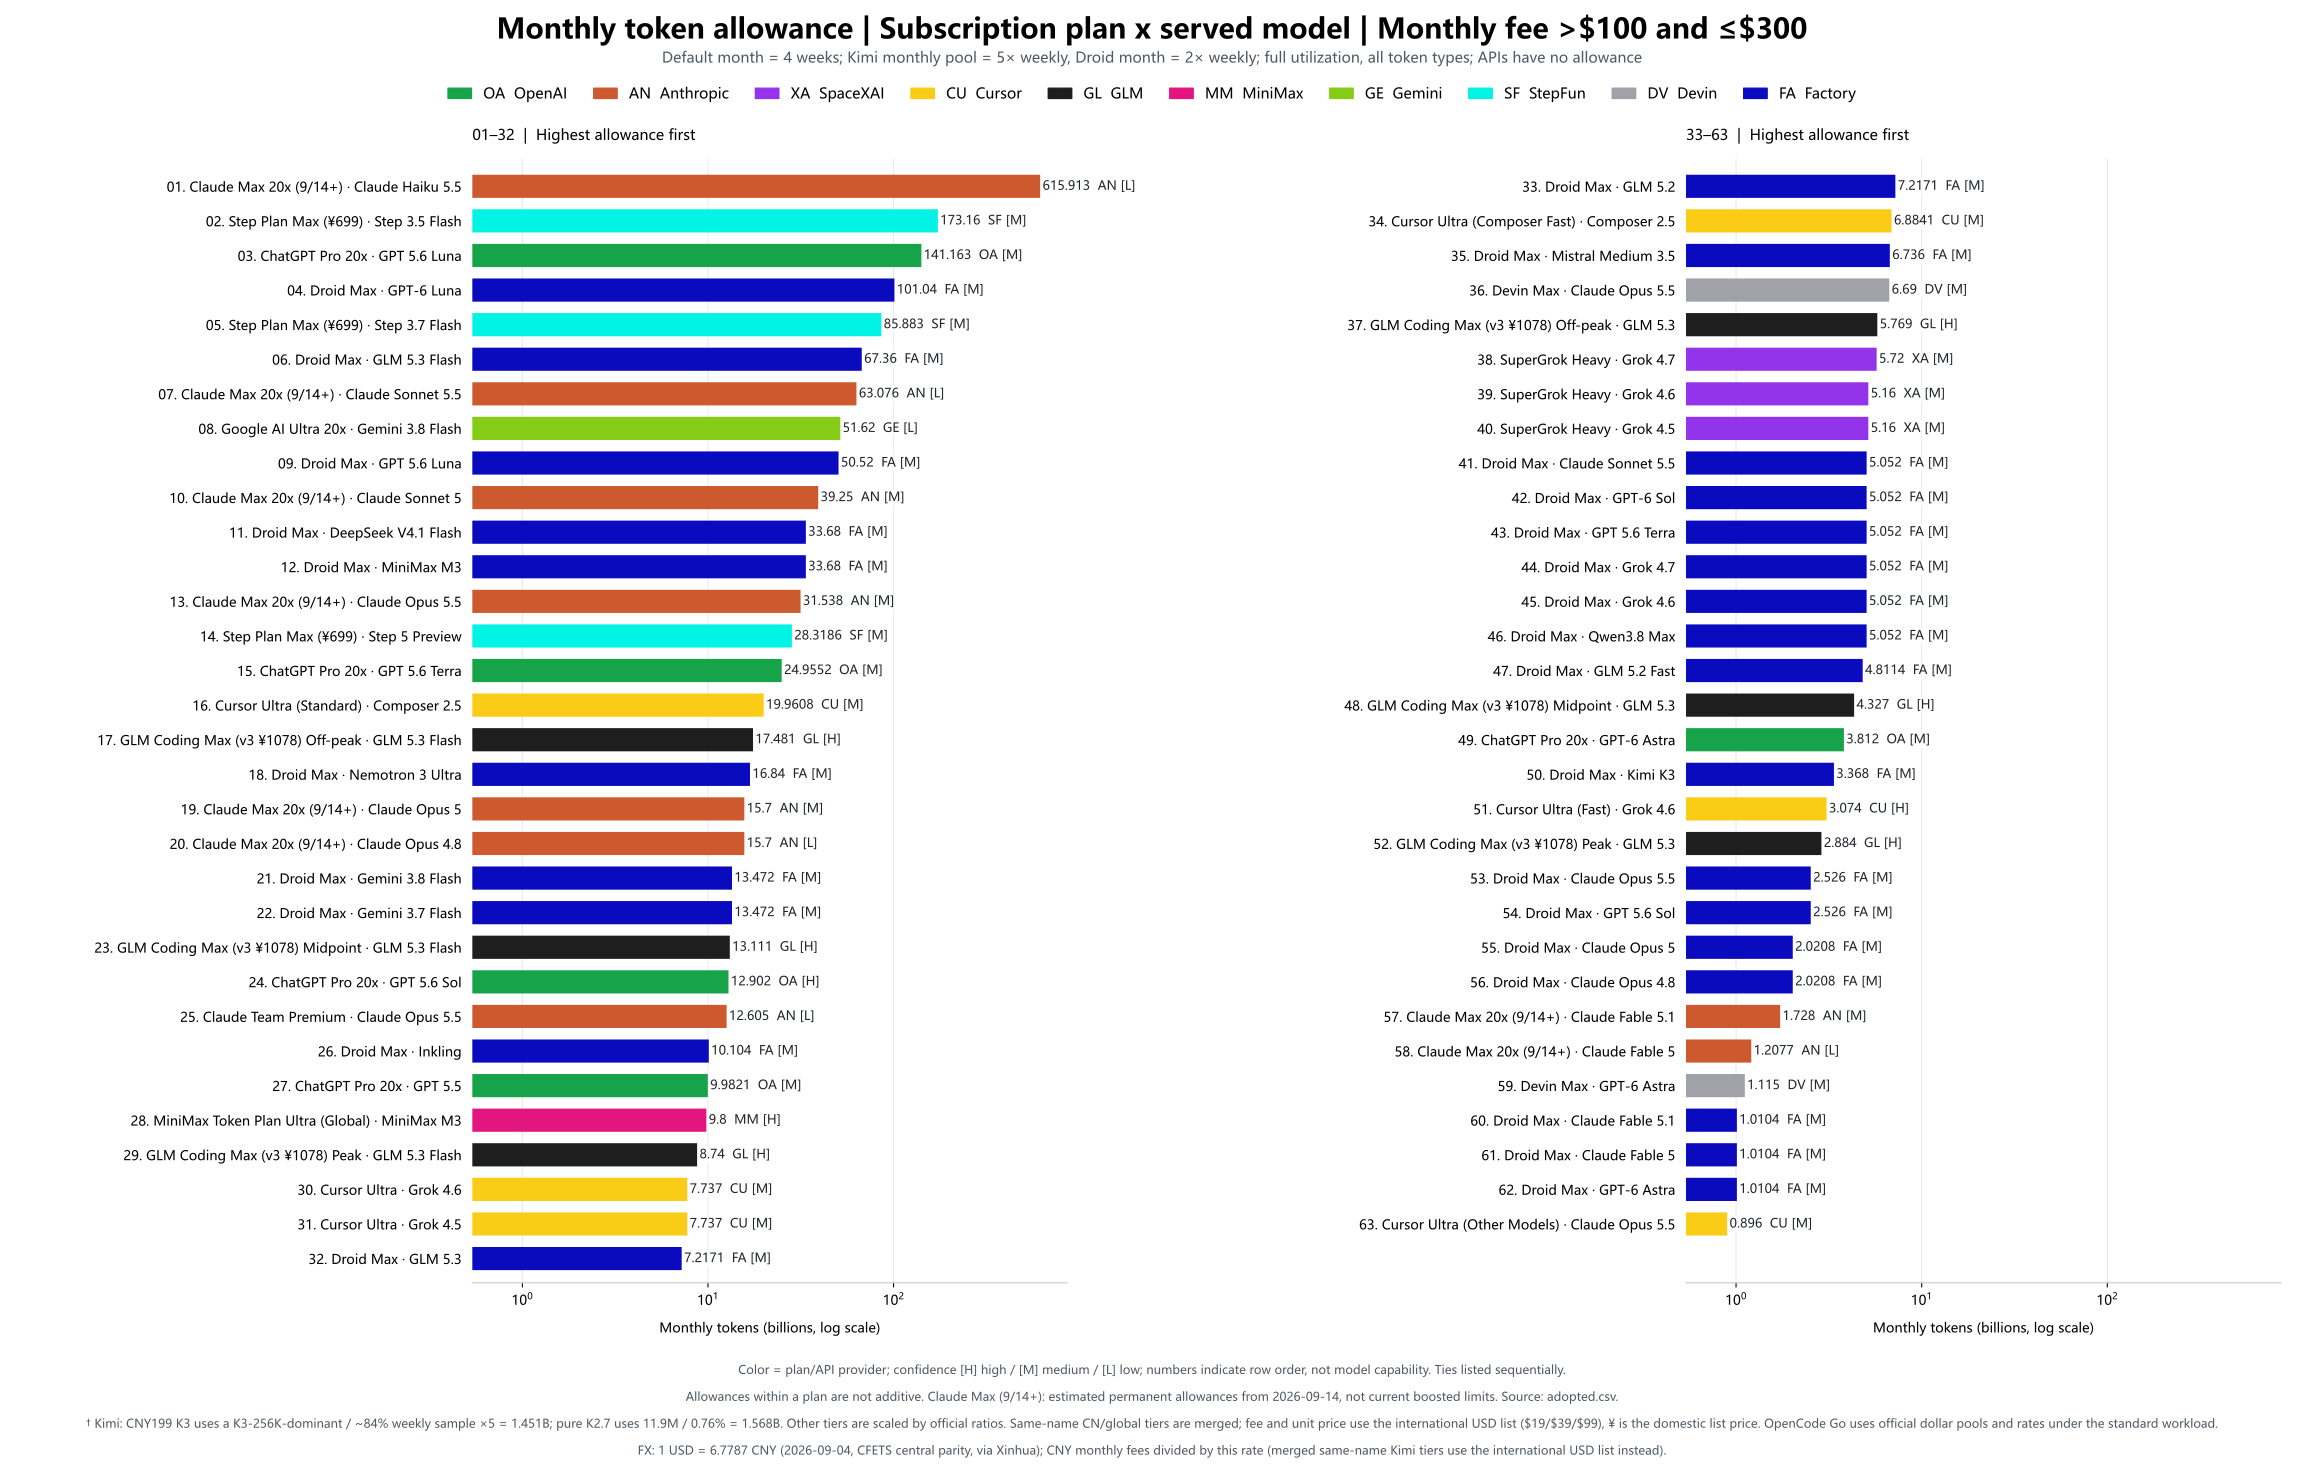
Table: English TXT · 中文 TXT
Real unit price overview
All 188 subscription and API points on one comparable $/MTok scale.
English SVG · 中文 SVG · English PNG · 中文 PNG
Full table: English TXT · 中文 TXT
Pareto charts by leaderboard
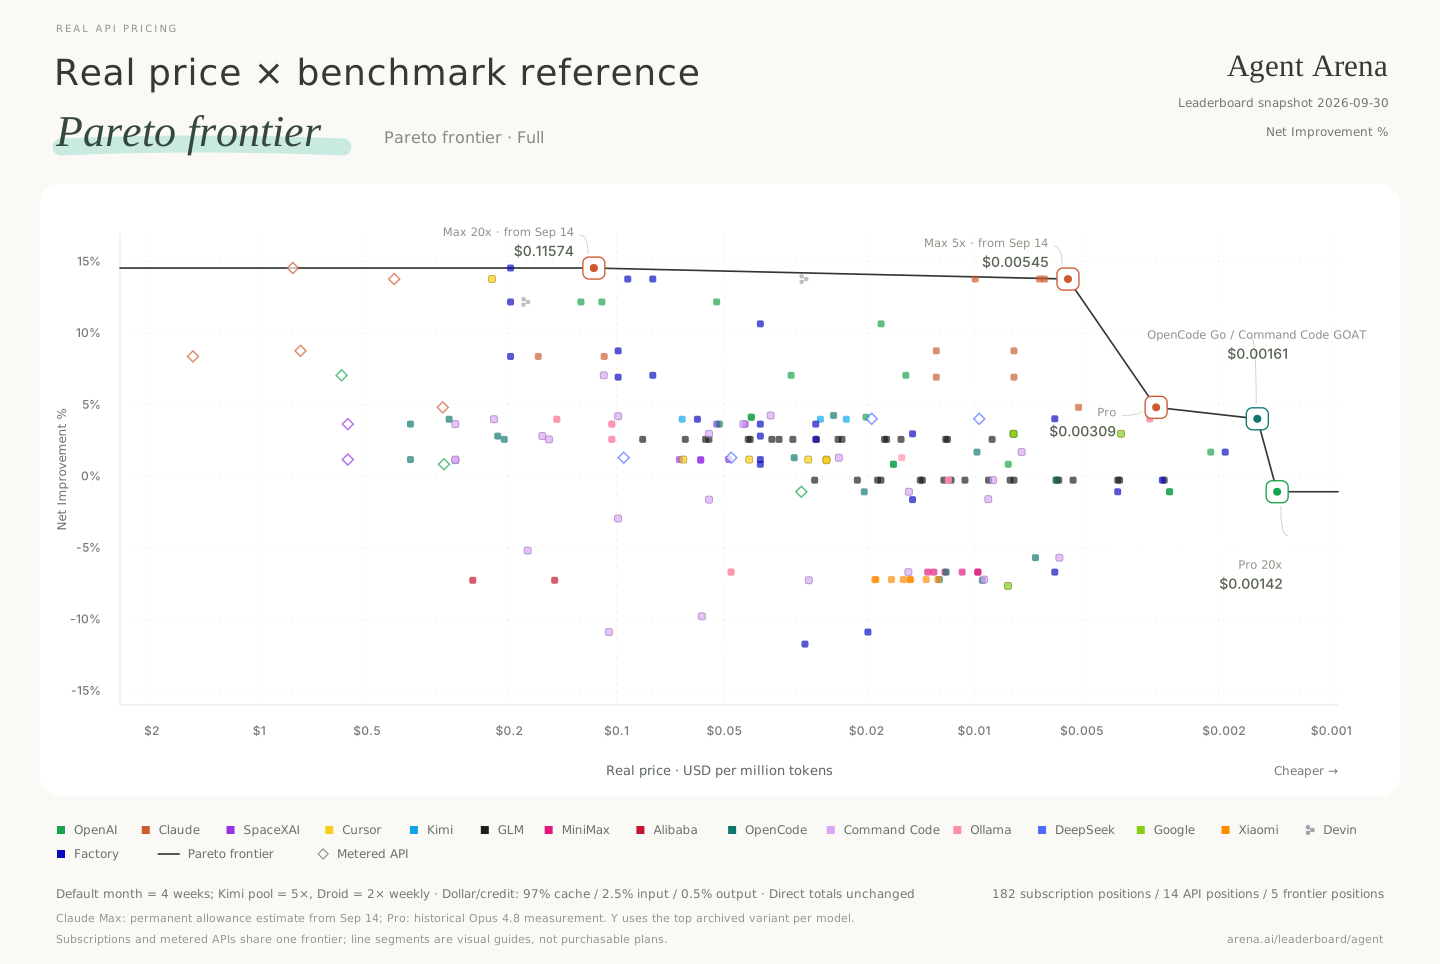
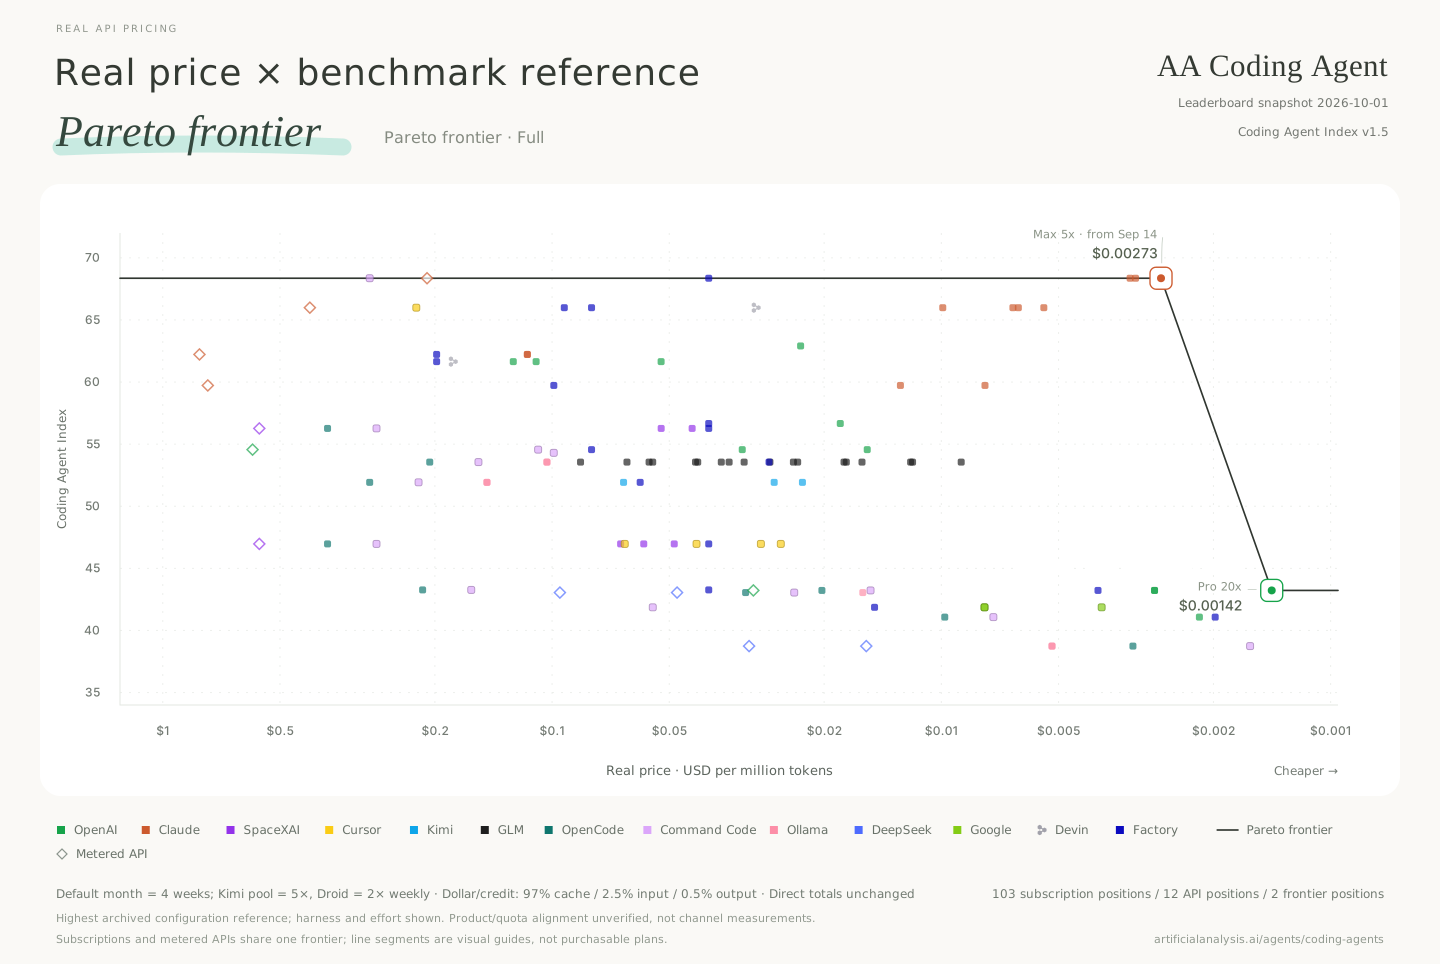
Using Real API Pricing as a new baseline, we plot each leaderboard's scores on the Y-axis to redraw its Pareto frontier; the connected line represents that frontier. Subscriptions and metered APIs follow the same dominance rule and both participate in frontier selection.
Code Arena
English SVG · 中文 SVG · English PNG · 中文 PNG
Agent Arena
English SVG · 中文 SVG · English PNG · 中文 PNG
AA Intelligence
English SVG · 中文 SVG · English PNG · 中文 PNG
AA Coding Agent
English SVG · 中文 SVG · English PNG · 中文 PNG
OpenDesign Arena
English SVG · 中文 SVG · English PNG · 中文 PNG
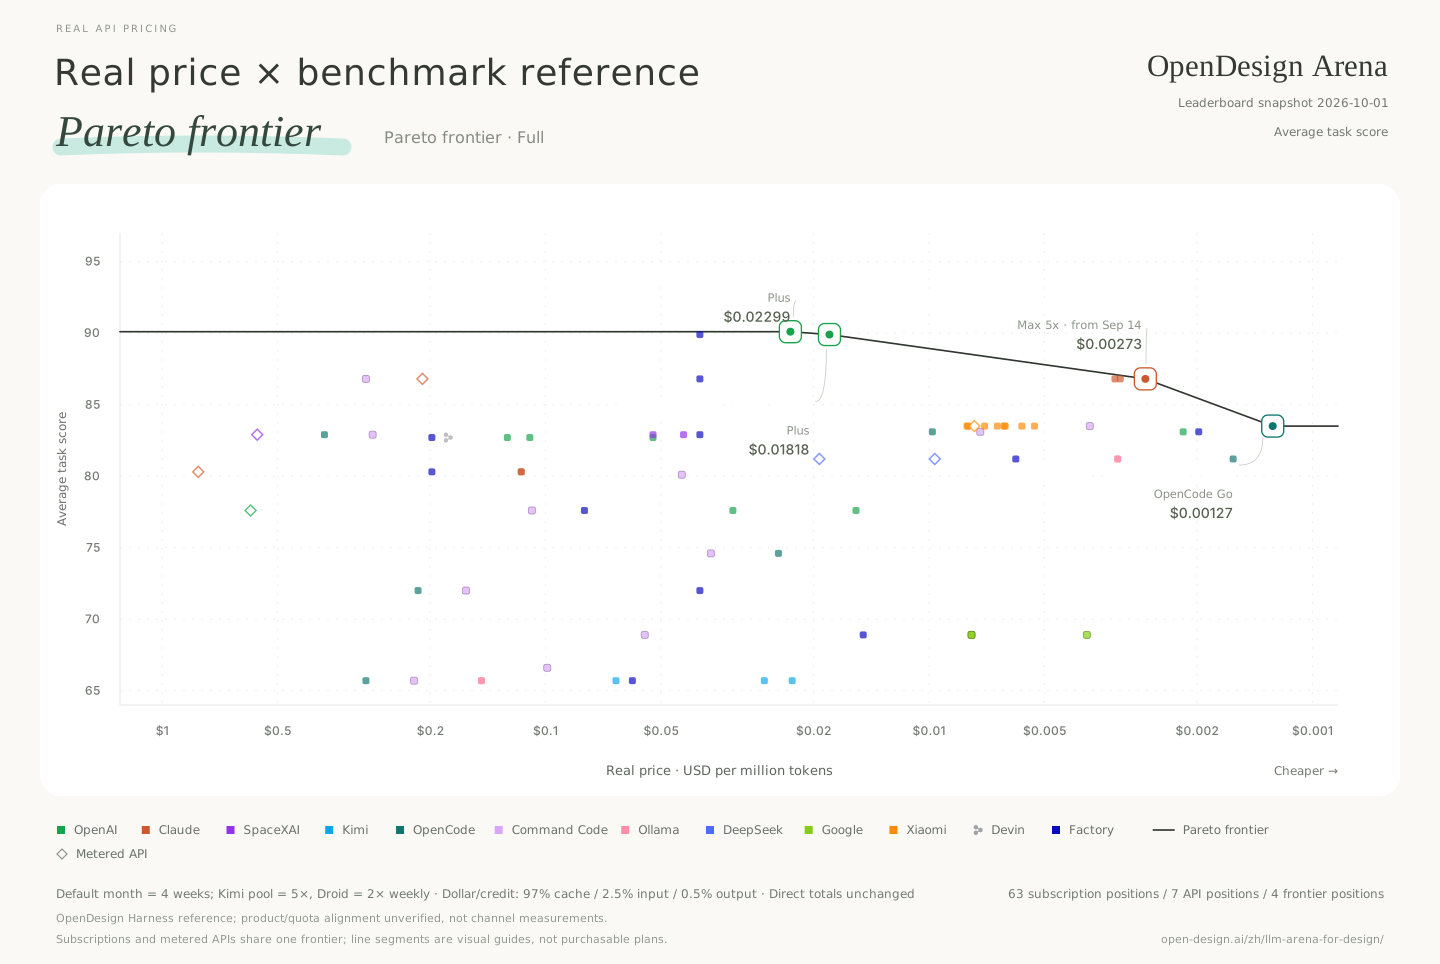
OpenDesign's full 13-model quality ranking is archived. Eleven exact model identities map to current adopted points; GPT-6 Astra and Claude Fable 5.1 remain archive-only because this project has no exact adopted row for them. DeepSeek V4.1 Flash uses the official USD list price effective September 10: $0.003 cached input / $0.15 uncached input / $0.60 output off-peak, with a separate 2× peak point. The scores are OpenDesign Harness references, not measurements of each subscription/API channel.
AA Coding Agent scores describe tested harness × model × effort configurations. Static charts and points.* are explicitly highest archived configuration reference summaries. They are not measurements of each subscription/API channel; quota-measurement effort and product harness alignment remain unverified. Higher effort does not automatically change $/MTok; it can change tokens consumed per task.
All-configuration interactive view (Chinese) defaults to every archived configuration and offers the highest-score summary as an option. Download the HTML and open it locally with network access for Plotly. All configurations currently use reference mappings, not a verified product-configuration frontier.
The configuration archive (JSON) / CSV retains all 217 records, original labels, known harness/effort, source score intervals, and source task-cost records. The plan-to-configuration mappings (JSON) / CSV contains 933 explicit references, including lower-effort variants. Composer Standard/Fast require their own mode; a missing mode stays unscored. Unknown harnesses, efforts and intervals stay null.
Source mean and median task costs are separate fields, not subscription task costs. Score intervals are preserved and available in interactive hover details, but uncertainty does not yet change frontier membership. Numerical quota ranges, robust-frontier analysis and workload sensitivity remain follow-up work; qualitative confidence labels are not numerical error bars.
Method and reproduction
Build instructions · Data documentation · Sources and attribution
License and acknowledgements
Original software: MIT. Data references include Awesome Coding Plan (CC BY 4.0) and the Caijing article 《Token经济,中国账本》. See SOURCES.md for attribution, changes and third-party terms.

 这是一个数据与图表项目:用月费除以实际可用的 token 数,算出 AI 订阅方案的真实价格,再把这些真实单价与编程/智能体排行榜得分对照,绘制成帕累托前沿图。