 Flint: A Visualization Language for the AI Era





Please visit: Flint Project Site | Visual Themes | MCP Server Guide | 中文主页
Flint is a visualization intermediate language that lets AI agents turn
simple, human-editable chart specs into expressive, polished visualizations.
Rather than requiring agents to hardcode verbose parameters for scales, axes,
spacing, labels, and layout, Flint derives those decisions from a high-level
semantic specification, the data, and an optional visual theme (e.g., New York
Times, Economist, Swiss, and McKinsey). A compact spec compiles to native
Vega-Lite,
ECharts,
Chart.js,
Plotly specs, or editable Excel charts.
This repo contains two main components:
flint-chart: a JavaScript/TypeScript library that compiles the same
Flint input into Vega-Lite, ECharts, Chart.js, Plotly, or Excel-native output.flint-chart-mcp: an MCP server that lets agents create, validate, and
render charts directly from a chat or coding environment.
Try it in your agent
Try Flint with your agent using our hosted MCP server. Clients that support
remote HTTP MCP servers include GitHub Copilot in VS Code
(MCP: Add Server → HTTP) and Claude
(Customize → Connectors → Add custom connector). Point either client at:
https://flint.data-formulator.ai/mcp
Then ask your agent to find some public data and visualize it, for example:
Go to Yahoo Finance, find today's percentage change for the Magnificent Seven
tech stocks, and compare their performance with Flint in Economist style.
For a local MCP server (recommended for large datasets), check the
MCP Server Guide for details.
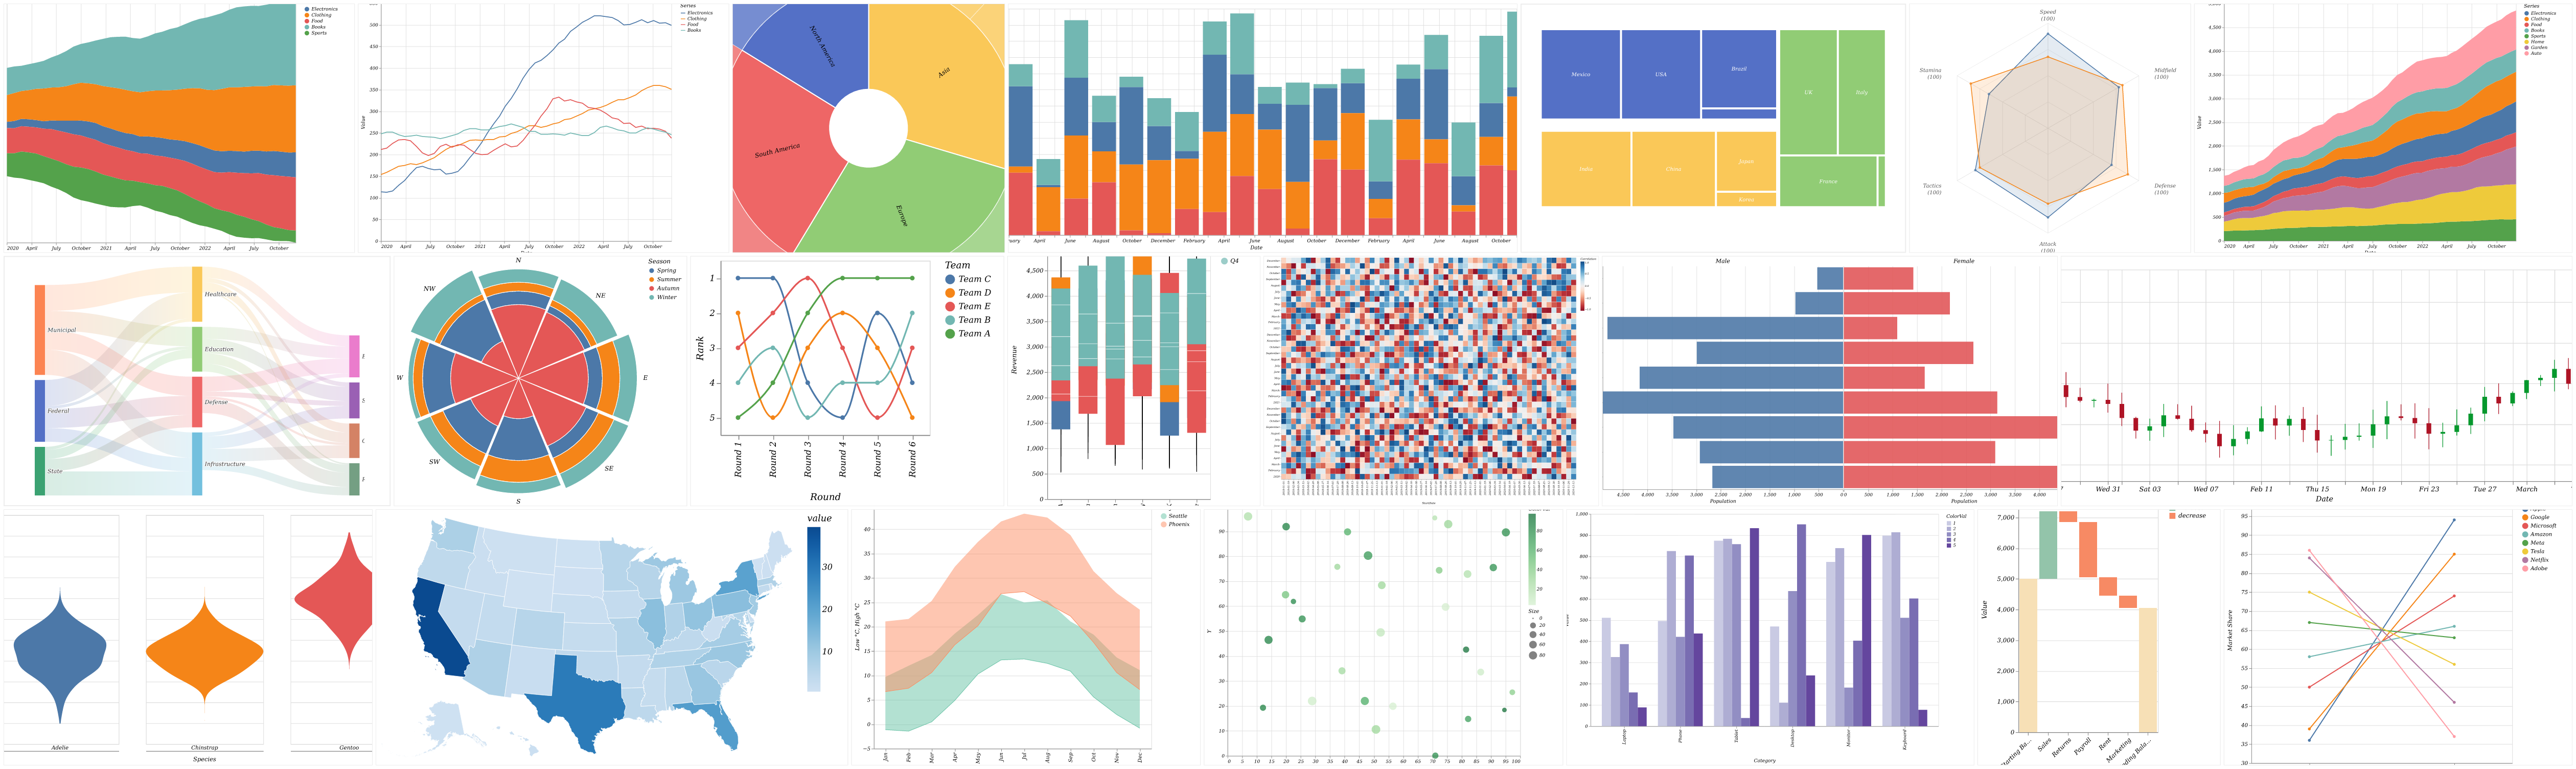
Features
- Semantic chart specs. Flint captures what each field means using 70+
semantic types such as
Rank, Temperature, Price, or Country.
- Automatic layout. Flint adapts sizing, spacing, labels, marks, and legends
to the data cardinality, chart design, and canvas constraints.
- Formal visual themes. Define layout behavior, semantic presentation, and
visual identity once, then apply them across a chart library with a preset,
custom
ThemeSpec, or inherited theme.
- Multiple backends. Compile one input to backend-native output across
Vega-Lite,
ECharts,
Chart.js,
Plotly, and native Excel charts.
- Agent-ready chart authoring. The MCP server gives agents Flint tools and
chart guidance so they can choose a template, validate it, and open an
interactive chart view in MCP-capable clients.
Updates
- August 12, 2026 — Flint 0.5.1 extends visual themes to the Plotly backend
and adds Vega-Lite Calendar Heatmap. (changelog)
- August 5, 2026 — Flint 0.5.0 introduces a formal theme specification
that allows designers and users to define a visual system once and apply it
consistently across an entire chart library. (v0.5.0)
- July 24, 2026 — Flint 0.4.0 adds 38 Plotly chart types and 18 native,
editable Excel chart templates. (v0.4.0)
- July 19, 2026 — Flint 0.3.0 adds dynamic chart widgets that switch chart
types and edit chart properties in place. (v0.3.0)
- July 15, 2026 — Flint 0.2.2 added compact dodge modes and grouped violin
layouts.
- July 13, 2026 — Flint 0.2.1 improved chart-property validation and backend
consistency. (v0.2.1)
See the changelog for complete release notes.
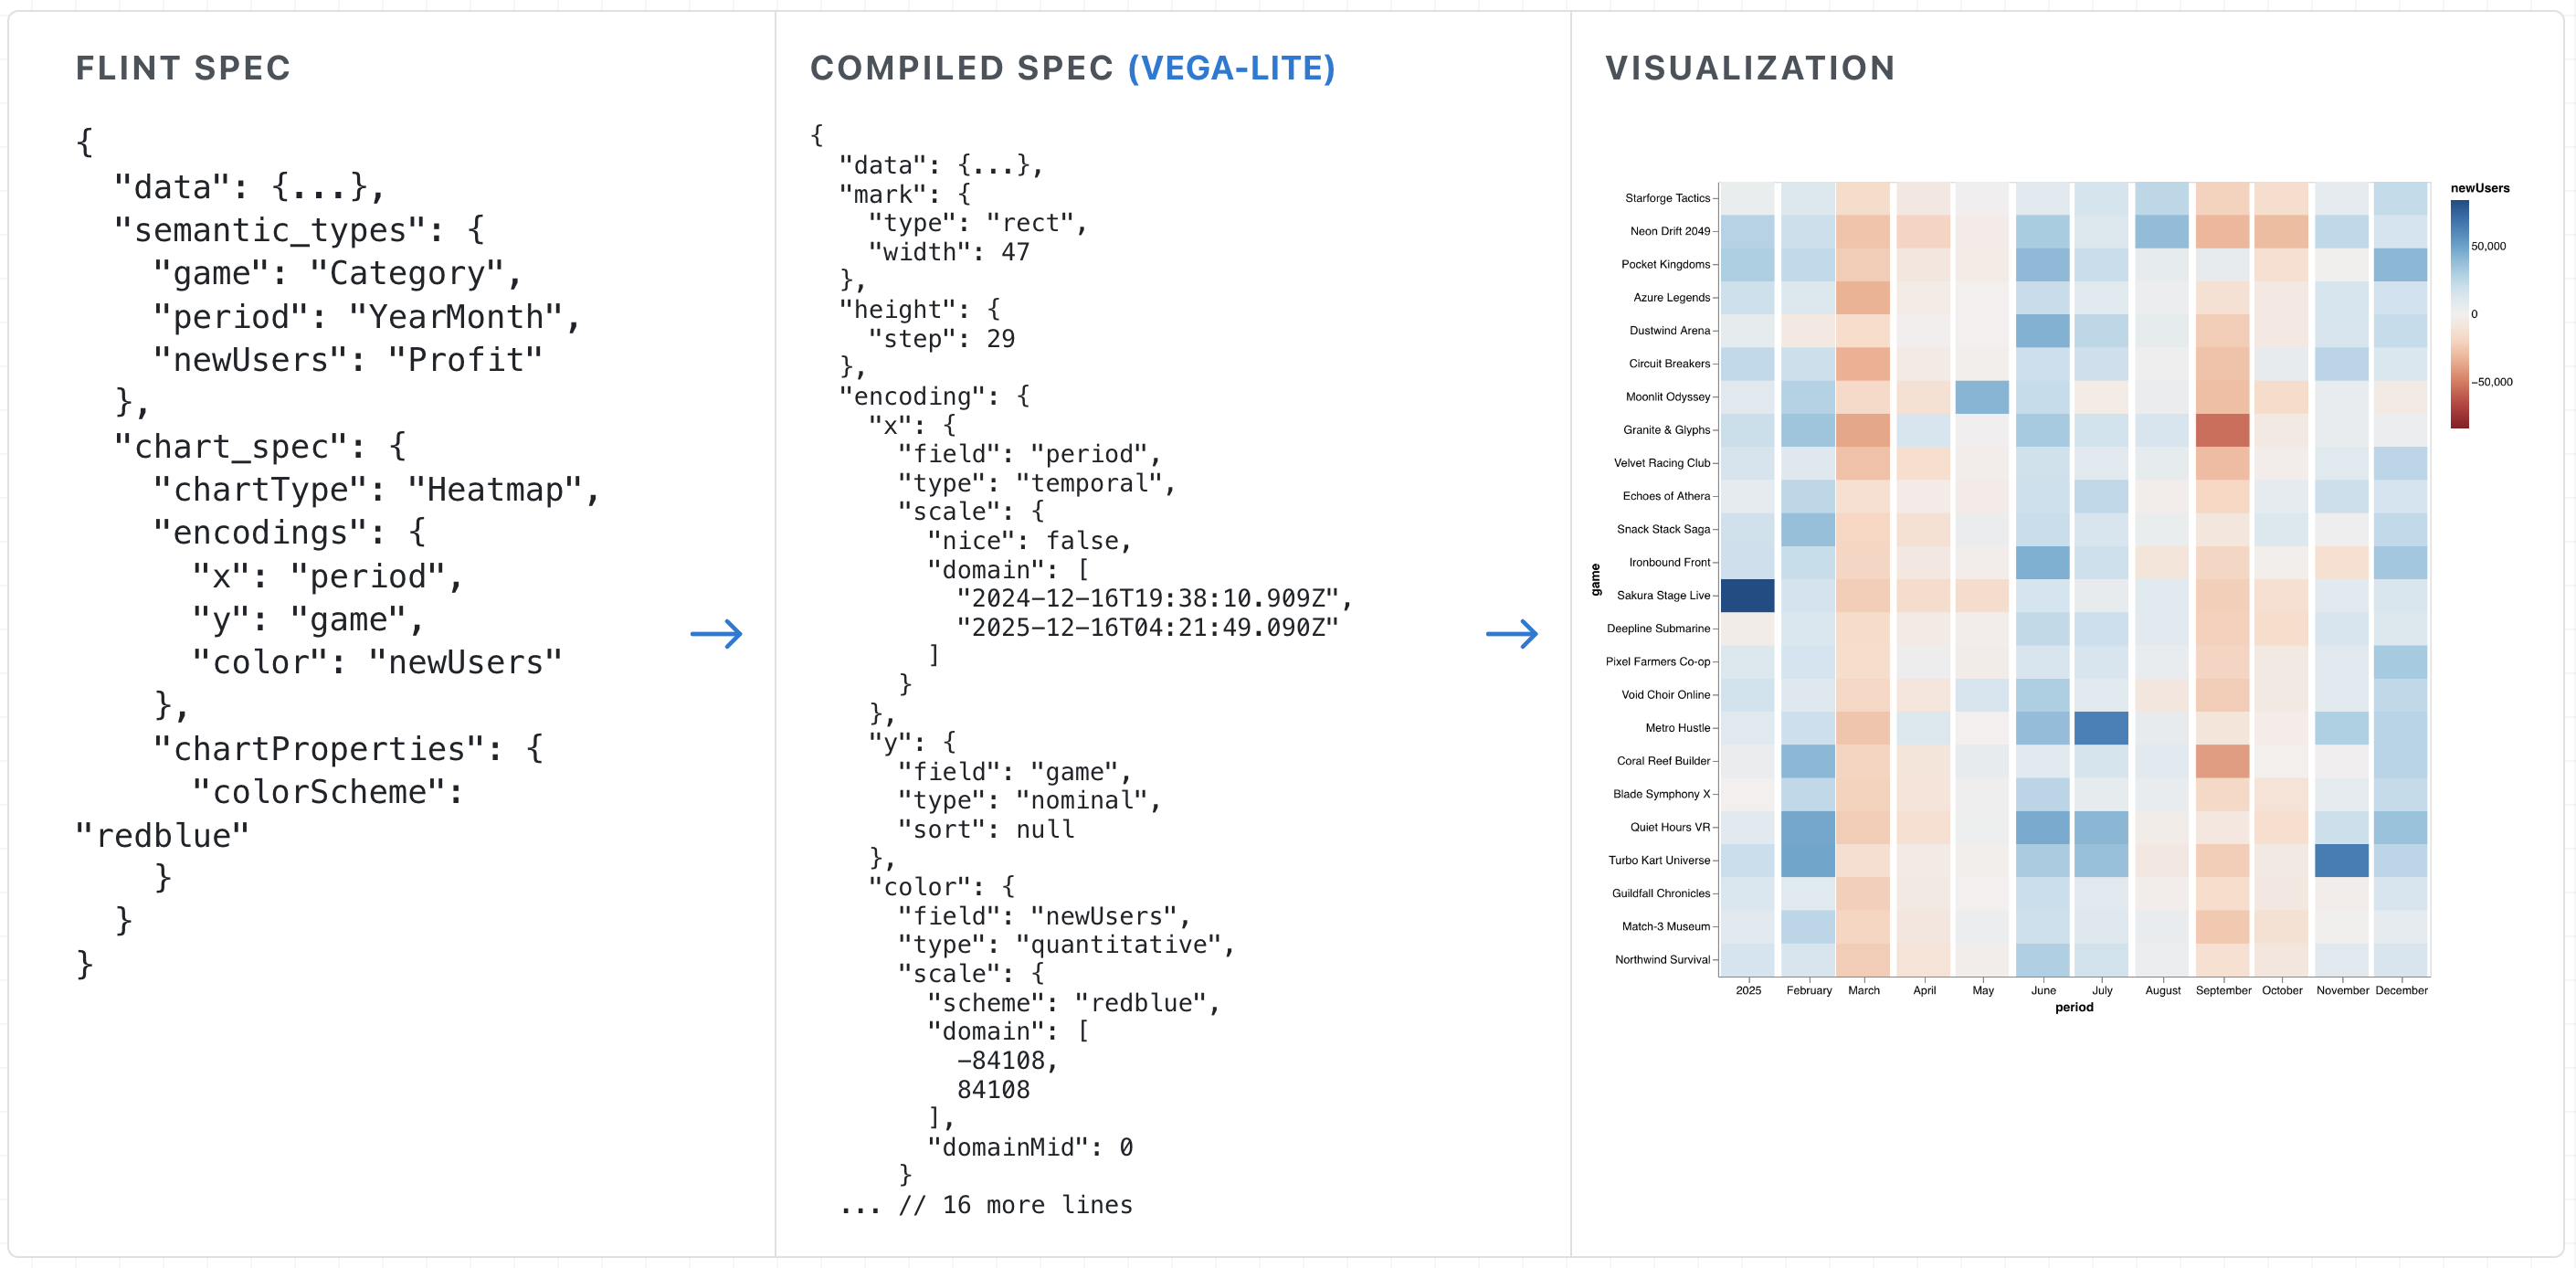
Flint turns compact chart specs into backend-native specs and rendered visualizations.
Install
# Use Flint in your JavaScript/TypeScript codebase
npm install flint-chart

# For agents and MCP clients
npx -y flint-chart-mcp
Python package: to be released. The current Python port is a source-only preview in this repo.
Use Flint As A Library
Every backend accepts the same ChartAssemblyInput and returns the target
library's native spec object.
import { assembleVegaLite } from 'flint-chart';

const spec = assembleVegaLite({
  data: { values: myData },
  semantic_types: { weight: 'Quantity', mpg: 'Quantity', origin: 'Country' },
  chart_spec: {
    chartType: 'Scatter Plot',
    encodings: { x: { field: 'weight' }, y: { field: 'mpg' }, color: { field: 'origin' } },
    baseSize: { width: 400, height: 300 },
  },
});
// → a ready-to-render Vega-Lite spec
Swap the backend without changing the input shape:
import { assembleECharts, assembleChartjs, assemblePlotly, assembleExcel } from 'flint-chart';

const echartsOption = assembleECharts(input);
const chartjsConfig = assembleChartjs(input);
const plotlyFigure = assemblePlotly(input);
const excelArtifact = assembleExcel(input);
Apply Visual Themes
theme_spec sits beside chart_spec: the chart spec defines what the chart
means, while the theme defines how that meaning is presented. A theme can guide
layout, labels, legends, axes, mark geometry, typography, and color as one
coherent visual system.
Use one of Flint's ten built-in presets:
const themedSpec = assembleVegaLite({
  ...input,
  theme_spec: 'economist',
});
Or inherit a preset and override only the decisions that belong to your brand:
const brandedSpec = assembleVegaLite({
  ...input,
  theme_spec: {
    extends: 'economist',
    id: 'our-brand',
    ink: {
      series: { single: '#6b3fa0' },
    },
  },
});
Nested objects merge; arrays and scalar values replace the inherited value.
ThemeSpec currently affects Vega-Lite output. Compare all presets on the
theme explorer. See
Using themes for the complete custom and inherited-theme
reference.
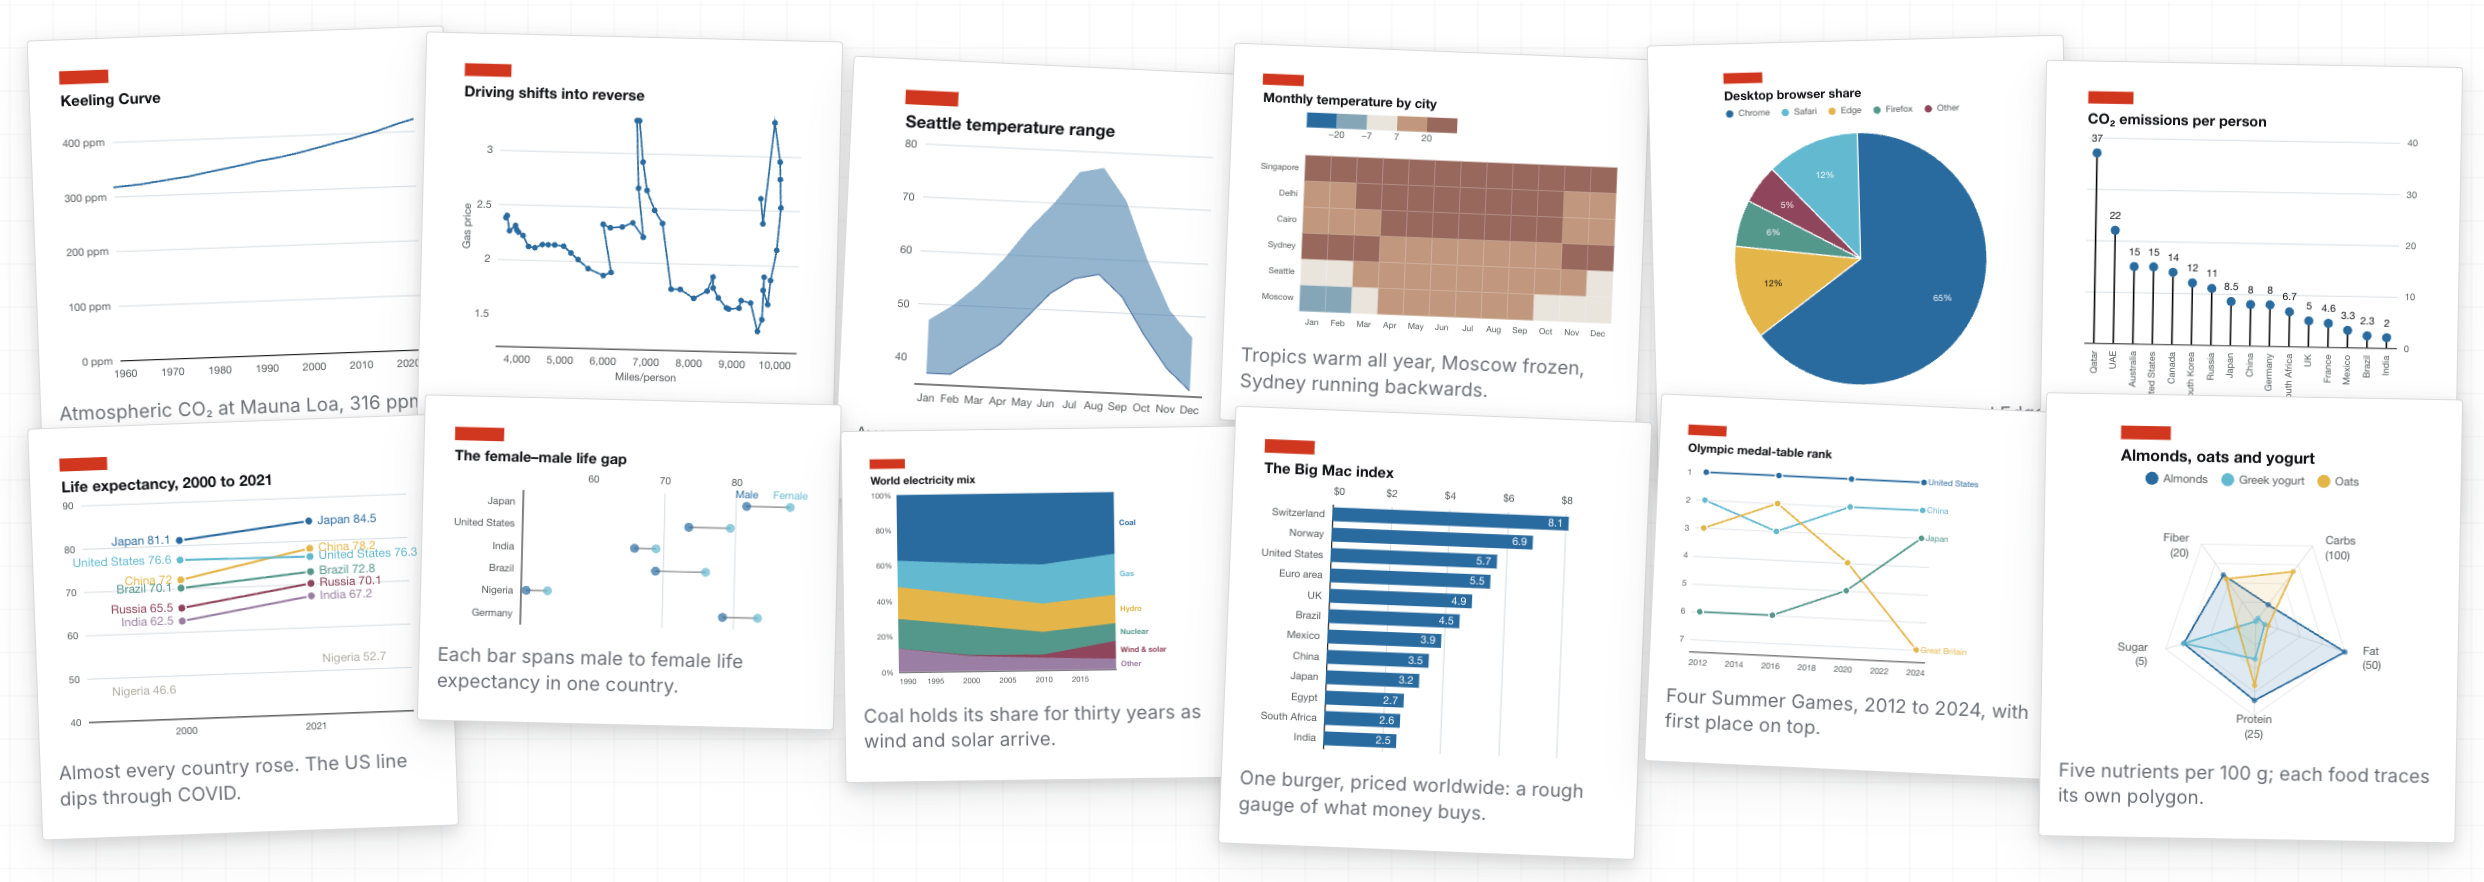
Economist — compact editorial graphics with a strong red accent.
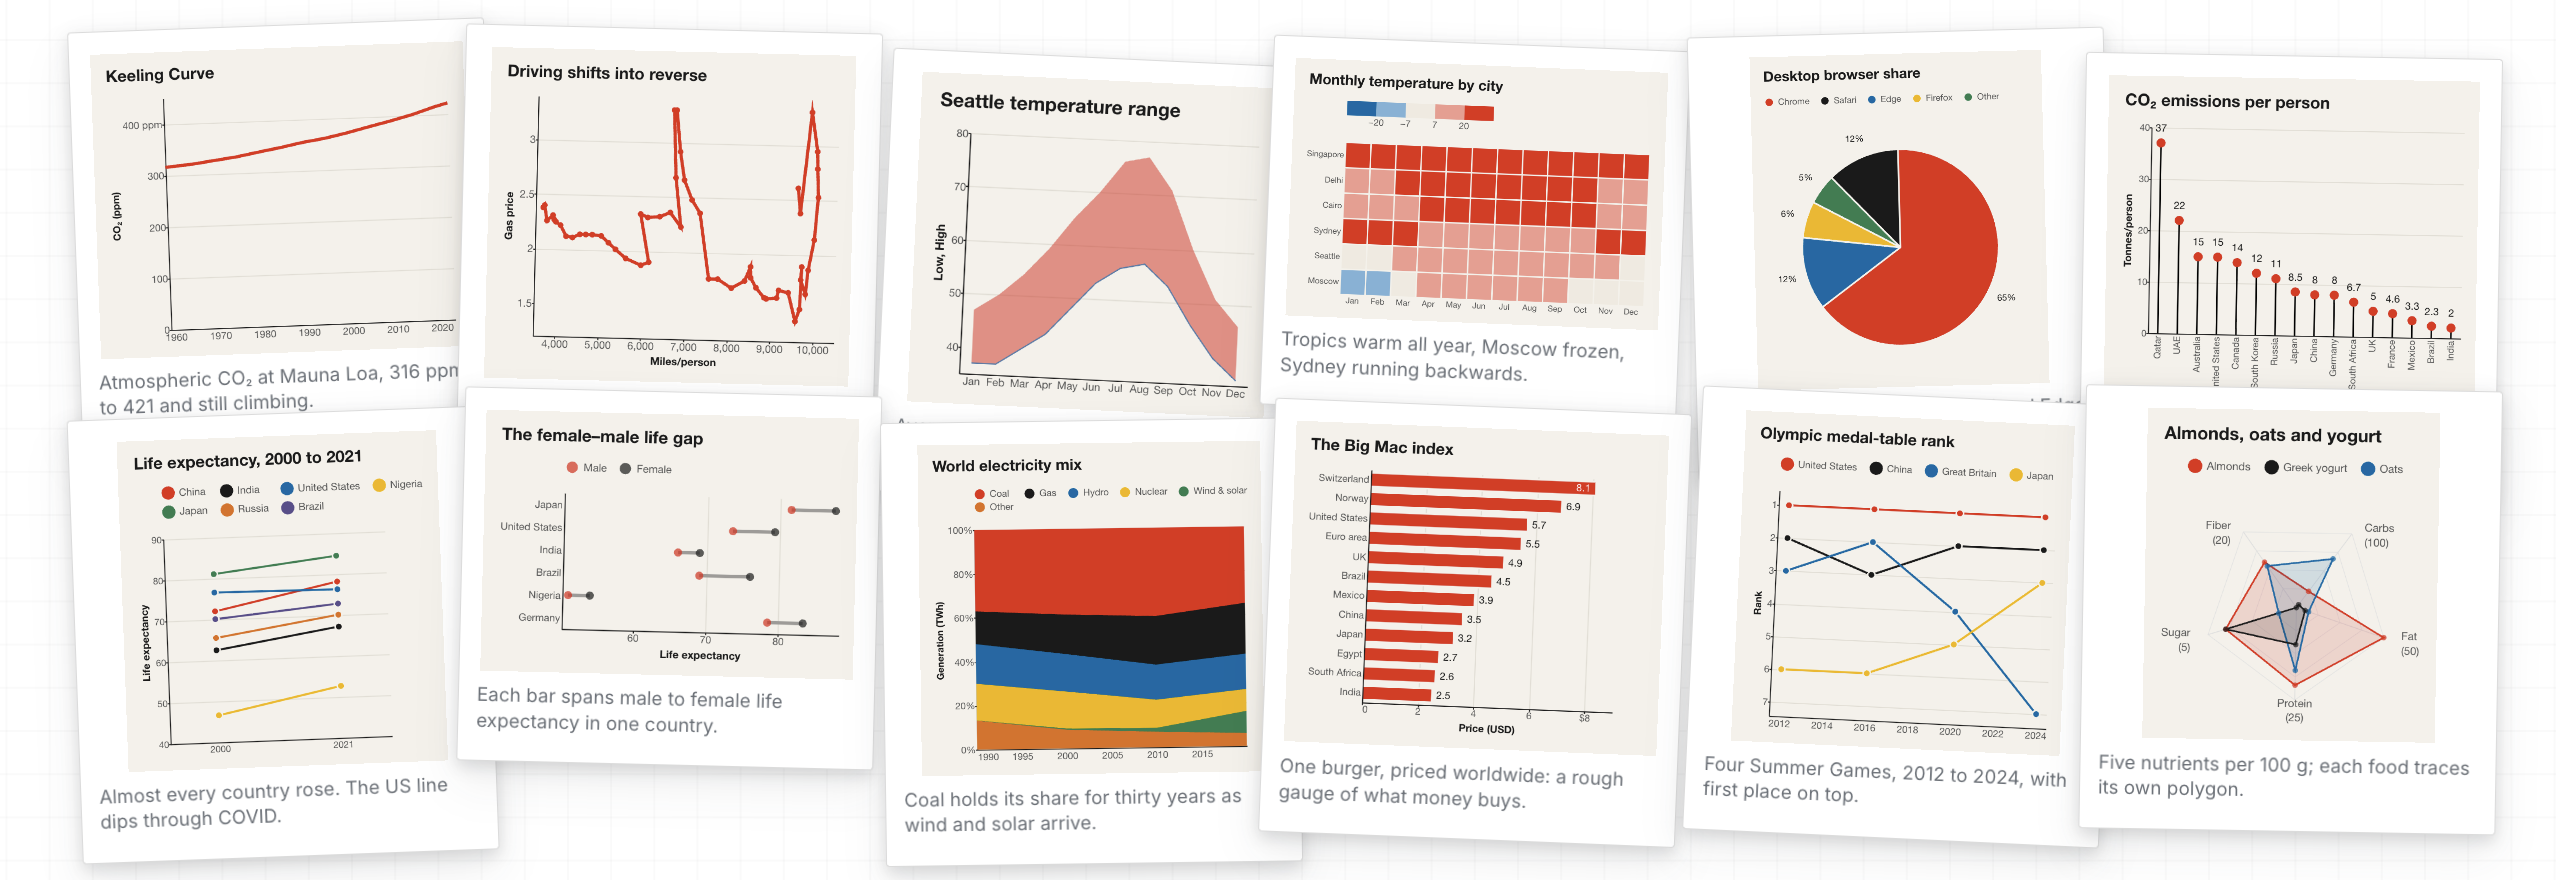
Swiss — typographic structure, restrained color, and a clear visual grid.
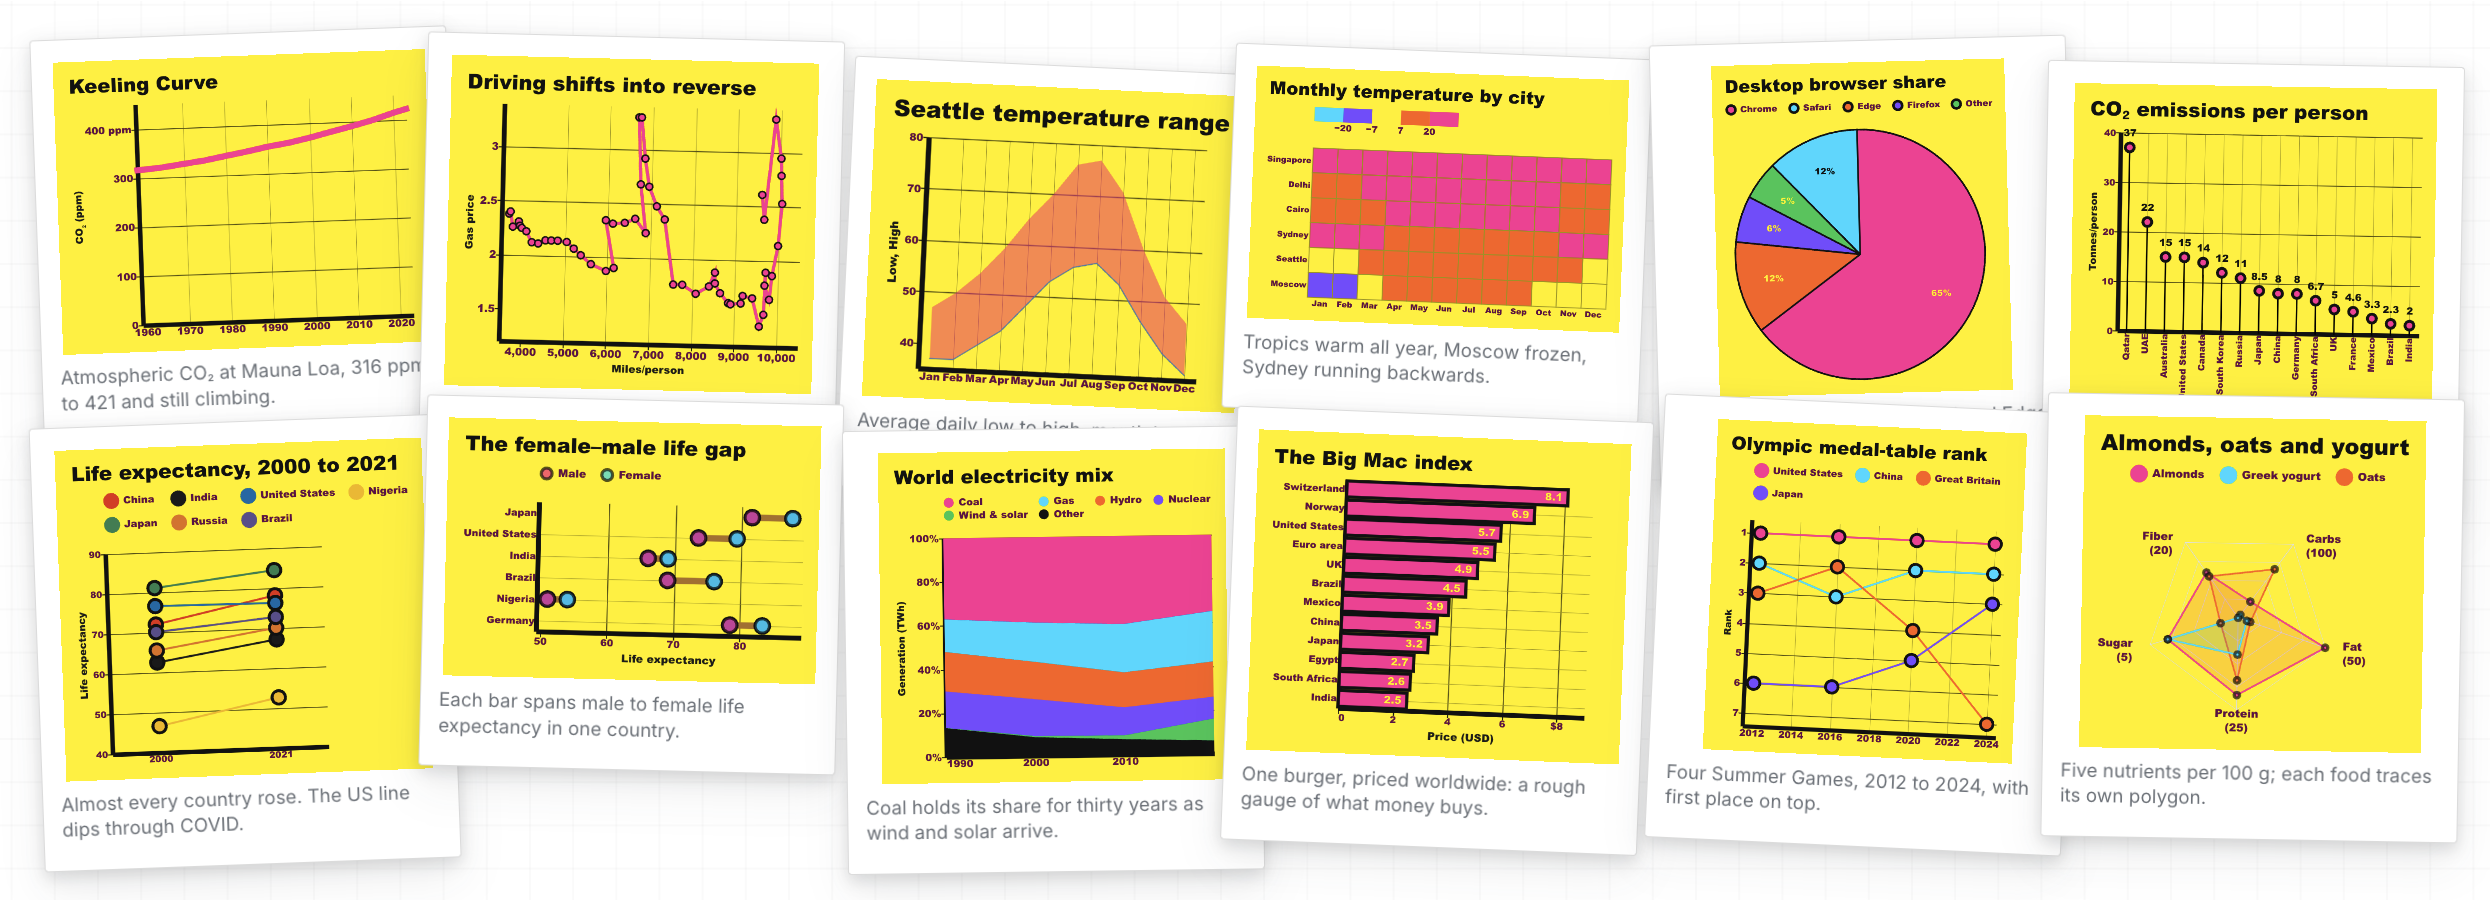
Pop — bold color, emphatic marks, and playful graphic contrast.
See the API reference, backend references for
Vega-Lite, ECharts,
Chart.js, Plotly, and
Excel, plus the
live editor for more library examples.
Use Flint As An MCP Server
Install flint-chart-mcp as a Model Context Protocol
server when you want an agent to create charts in the same conversation where
the question starts. It can open an interactive chart view, return static
PNG/SVG output, or produce backend-native chart specs.
For setup, start with the
Flint MCP project page. It
includes client configuration, usage examples, and links to deeper references.
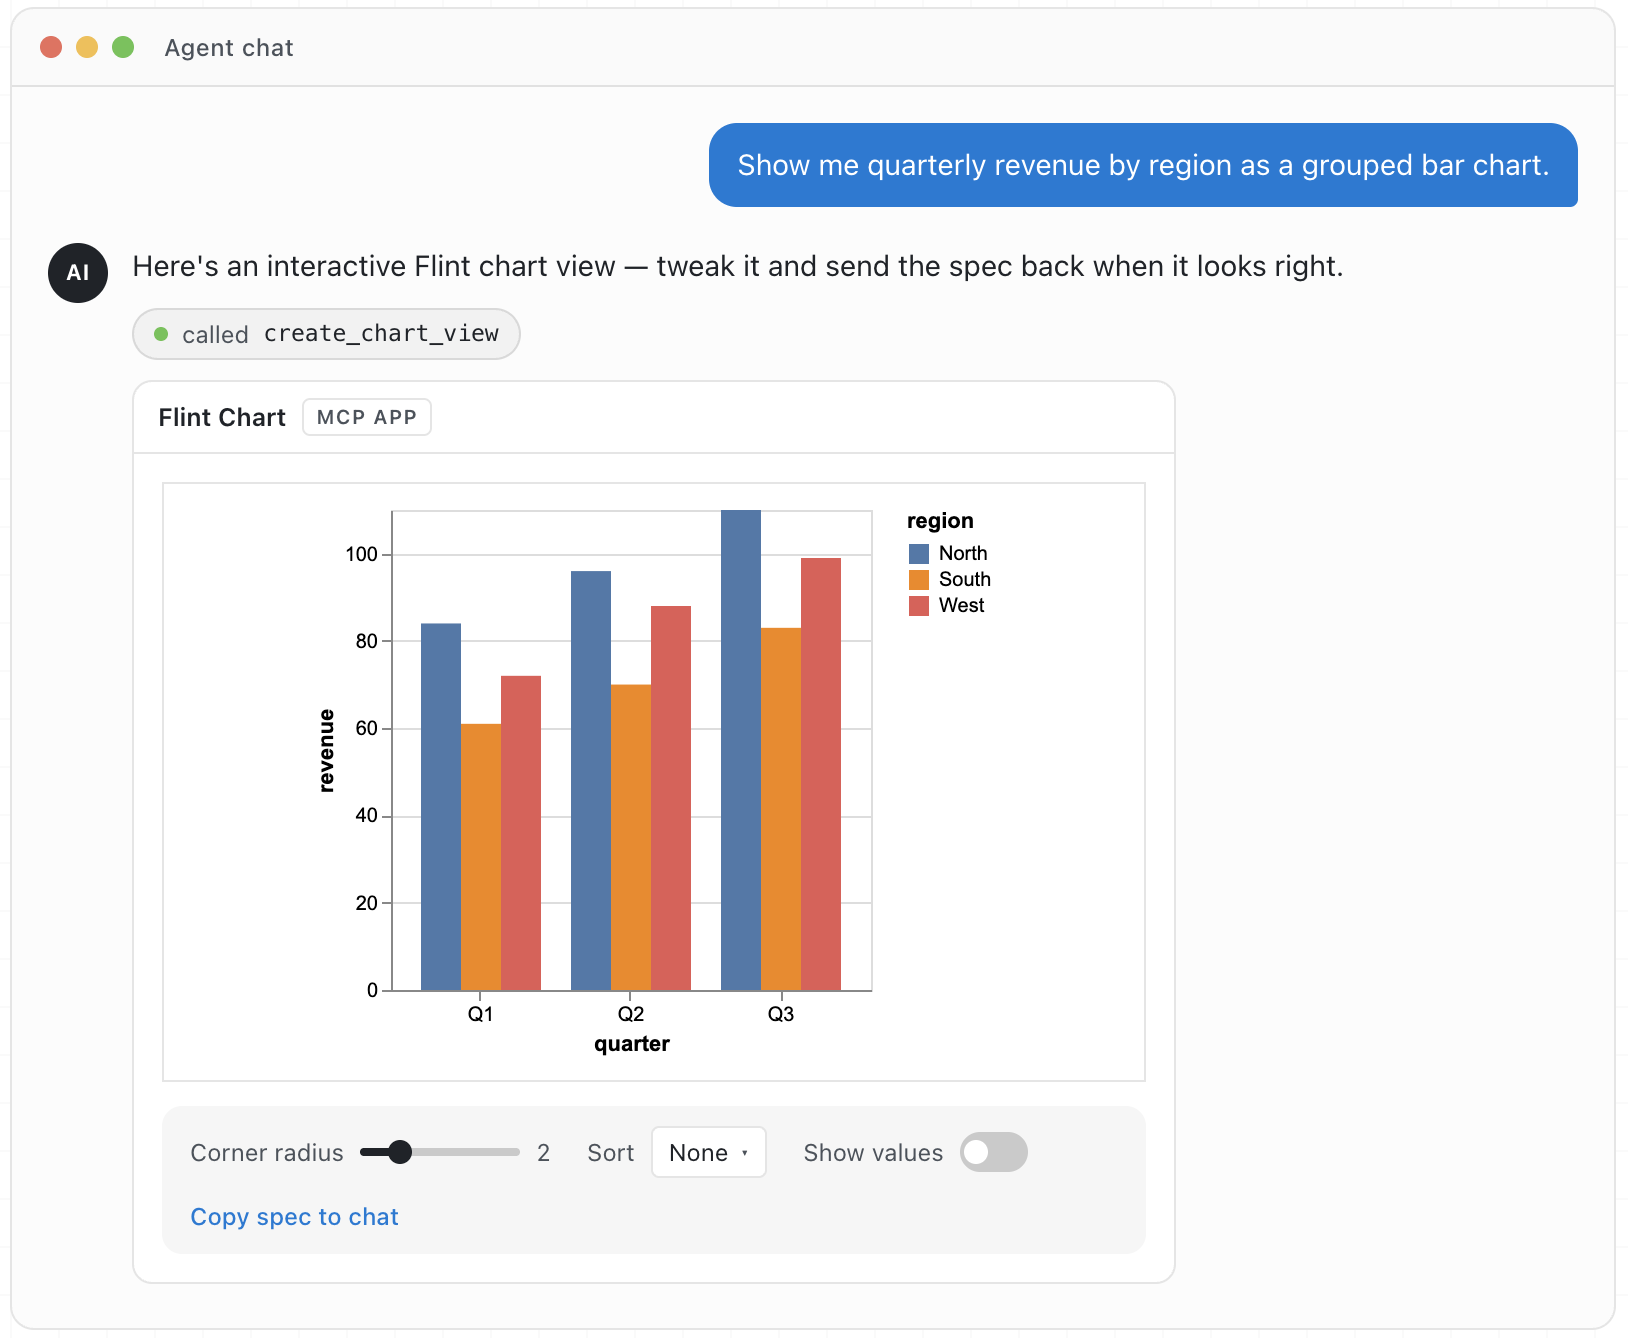
MCP calls let agents embed rows directly as data.values, or read local JSON,
CSV, or TSV files by data.url. For agent workflows without MCP,
use the standalone agent skill.
Repository overview
flint-chart/
├── packages/
│   ├── flint-js/            npm package `flint-chart` (TypeScript)
│   │   └── src/
│   │       ├── core/        semantics, themes, layout, decisions, shared types
│   │       ├── chart-types/ shared chart definitions and template metadata
│   │       ├── vegalite/    Vega-Lite backend
│   │       ├── echarts/     ECharts backend
│   │       ├── chartjs/     Chart.js backend
│   │       ├── plotly/      Plotly backend
│   │       ├── excel/       native Excel backend
│   │       ├── gallery/     gallery assembly and generated references
│   │       └── test-data/   fixtures and stress-test generators
│   ├── flint-mcp/           MCP server, MCP App UI, assets, and tests
│   └── flint-py/            Python port preview (package to be released)
├── site/                    Vite + React project site, gallery, editor, and docs
├── agent-skills/            chart- and theme-authoring skills for agents
├── agents/                  agent and MCP server configuration
├── shared/test-data/        JSON fixtures shared across JS and Python
├── scripts/                 reference generation and theme audit tooling
├── docs/                    user, API, backend, and architecture documentation
└── design-docs/             design proposals and implementation research
Documentation
The project site is the main entry
point for examples, the live editor, and concept docs. For source-level
references, start with the API reference, the
theme guide, the
Flint MCP project page, or the
Development guide. See the changelog for
notable changes in each release.
Contributing
Contributions are welcome! See .github/CONTRIBUTING.md
and the Development guide.
git clone https://github.com/microsoft/flint-chart
cd flint-chart
npm install            # root workspaces: packages/flint-js + flint-mcp + site

npm run typecheck      # typecheck packages/flint-js + packages/flint-mcp
npm run test           # Vitest (packages/flint-js + packages/flint-mcp)
npm run build          # build packages/flint-js + packages/flint-mcp
npm run site           # demo site (gallery + editor) at http://localhost:5274/
Node 18+ is required. The demo site aliases flint-chart to
packages/flint-js/src, so library edits hot-reload in the gallery and editor
without rebuilding dist/.
We especially welcome contributions that add new
chart templates or new
rendering backends.
This project has adopted the
Microsoft Open Source Code of Conduct. See
SECURITY.md to report vulnerabilities.
Contributor
Flint is built by Microsoft Research
in collaboration with the IDEAS Lab, Renmin University
of China. We welcome you to join us — see Contributing to get involved.
A research paper describing Flint is coming soon.
Trademarks
This project may contain trademarks or logos for projects, products, or services.
Authorized use of Microsoft trademarks or logos is subject to and must follow
Microsoft's Trademark & Brand Guidelines.
Use of Microsoft trademarks or logos in modified versions of this project must not
cause confusion or imply Microsoft sponsorship. Any use of third-party trademarks
or logos is subject to those third parties' policies.
License
MIT © Microsoft Corporation

 Flint 是一种可视化中间语言,让 AI 智能体把简单、人类可编辑的图表规格变成精致、富有表现力的图表,而不必手写比例尺、坐标轴和布局。