
See where your AI spend goes.




If CodeBurn shows you something your bill never did, star the repo so other developers find it, and consider sponsoring to keep 41 integrations honest.
Desktop
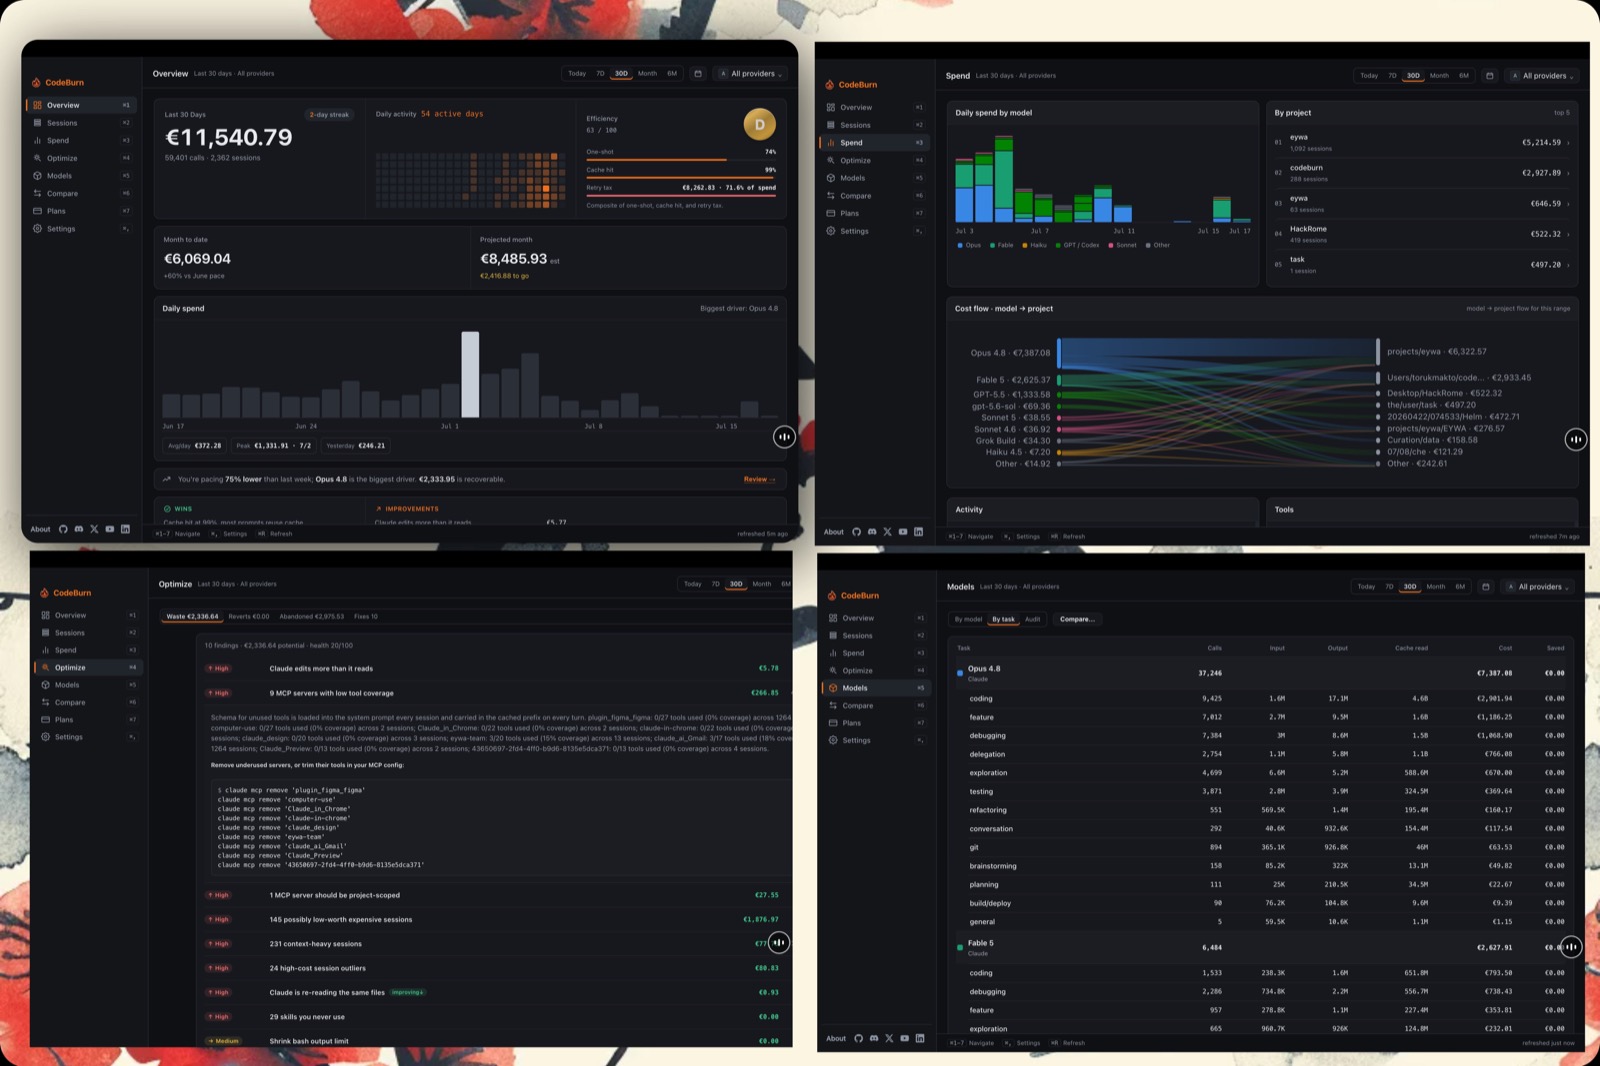






|
Web
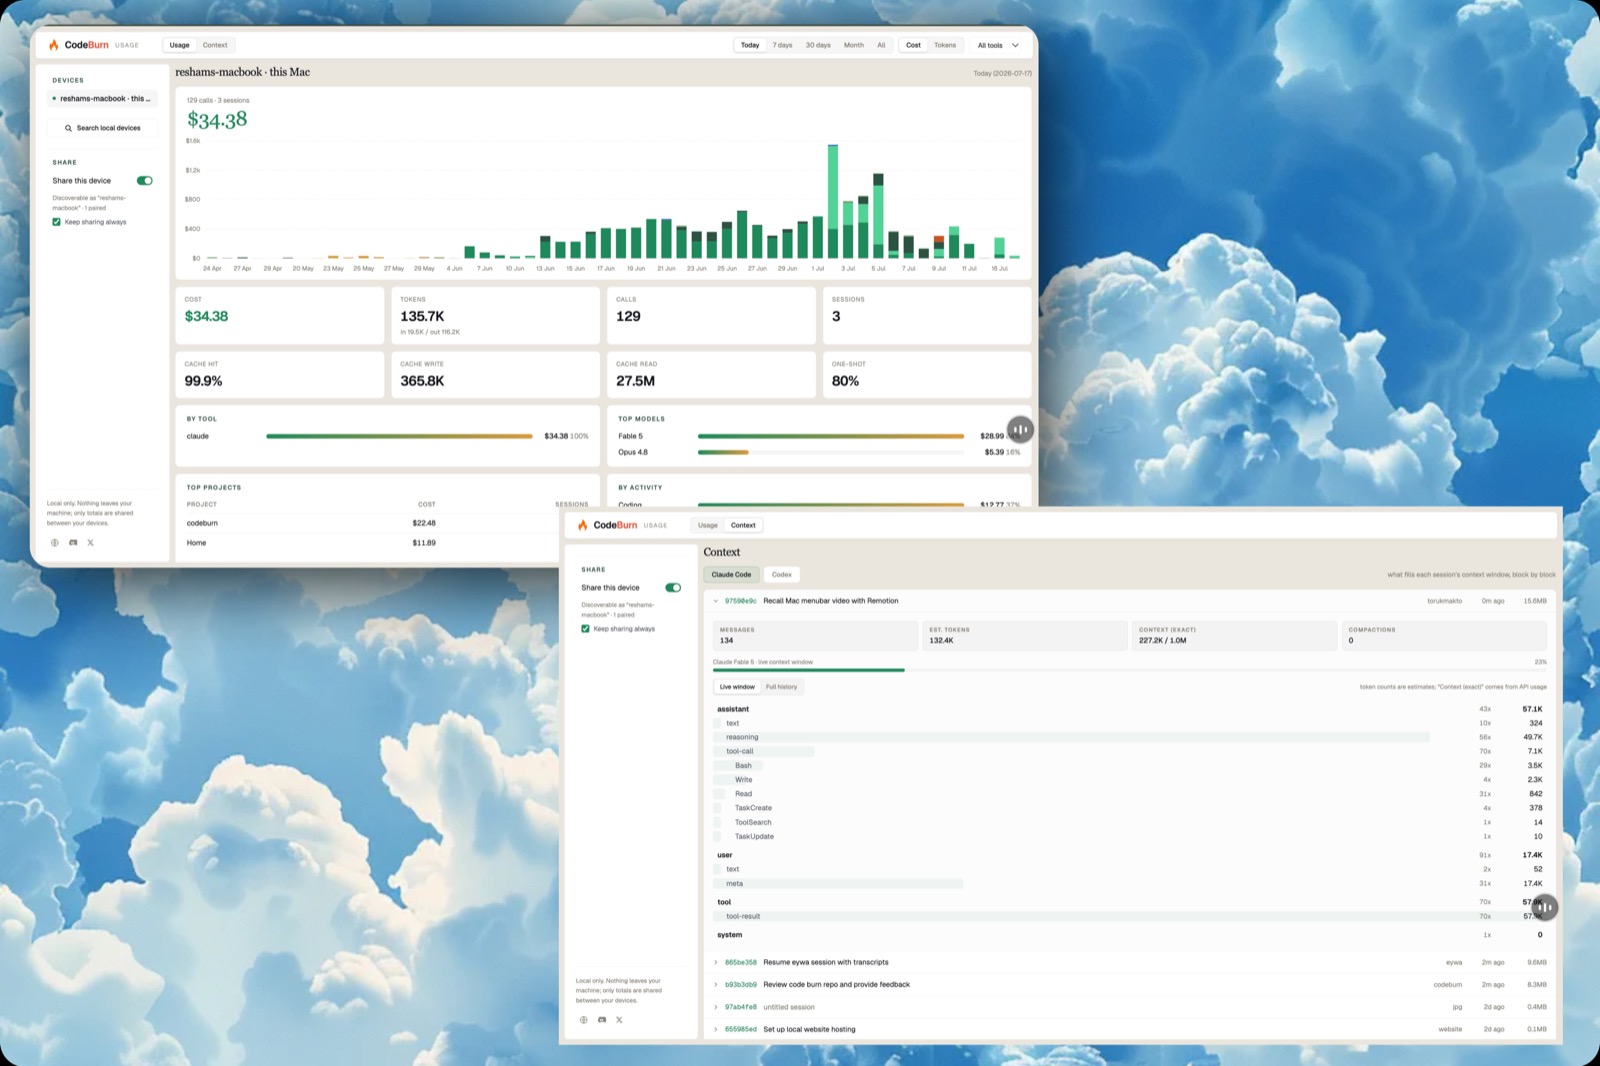
npx codeburn web
|
Terminal
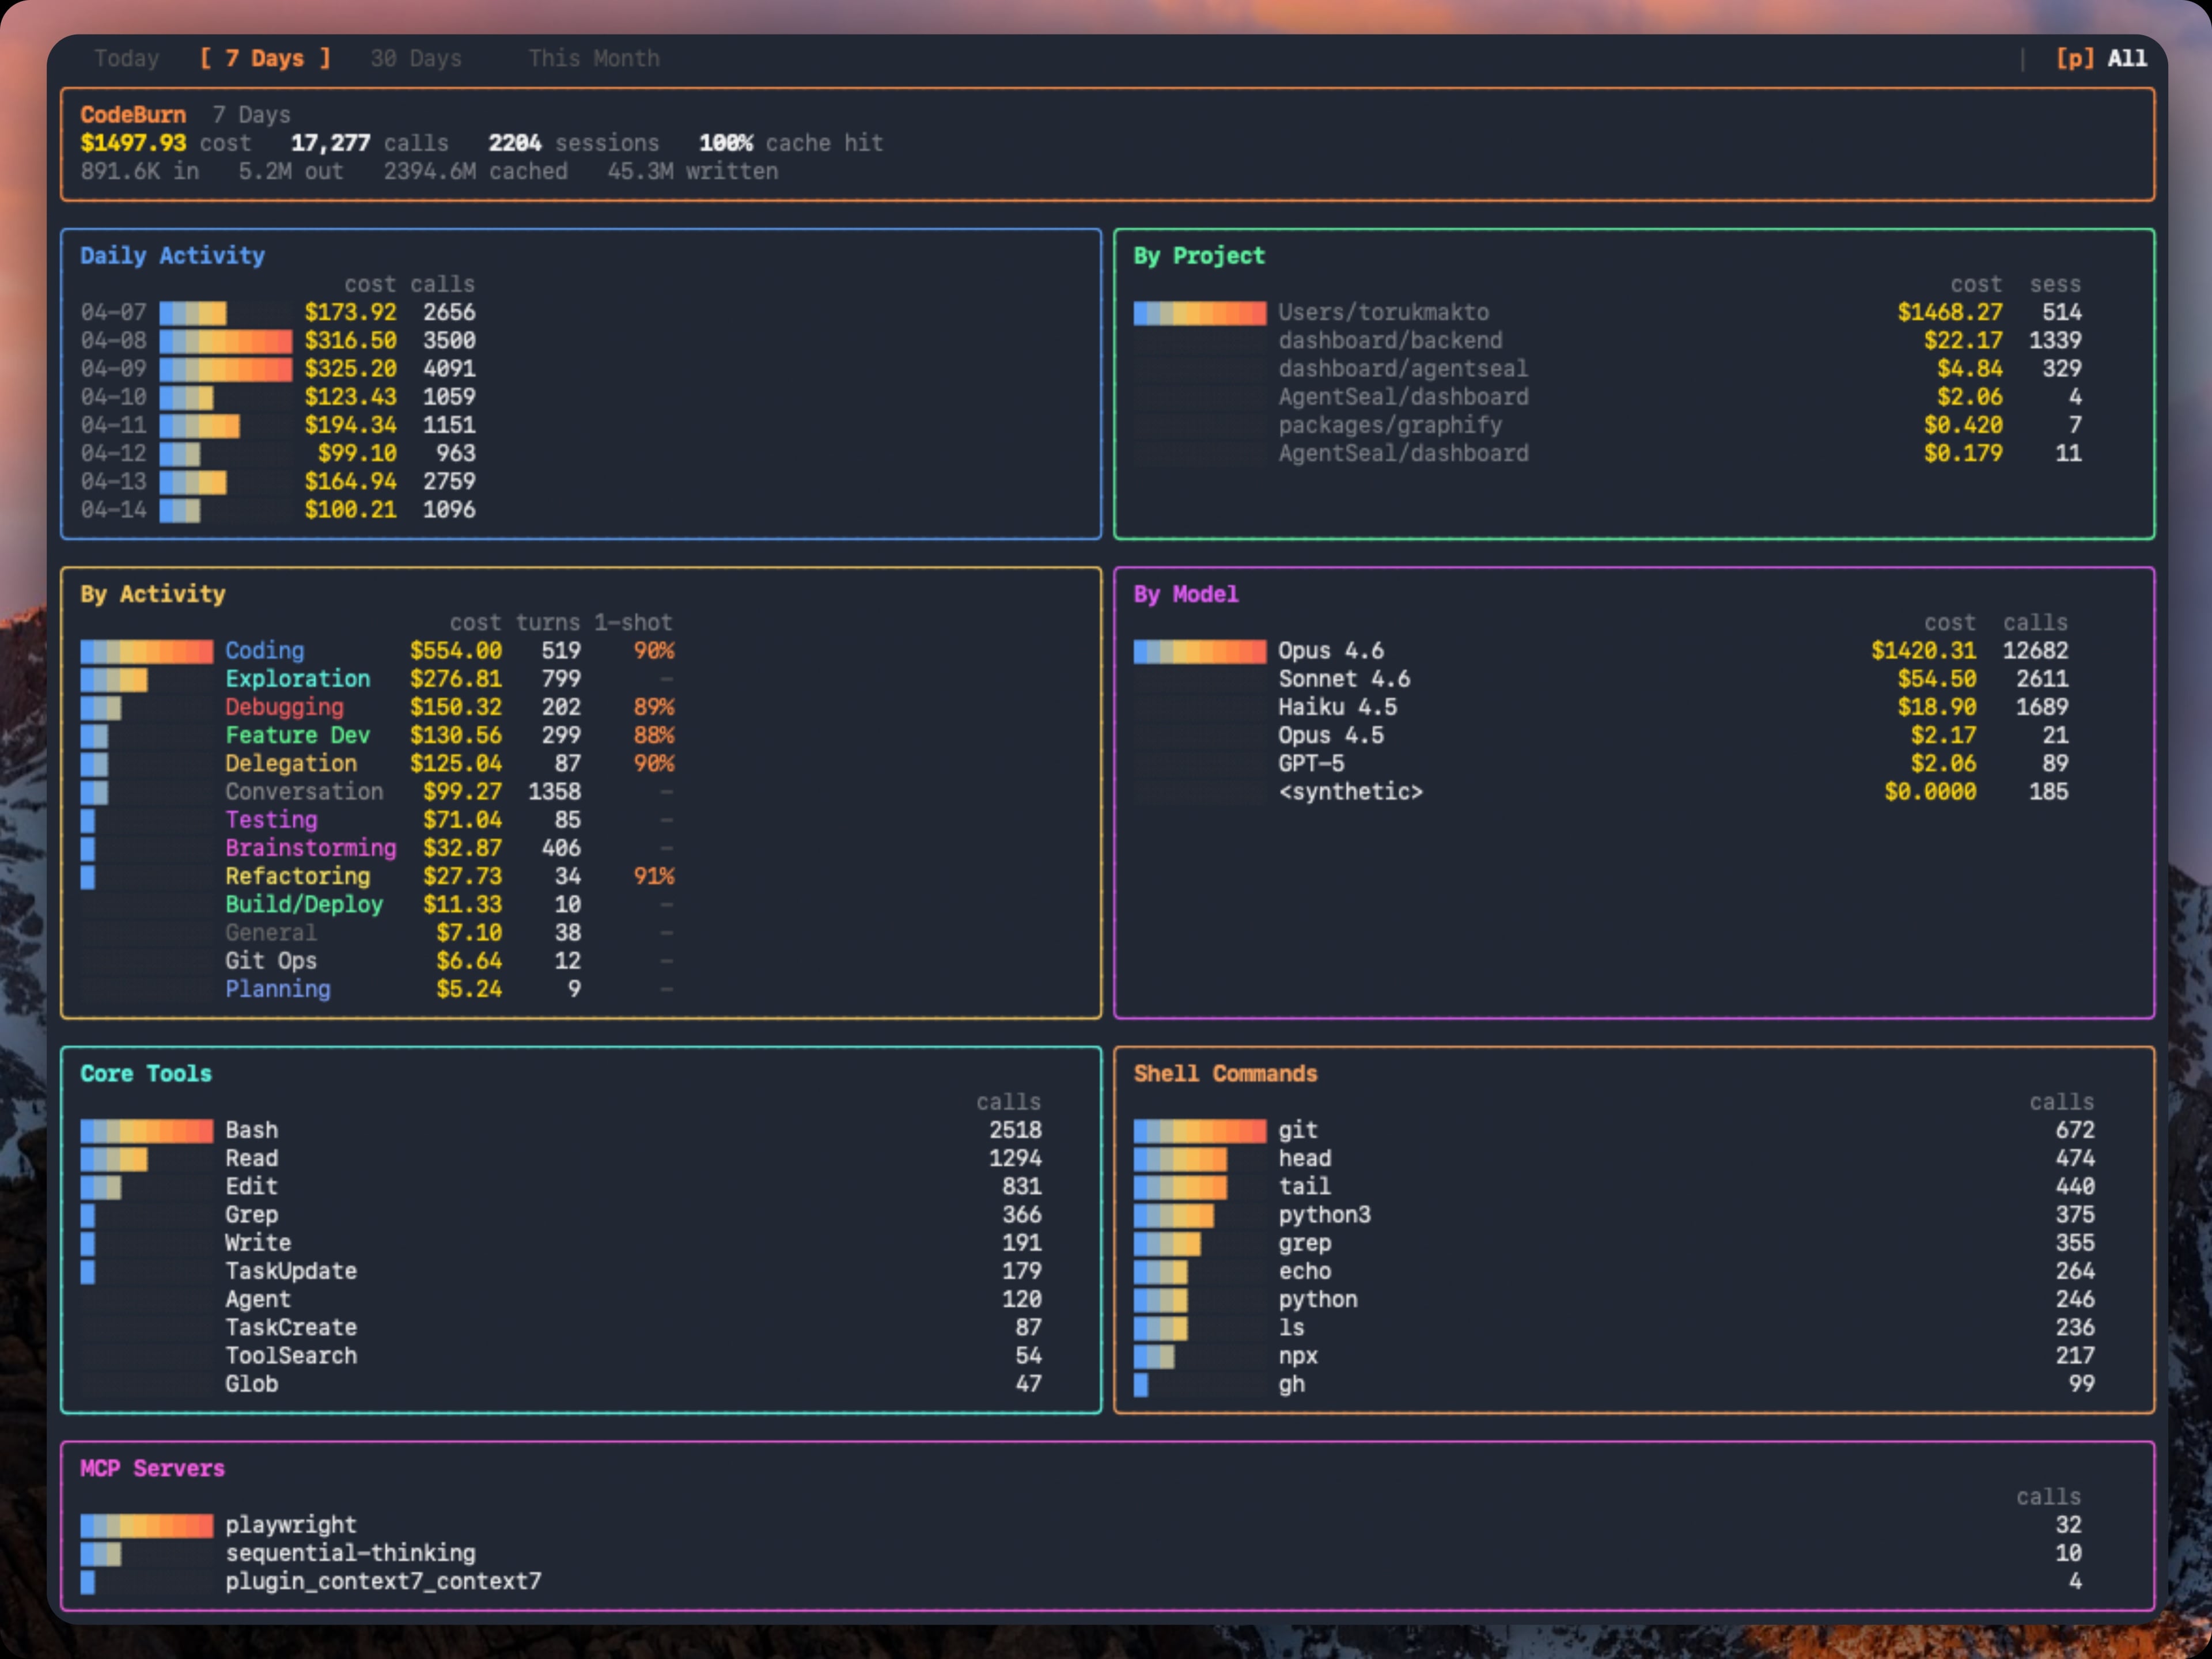
npx codeburn
|
Menubar
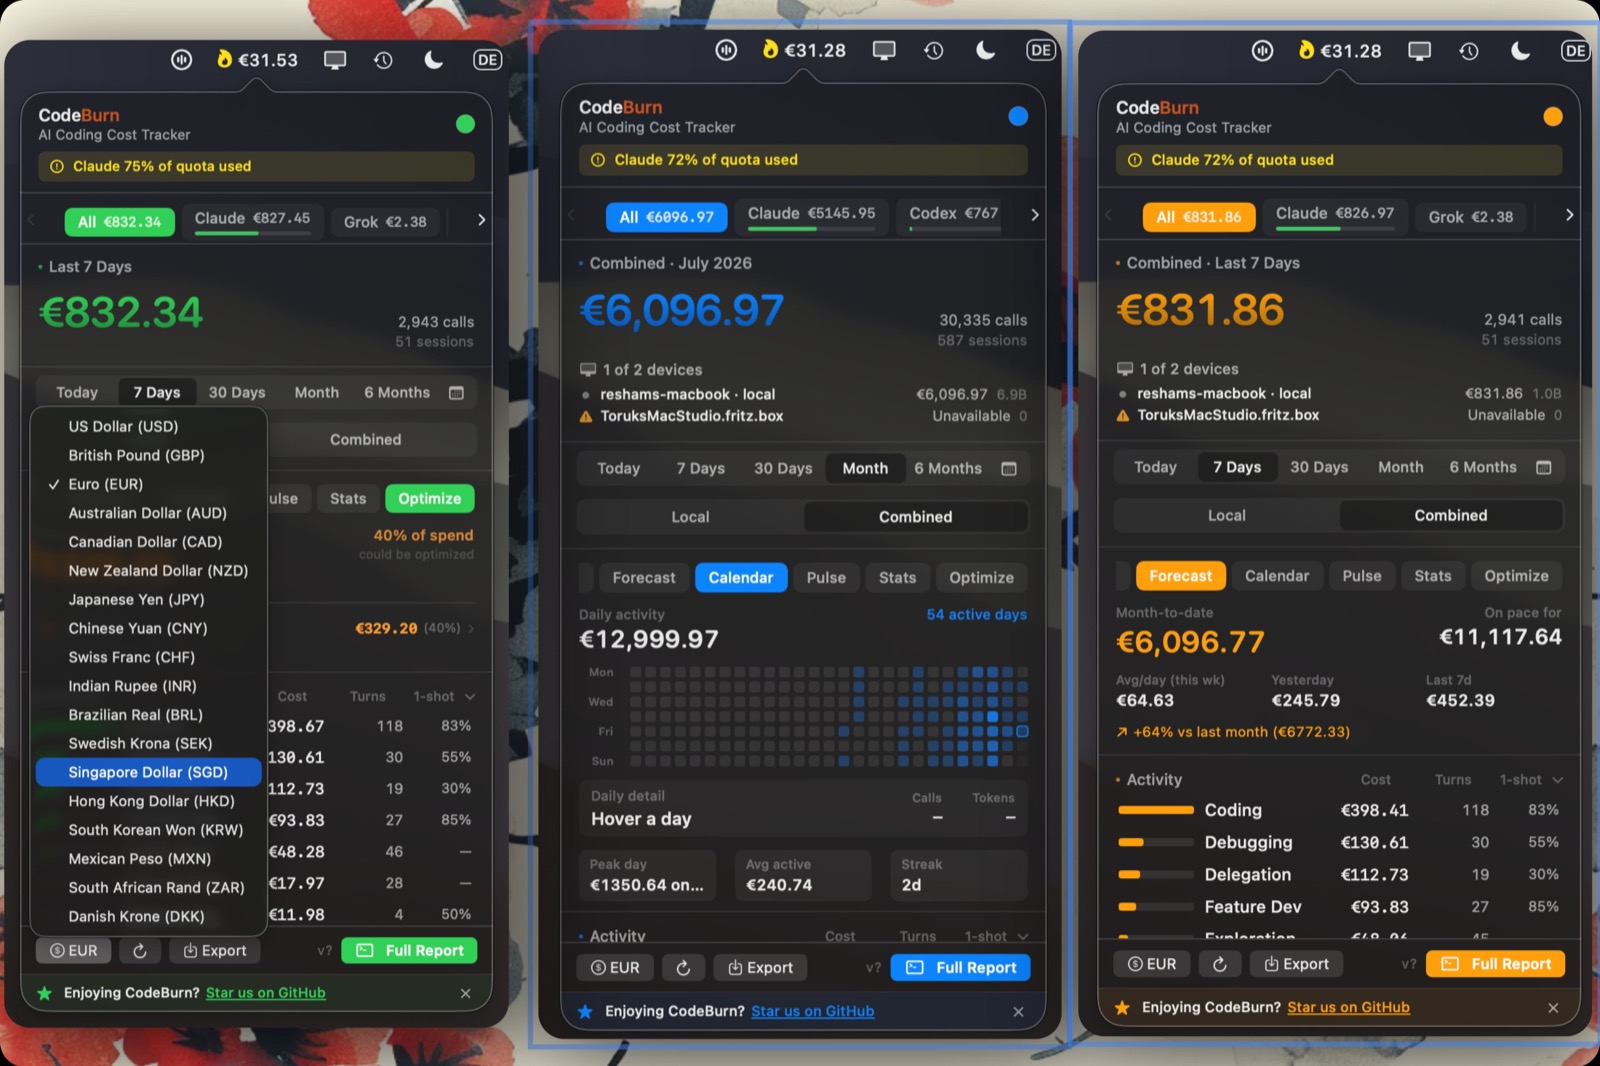
codeburn menubar
-F97316?logo=windows&logoColor=white)
|
Capacity Dock · macOS menubar and Windows tray
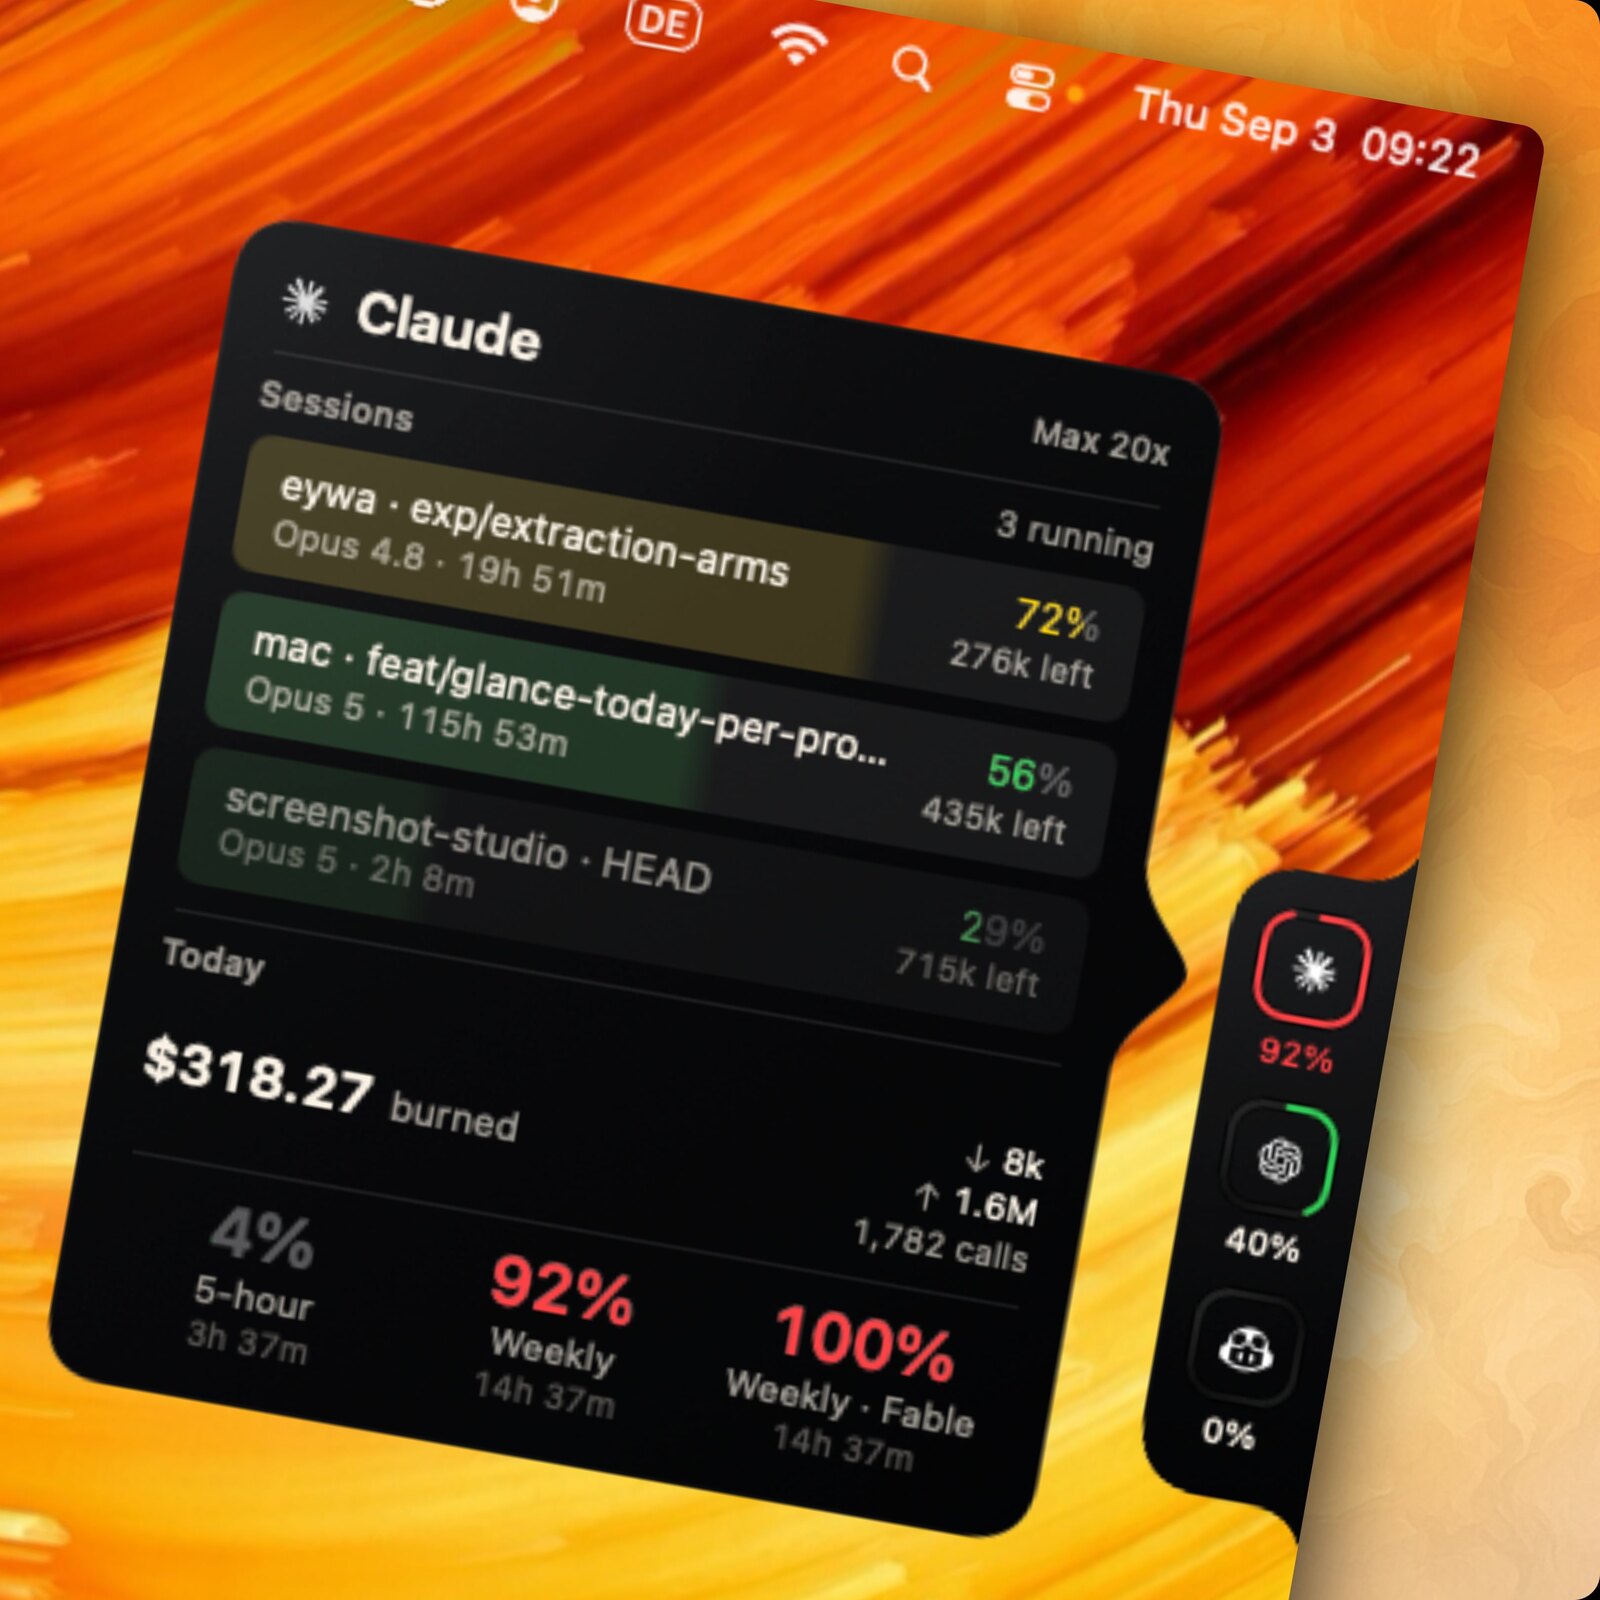
codeburn menubar
|
One source of truth: every surface reads the session files already on your disk.
CodeBurn is a free, open-source, local-first tool that tracks AI coding token usage and cost across 41 tools and agents (Claude Code, Cursor, Codex, Gemini, Grok and more), broken down by model, project, and task.
You pay for Claude, Codex, Cursor, and a stack of other AI tools. The bill tells you the total. It never tells you that half of it went to conversation instead of code, or that an expensive model burned your budget on work a cheaper one would have one-shot.
CodeBurn does. It reads the session files your tools already write to disk and breaks down every token and dollar by task, model, tool, and project, across 41 AI tools.
Everything runs locally. No wrapper, no proxy, no API keys, nothing leaves your machine. Pricing comes from LiteLLM, refreshed daily. The optional desktop app can send an anonymous, bucketed usage report if you say yes to it; see Telemetry.
Quick start ·
Find waste ·
Apply fixes ·
Guard ·
Compare models ·
Track what shipped ·
MCP ·
Supported tools ·
Commands ·
Features ·
How it reads data ·
Telemetry
Quick start
Run it instantly, no install needed:
npx codeburn
That opens the interactive dashboard (today by default, or the last 7 days when today has no usage yet). Arrow keys switch periods, q quits. That is the 30-second version. You now know where your AI budget goes.
Install it for a permanent codeburn command:
npm install -g codeburn
Also runs via bunx codeburn or pnpm dlx codeburn, or brew install codeburn on macOS.
Menu bar app for macOS, with your spend always in the menu bar:
codeburn menubar
The same command installs the tray app on Windows; see Windows. On Linux, a GNOME Shell extension gives it in the top panel; see Linux (GNOME).
Requires Node.js 22.13+ and at least one supported tool with session data on disk. For Cursor and OpenCode, better-sqlite3 installs automatically.
Your month at a glance
codeburn overview                                    # this month, clean tables
codeburn overview --no-color                         # plain text, ready to paste
codeburn overview --from 2026-06-01 --to 2026-06-15  # any date range
codeburn overview -p all                             # last 6 months
codeburn overview -p lifetime                        # full history (uncapped)
codeburn overview --provider claude                  # one tool only
codeburn overview prints a copy-pasteable summary of where your AI spend went: totals (cost, tokens, cache hit), a breakdown by tool and by top model, your highest-value days, top projects, a per-day table, and activity and tool usage. Pipe it anywhere (into pbcopy, a PR, Slack, or a tweet); color drops automatically when the output is not a terminal, or pass --no-color.
CodeBurn  June 2026

Totals
  Cost       $2,795.10
  Tokens     3.49B   in 23.9M / out 20.2M / cache-w 72.5M / cache-r 3.38B
  Calls      14,755   sessions 753
  Cache hit  99.3%

By tool
┌──────────┬───────────┬────────┬───────┐
│ Tool     │      Cost │ Tokens │ Share │
├──────────┼───────────┼────────┼───────┤
│ claude   │ $2,662.37 │  3.34B │   95% │
│ codex    │   $119.12 │ 128.1M │    4% │
└──────────┴───────────┴────────┴───────┘

(plus Top models, Highest-value days, Top projects, a per-day table, By activity, and Tools)
Find and fix waste
codeburn optimize                       # scan the last 30 days
codeburn optimize -p today              # today only
codeburn optimize -p week               # last 7 days
codeburn optimize --provider claude     # restrict to one provider
codeburn optimize --format json         # setup health + findings as JSON
codeburn optimize scans your sessions and your ~/.claude/ setup for waste patterns:
For Claude Code, the optimize session count, the per-session findings, coaching,
and model-default recommendations use user-started (main) sessions. Subagent
sidechain transcripts are excluded from that population because their delegated
context and delivery behavior are structurally different, and so is the re-read
finding, since a subagent starts on a fresh context. Findings about how Claude
uses tools (junk reads, read:edit ratio) and every spend, MCP, and
configuration-overhead finding keep counting them.
- Files Claude re-reads across sessions (same content, same context, over and over)
- Low Read:Edit ratio (editing without reading leads to retries and wasted tokens)
- Wasted bash output (uncapped
BASH_MAX_OUTPUT_LENGTH, trailing noise)
- Unused MCP servers still paying their tool-schema overhead every session
- Ghost agents, skills, and slash commands defined in
~/.claude/ but never invoked
- Bloated
CLAUDE.md files (with @-import expansion counted)
- Cache creation overhead and junk directory reads
- Context-heavy sessions where effective input/cache tokens swamp output
- Possibly low-worth expensive sessions with no edit turns or repeated retries
when no
git/gh delivery command is observed
Findings are grouped into three classes: Fix now (CodeBurn can apply it for you), Habits
(you change how you drive the next session), and FYI (informational, the cost may be justified).
Each one says whether its savings number is measured from provider-counted usage or estimated
from a model. See docs/optimize.md for what is scanned, what --apply may write,
and how to read the health grade.
Each finding shows the estimated token and dollar savings plus a ready-to-paste fix: a CLAUDE.md line, an environment variable, or a mv command to archive unused items. Findings are ranked by urgency (impact weighted against observed waste) and rolled up into an A to F setup health grade. Repeat runs classify each finding as new, improving, or resolved against a 48-hour recent window.
You can also open it inline from the dashboard: press o when a finding count appears in the status bar, b to return.
Apply fixes, undo anytime
codeburn optimize --apply             # review and apply fixes interactively
codeburn optimize --apply --dry-run   # print the plan, change nothing
codeburn optimize --apply --yes       # apply every appliable fix without prompting
codeburn act list                     # every change CodeBurn has made
codeburn act undo --last              # roll the most recent change back
codeburn act report                   # realized vs estimated savings
codeburn optimize --auto-revert       # undo the applied fixes that measured no reduction
codeburn optimize finds the waste; --apply fixes the config-class findings for you: settings values, environment variables, archiving unused agents and skills. Every change is backed up and journaled before it lands. codeburn act list shows the history and codeburn act undo <id> restores the original files (it refuses if the files changed since being applied, unless you pass --force).
The loop closes on honesty: once an applied fix is at least 3 days old, codeburn act report compares its estimated savings against what your sessions actually did, and every later codeburn optimize run lists it under Applied fixes with a plain verdict — worked, under its estimate, or did not help, with the undo command for that last case. --auto-revert undoes the ones that did nothing (never CLAUDE.md rules). Estimates get checked against reality, not just claimed.
Guard your budget
codeburn guard install            # hooks into this project's .claude/settings.json
codeburn guard install --global   # or into ~/.claude/settings.json
codeburn guard status             # caps, install locations, flagged projects
codeburn guard uninstall          # removes cleanly, leaves your own hooks alone
Guard installs opt-in hooks into Claude Code that watch session cost while you work:
- Soft cap (default $5): a one-time in-session warning when a session passes it.
- Hard cap (default $15): stops the session;
codeburn guard allow lifts it for that session only.
- Checkpoint (default $3): if a session ends past this with no edits and no commits, a nudge suggests starting fresh with a named deliverable.
- Session openers: projects where optimize found waste get a one-line flag at session start.
Caps are edited in ~/.config/codeburn/guard.json (set a value to null to disable it). Add --statusline to show session cost in the Claude Code status line. Installs go through the same journal as everything else, so codeburn act undo removes them too. Hooks fail open: a broken guard never blocks a session.
Compare models
codeburn compare                        # interactive model picker (default: last 6 months)
codeburn compare -p week                # last 7 days
codeburn compare -p today               # today only
codeburn compare --provider claude      # Claude Code sessions only
Which model is actually better for your work? Press c in the dashboard, or run codeburn compare. Arrow keys switch periods, b to return.
| Section |
Metric |
What it measures |
| Performance |
One-shot rate |
Edits that succeed without retries |
| Performance |
Retry rate |
Average retries per edit turn |
| Performance |
Self-correction |
Turns where the model corrected its own mistake |
| Efficiency |
Cost per call |
Average cost per API call |
| Efficiency |
Cost per edit |
Average cost per edit turn |
| Efficiency |
Output tokens per call |
Average output tokens per call |
| Efficiency |
Cache hit rate |
Proportion of input from cache |
Also compares per-category one-shot rates, delegation rate, planning rate, average tools per turn, and fast mode usage.
Track what shipped
codeburn yield                  # last 7 days (default)
codeburn yield -p today         # today only
codeburn yield -p 30days        # last 30 days
codeburn yield -p month         # this calendar month
codeburn yield --format json    # productive/reverted/abandoned/ambiguous spend as JSON
Did the spend actually ship? codeburn yield correlates AI sessions with git commits by timestamp:
| Category |
Meaning |
| Productive |
Commits from this session landed in main |
| Reverted |
Commits were later reverted |
| Abandoned |
No commits near session, or commits never merged |
| Ambiguous |
Session ran parallel to another and its window's commits were attributed to the tighter one |
Attribution is timestamp-window based (heuristic): each commit is credited to at most one session, the tightest window containing it. The JSON report carries methodology: "timestamp-window".
Requires a git repository. Run from your project directory.
Browser dashboard
codeburn web                    # opens http://localhost:4747 in your browser
codeburn web -p 30days          # start on a different period
codeburn web --port 8080        # pick a port (falls back to a free one if taken)
codeburn web --no-open          # start the server without opening a browser
A local web dashboard with the same task, model, tool, and project breakdowns as the TUI, rendered with charts. The usage graph follows the selected period with 15-minute, hourly, or daily buckets and can switch between per-session and per-model lines. Everything is read from disk on your machine and the server binds to localhost; nothing is uploaded.
Combine usage across your devices
See one total across your laptop, desktop, and work machine on the same network. On each other device, share its usage:
codeburn share --pair # opens a pairing window and prints a PIN
Then add it once from your main device (the PIN authorizes the pairing):
codeburn devices add            # find nearby devices and pair, or: add <host> --pin <pin>
codeburn devices                # combined totals by machine
codeburn devices rm <name>      # forget a device
Pairing is PIN-authorized and stays on your local network. You can also discover and pair devices straight from the browser dashboard.
macOS
codeburn menubar
One command: downloads the latest .app, installs into ~/Applications, and launches it. Re-run with --force to reinstall. The native Swift and SwiftUI app lives in mac/ (see mac/README.md for build details).
The menubar icon shows the spend period selected in Settings (Today by default; Week, Month, and 6 Months are also available). Non-today periods add a short suffix such as $42 / mo so the menu bar value stays clear. Click to open a popover with agent tabs, period switcher (Today, 7 Days, 30 Days, Month, All), Trend, Forecast, Pulse, Stats, and Plan insights, activity and model breakdowns, optimize findings, and CSV/JSON export. Refreshes every 30 seconds.
You can also set the menubar status period from Terminal:
defaults write org.agentseal.codeburn-menubar CodeBurnMenubarPeriod -string month
Allowed values are today, week, month, and sixMonths. Relaunch the app to apply external defaults changes.
Compact mode shrinks the menubar item to fit the text, dropping decimals (e.g. $110 instead of $110.20):
defaults write org.agentseal.codeburn-menubar CodeBurnMenubarCompact -bool true
Relaunch the app to



 CodeBurn 是一款免费开源、本地优先的工具,可以统计你在 41 种 AI 编程工具和智能体上的 token 用量和费用——包括 Claude Code、Cursor、Codex、Gemini、Grok 等——并能按模型、项目和任务细分。