












-F97316?logo=windows&logoColor=white)
Что это такое?
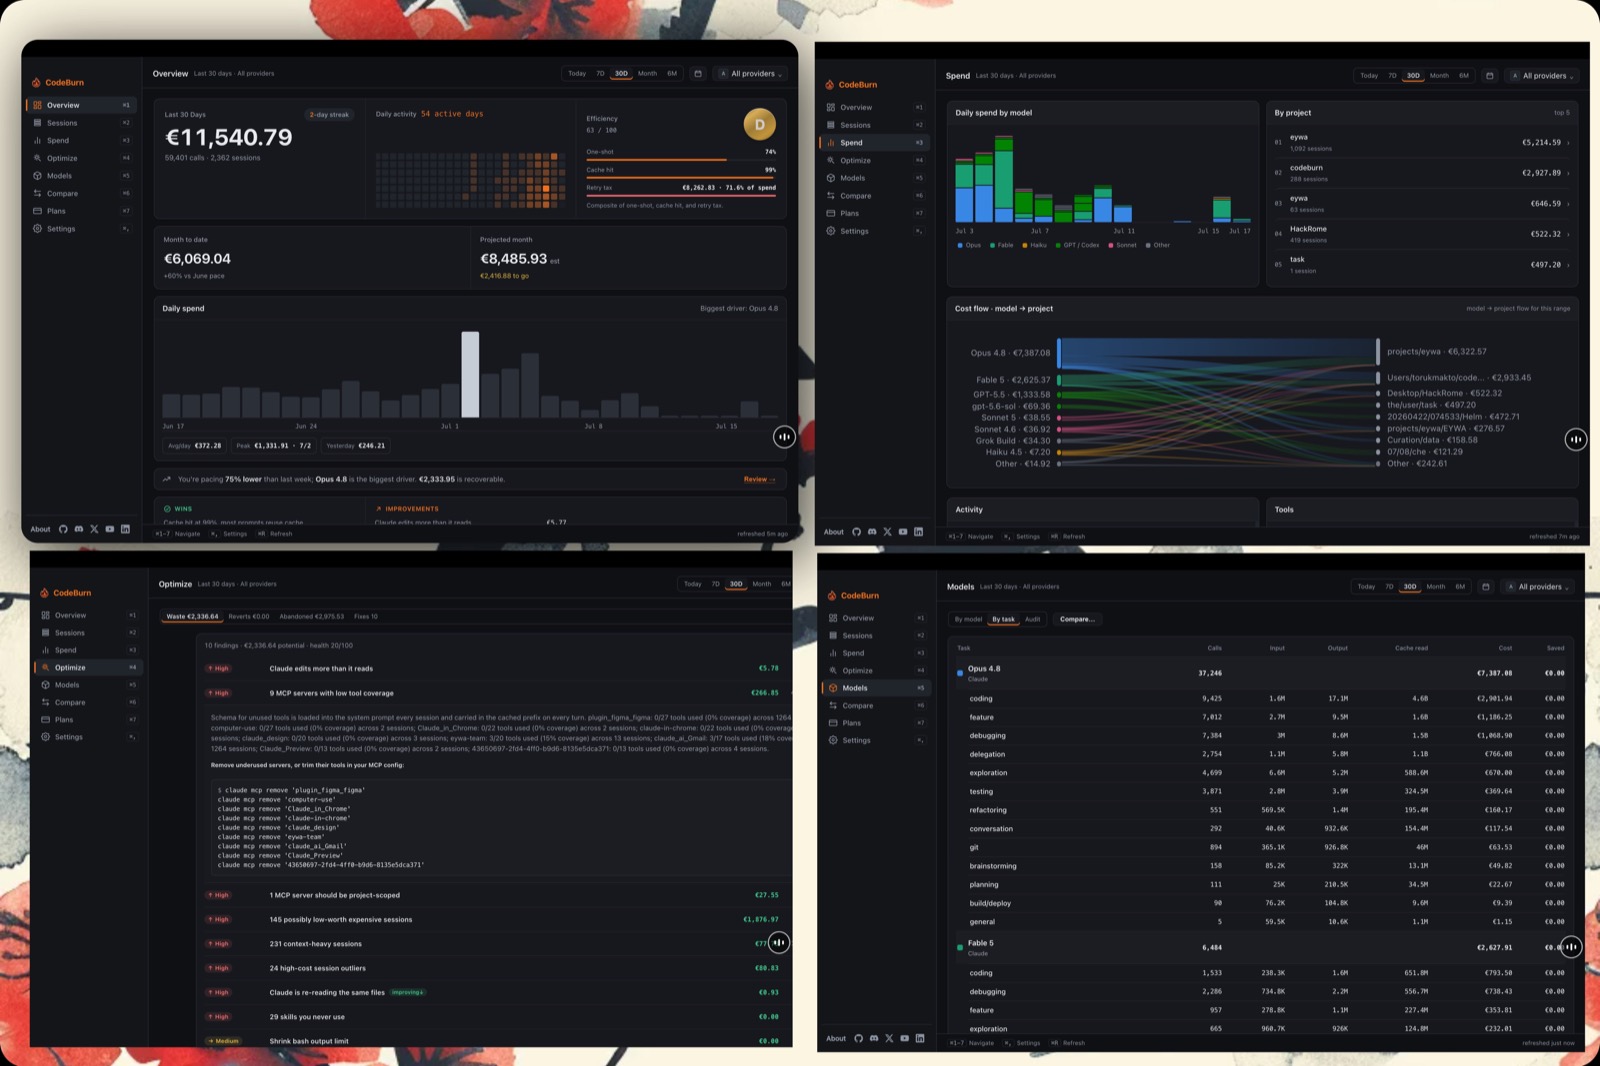
 CodeBurn — это бесплатный open-source инструмент, который работает локально и отслеживает расход токенов и затраты на ИИ-кодинг в 41 инструменте и агенте — Claude Code, Cursor, Codex, Gemini, Grok и других — с разбивкой по модели, проекту и задаче.
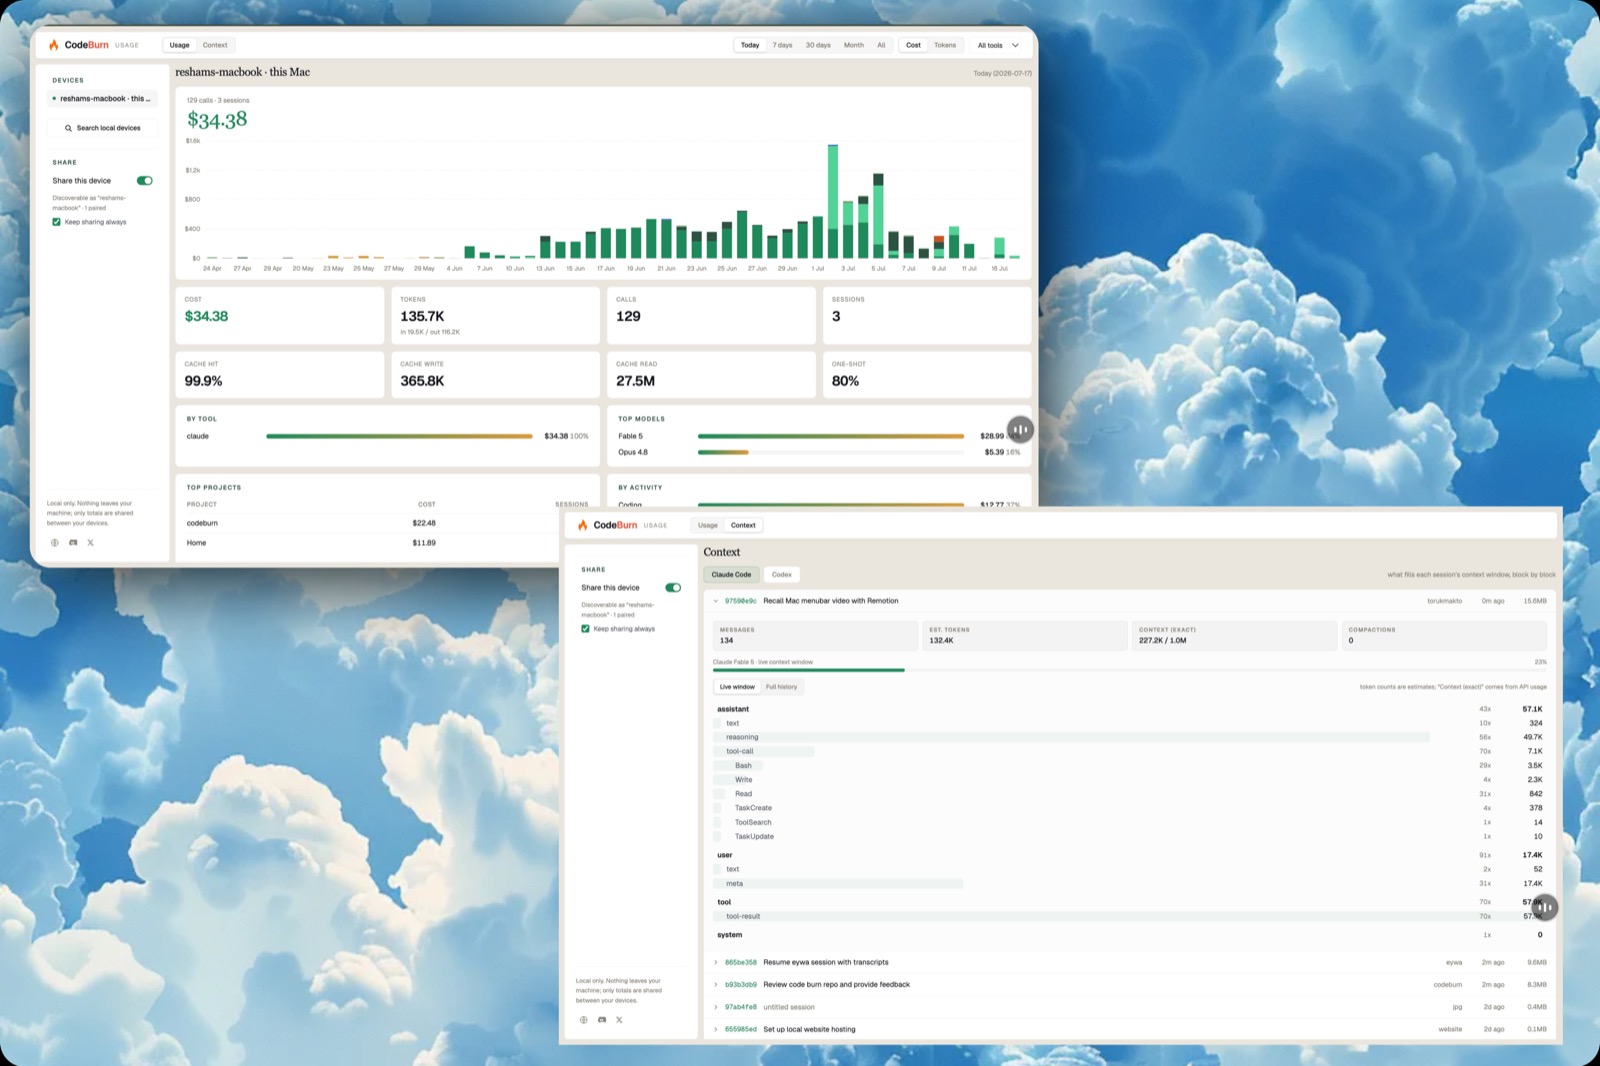
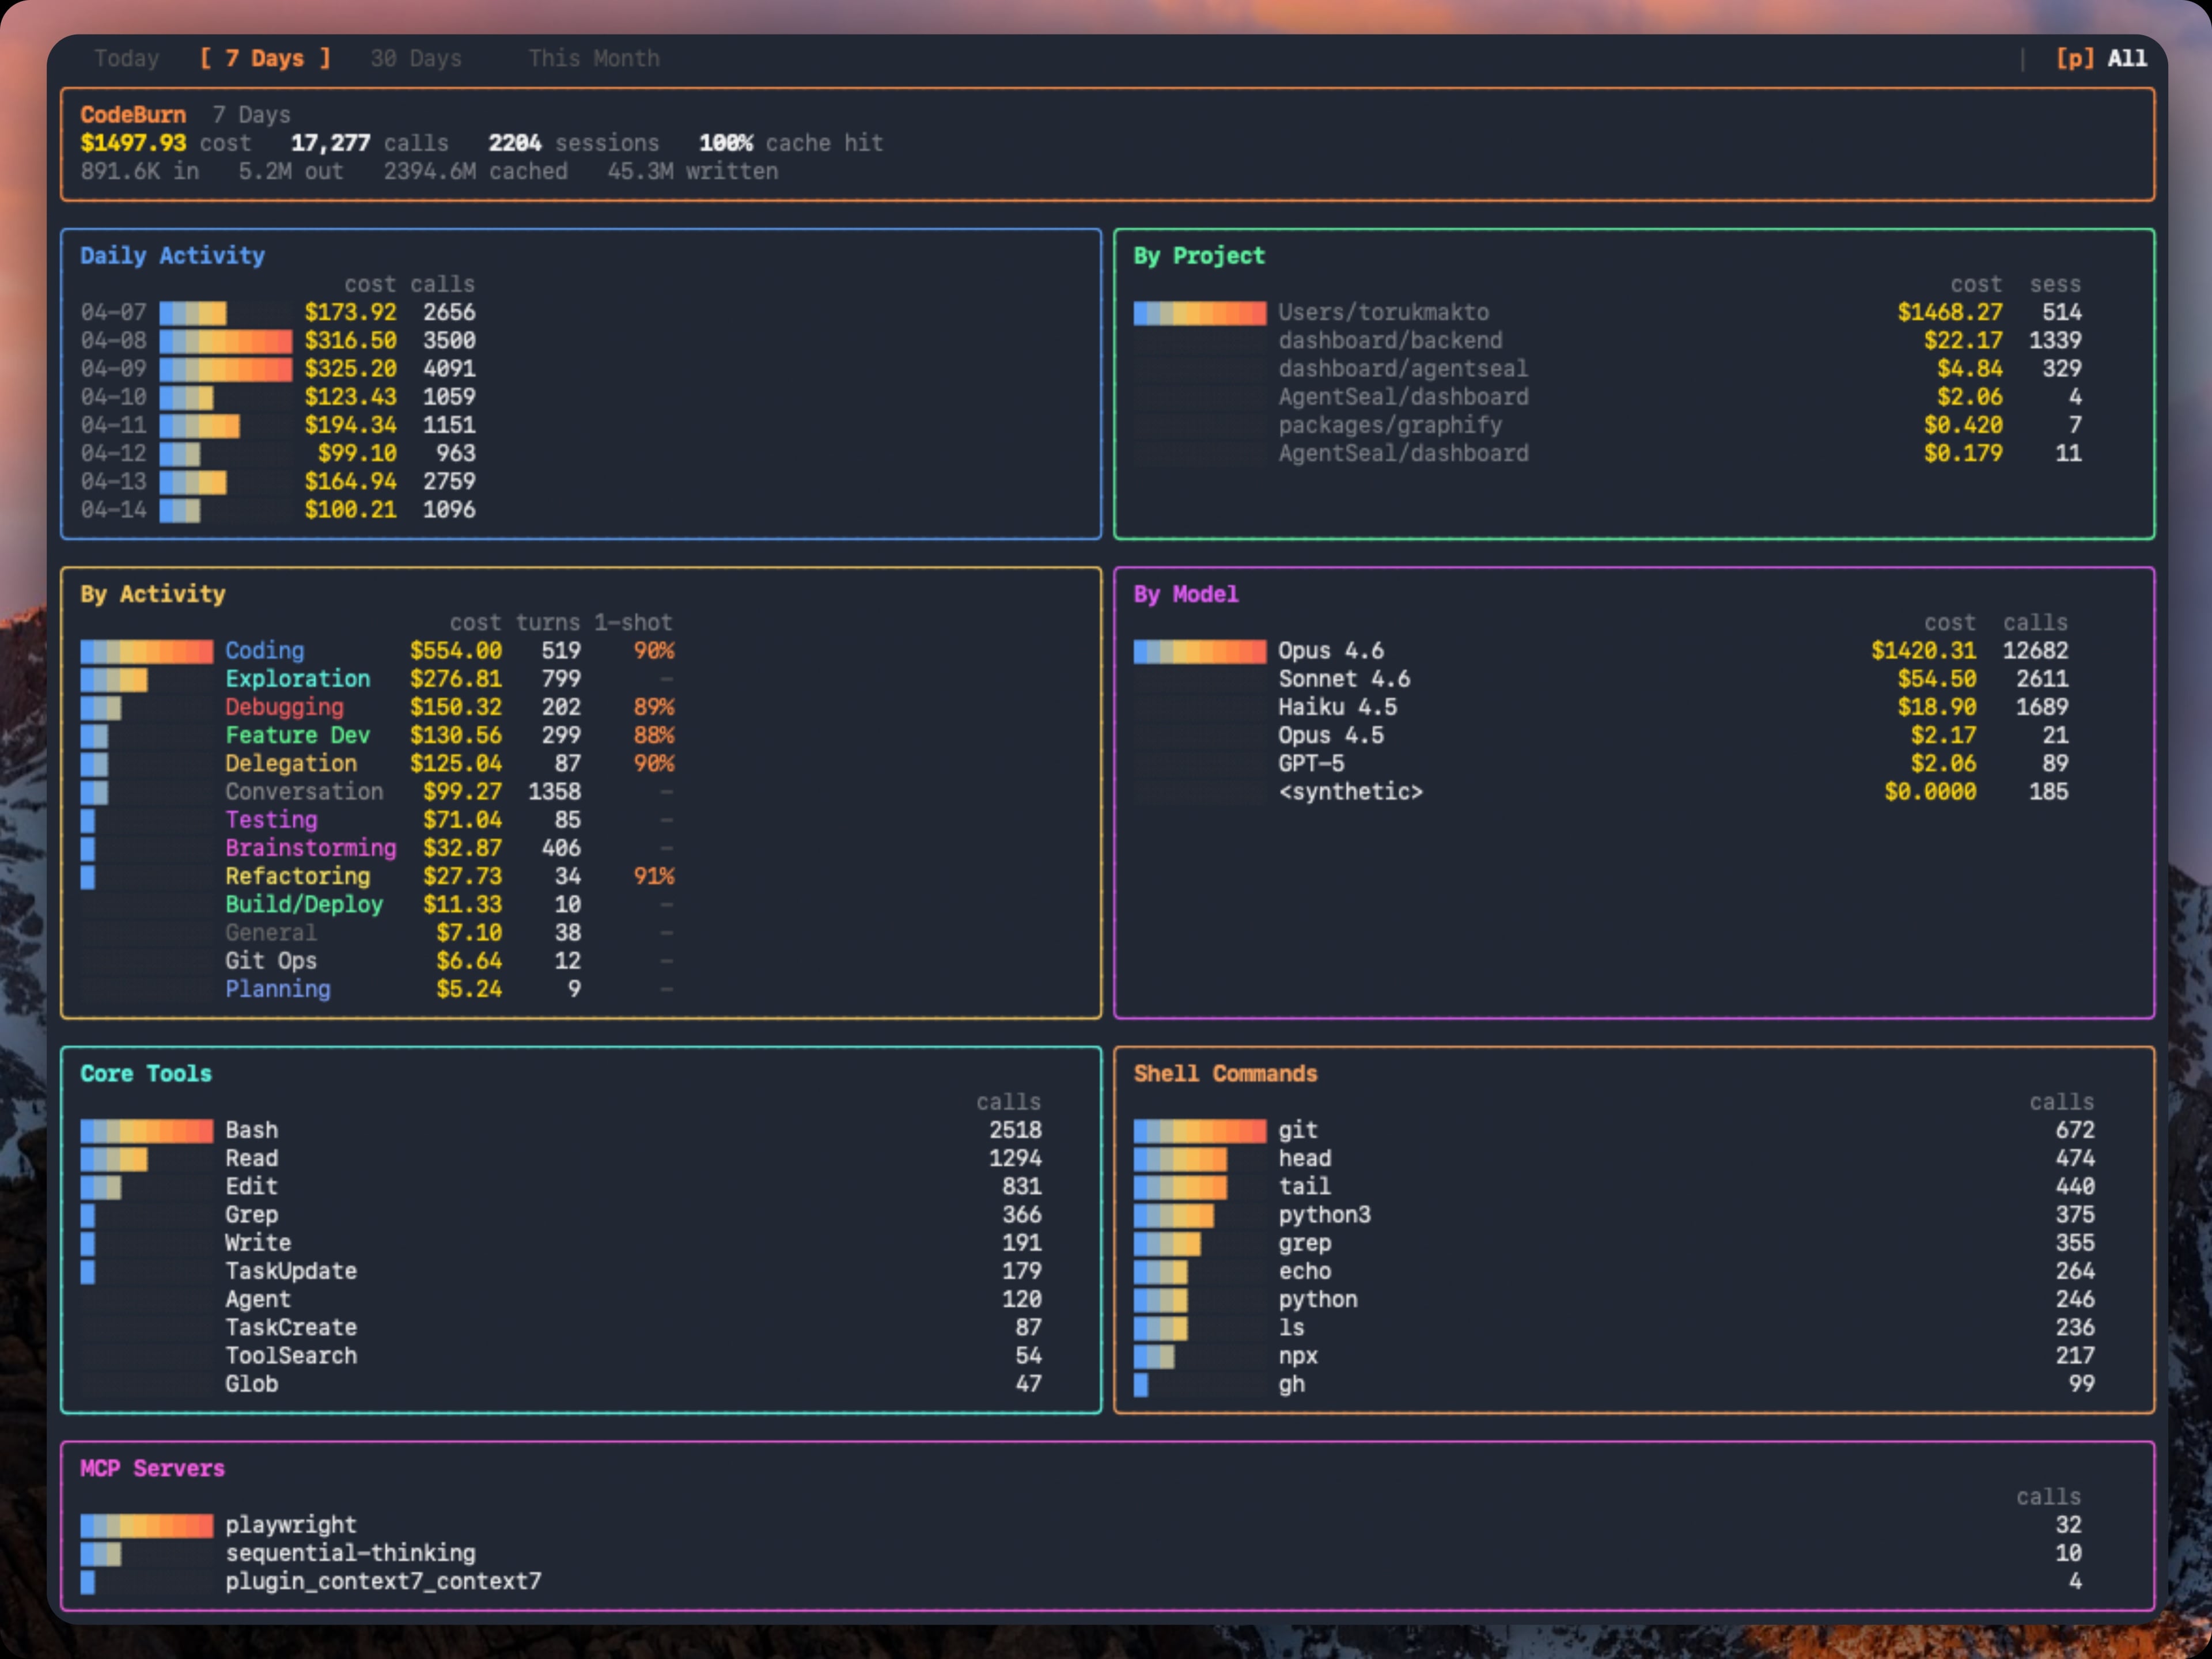
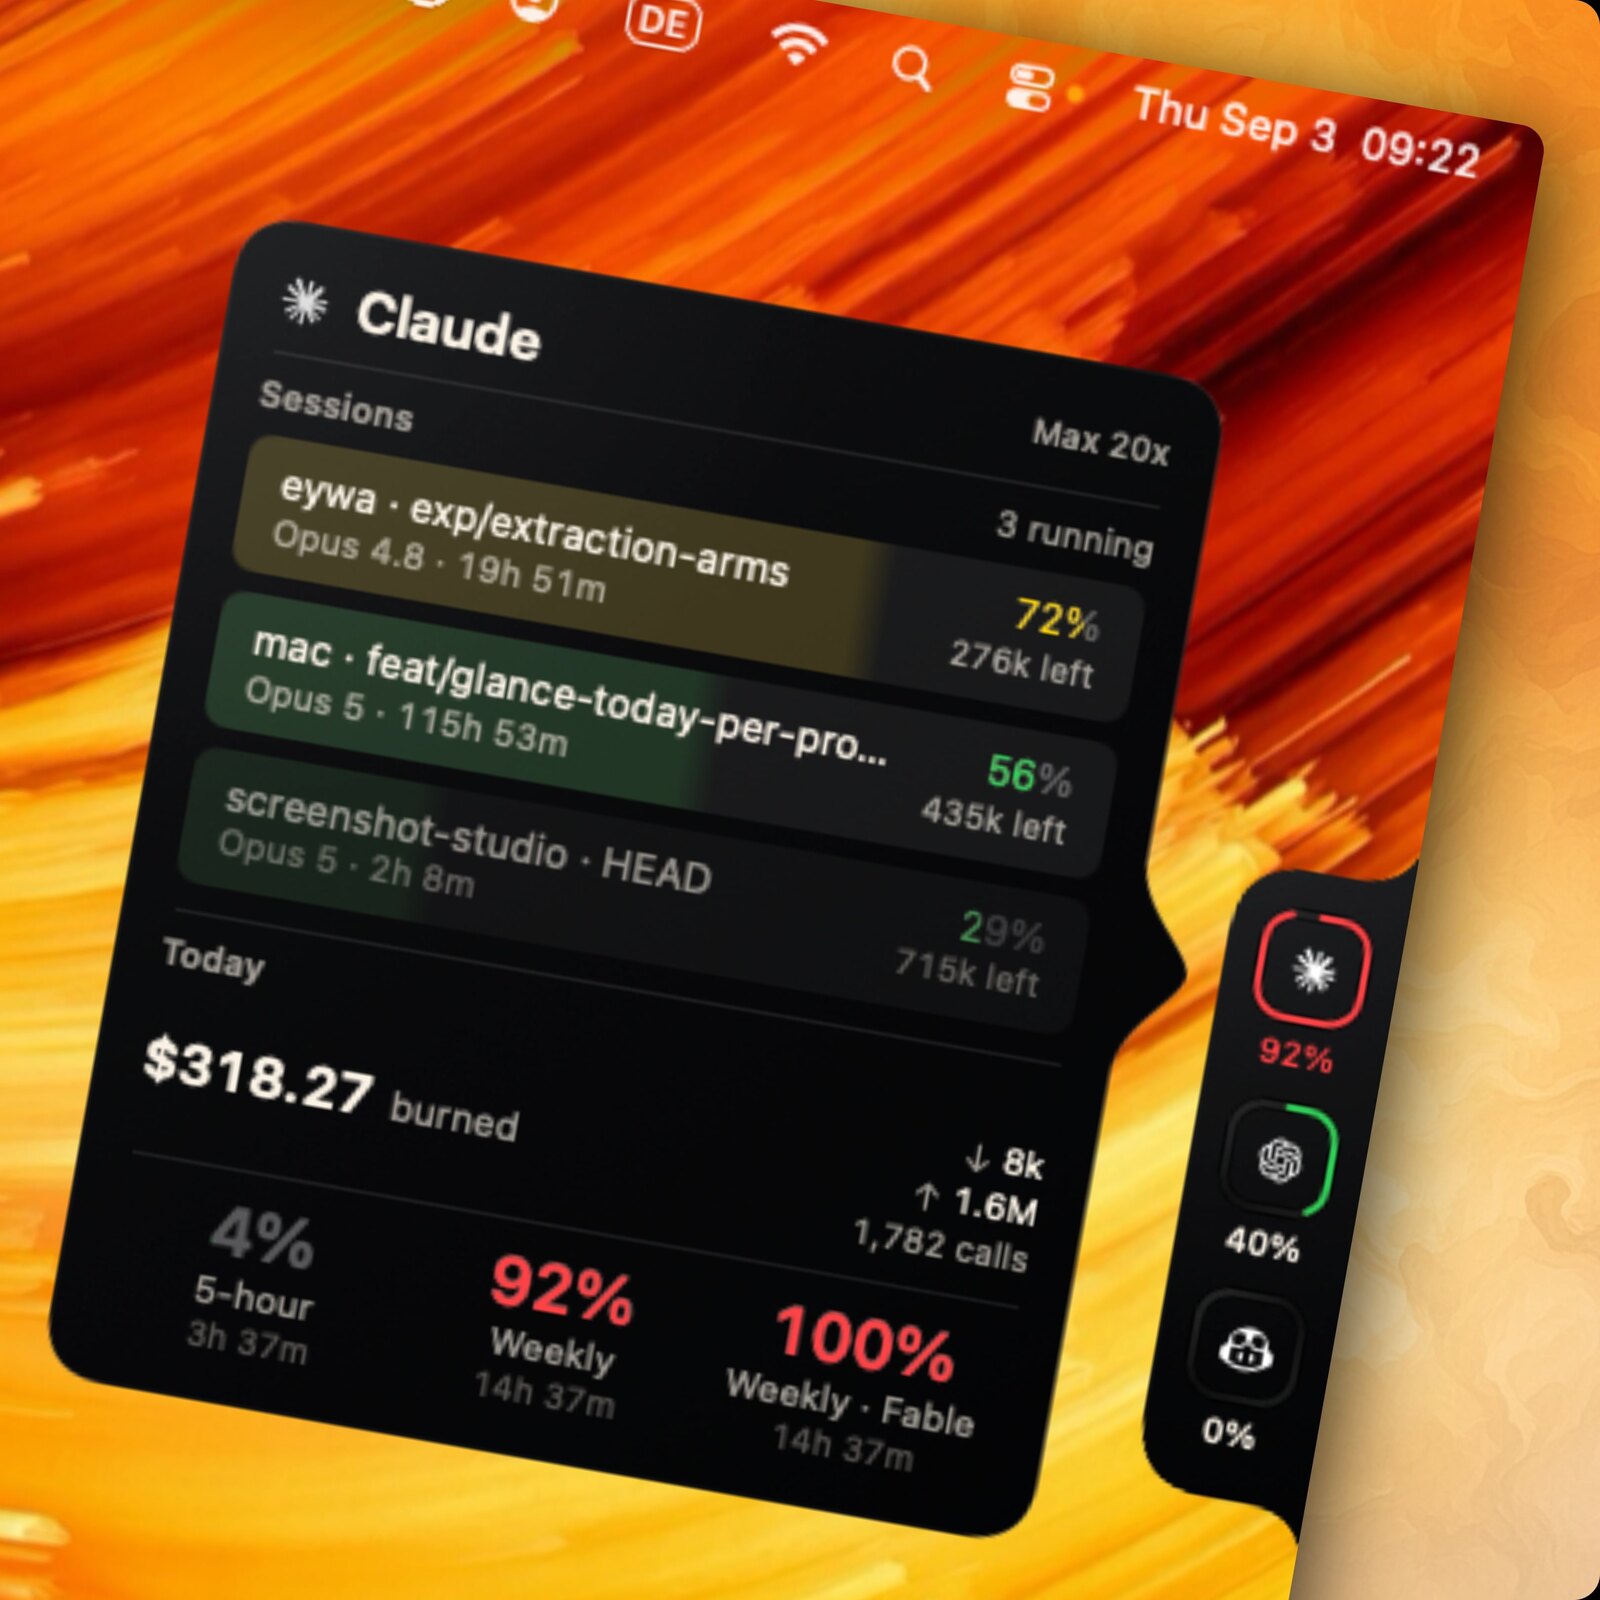
CodeBurn — это бесплатный open-source инструмент, который работает локально и отслеживает расход токенов и затраты на ИИ-кодинг в 41 инструменте и агенте — Claude Code, Cursor, Codex, Gemini, Grok и других — с разбивкой по модели, проекту и задаче.Это терминальная утилита, веб-приложение или десктопное приложение?И то, и другое, и третье — поверх одних и тех же локальных данных: интерактивная дашборд-панель в терминале (codeburn), локальный веб-дашборд с графиками (codeburn web) и приложение для строки меню, которое показывает ваши расходы в меню-баре macOS или в трее Windows.
И то, и другое, и третье — поверх одних и тех же локальных данных: интерактивная дашборд-панель в терминале (codeburn), локальный веб-дашборд с графиками (codeburn web) и приложение для строки меню, которое показывает ваши расходы в меню-баре macOS или в трее Windows.Как его запустить?Выполните 'npx codeburn' — работает сразу, без установки: откроется интерактивный дашборд с данными за сегодня по умолчанию (стрелки переключают периоды, q — выход). Чтобы команда была доступна постоянно, установите через 'brew install codeburn' на macOS или через bunx / pnpm dlx.
Выполните 'npx codeburn' — работает сразу, без установки: откроется интерактивный дашборд с данными за сегодня по умолчанию (стрелки переключают периоды, q — выход). Чтобы команда была доступна постоянно, установите через 'brew install codeburn' на macOS или через bunx / pnpm dlx.Что должно быть на компьютере, чтобы всё заработало?Node.js 22.13 или новее и хотя бы один поддерживаемый ИИ-инструмент, у которого данные сессий уже сохранены на диске. Для Cursor и OpenCode пакет better-sqlite3 установится автоматически.
Node.js 22.13 или новее и хотя бы один поддерживаемый ИИ-инструмент, у которого данные сессий уже сохранены на диске. Для Cursor и OpenCode пакет better-sqlite3 установится автоматически.Он подхватит любой ИИ-инструмент для кодинга, которым я пользуюсь, или только конкретные?Только 41 поддерживаемый инструмент, потому что CodeBurn читает файлы сессий, которые эти инструменты пишут на диск, — никакого прокси или обёртки нет. Инструмент, который не сохраняет локальные файлы сессий, отследить не получится.
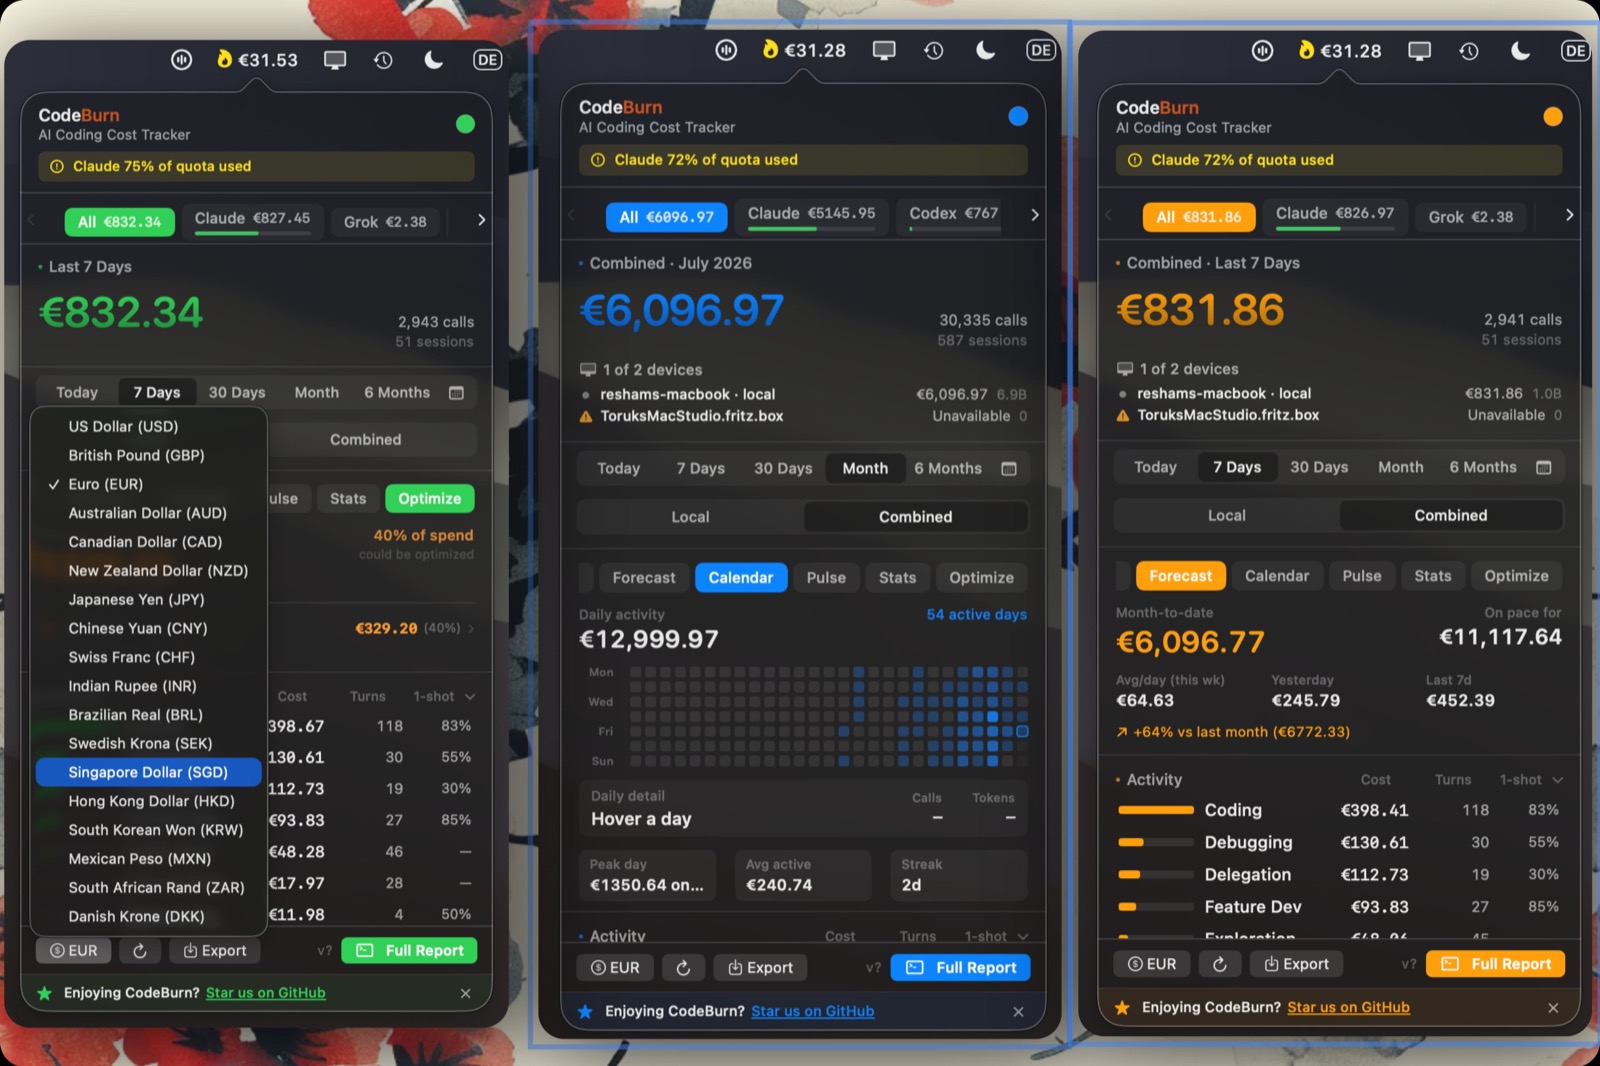
Только 41 поддерживаемый инструмент, потому что CodeBurn читает файлы сессий, которые эти инструменты пишут на диск, — никакого прокси или обёртки нет. Инструмент, который не сохраняет локальные файлы сессий, отследить не получится.Приложение для строки меню работает только на macOS?Нет: та же команда ставит приложение в трей на Windows, а в Linux есть расширение GNOME Shell для верхней панели. Версия для macOS — нативное приложение на Swift/SwiftUI: во всплывающем окне видны тренды, прогноз и экспорт в CSV/JSON, обновление каждые 30 секунд.
Нет: та же команда ставит приложение в трей на Windows, а в Linux есть расширение GNOME Shell для верхней панели. Версия для macOS — нативное приложение на Swift/SwiftUI: во всплывающем окне видны тренды, прогноз и экспорт в CSV/JSON, обновление каждые 30 секунд.Мои данные об использовании куда-то отправляются с компьютера?Нет — всё работает локально, без обёртки, прокси и API-ключей, а веб-сервер слушает только localhost. Объединение устройств происходит по вашей локальной сети с помощью PIN-кода; наружу уходит только анонимный агрегированный отчёт из десктопного приложения, и то лишь если вы сами это включите.
Нет — всё работает локально, без обёртки, прокси и API-ключей, а веб-сервер слушает только localhost. Объединение устройств происходит по вашей локальной сети с помощью PIN-кода; наружу уходит только анонимный агрегированный отчёт из десктопного приложения, и то лишь если вы сами это включите.Он поможет мне реально сократить лишние траты, а не просто показать их?Да. Команда 'codeburn optimize' сканирует ваши сессии и настройки в ~/.claude/ на предмет лишних расходов — повторно прочитанные файлы, неиспользуемые MCP-серверы, раздутый CLAUDE.md — ранжирует находки по срочности с оценкой экономии и сводит всё в оценку здоровья от A до F. Флаг '--apply' исправляет проблемы в конфигурации с резервной копией и журналом изменений, а 'codeburn act undo' в любой момент всё откатывает.
Да. Команда 'codeburn optimize' сканирует ваши сессии и настройки в ~/.claude/ на предмет лишних расходов — повторно прочитанные файлы, неиспользуемые MCP-серверы, раздутый CLAUDE.md — ранжирует находки по срочности с оценкой экономии и сводит всё в оценку здоровья от A до F. Флаг '--apply' исправляет проблемы в конфигурации с резервной копией и журналом изменений, а 'codeburn act undo' в любой момент всё откатывает.Может ли он остановить сессию, которая тратит больше, чем я планировал?Опциональные хуки Guard для Claude Code следят за стоимостью сессии прямо во время работы: мягкий лимит (по умолчанию $5) предупреждает вас внутри сессии, жёсткий лимит (по умолчанию $15) останавливает сессию, пока вы его не снимете, а контрольная точка в $3 напоминает, если сессия закончилась без правок и коммитов. Хуки «fail open»: если guard сломается, ваша работе это не помешает.
Опциональные хуки Guard для Claude Code следят за стоимостью сессии прямо во время работы: мягкий лимит (по умолчанию $5) предупреждает вас внутри сессии, жёсткий лимит (по умолчанию $15) останавливает сессию, пока вы его не снимете, а контрольная точка в $3 напоминает, если сессия закончилась без правок и коммитов. Хуки «fail open»: если guard сломается, ваша работе это не помешает.Может ли он подсказать, какая модель реально лучше подходит для моих задач?Нажмите c в дашборде или выполните 'codeburn compare', чтобы увидеть модели рядом: доля успешных ответов с первого раза, доля повторных попыток, самоисправление, стоимость за вызов и за правку, количество токенов вывода за вызов и процент попаданий в кэш — за выбранный период.
Нажмите c в дашборде или выполните 'codeburn compare', чтобы увидеть модели рядом: доля успешных ответов с первого раза, доля повторных попыток, самоисправление, стоимость за вызов и за правку, количество токенов вывода за вызов и процент попаданий в кэш — за выбранный период.Он понимает, ушла ли потраченная сумма на реальный код?Команда 'codeburn yield' сопоставляет ИИ-сессии с git-коммитами по времени и помечает каждую сессию как Productive, Reverted, Abandoned или Ambiguous. Привязка эвристическая (на основе временного окна) и требует запуска внутри git-репозитория.
Команда 'codeburn yield' сопоставляет ИИ-сессии с git-коммитами по времени и помечает каждую сессию как Productive, Reverted, Abandoned или Ambiguous. Привязка эвристическая (на основе временного окна) и требует запуска внутри git-репозитория.What are similar projects?tokscale, cost-xray, casbin-gateway, ThinkWatch-Lite, AgentMeasure, tare, headroom, agentsview
tokscale, cost-xray, casbin-gateway, ThinkWatch-Lite, AgentMeasure, tare, headroom, agentsviewWhich topics is it in?gnome, terminal-ui, cost-tracking, menubar, token-usage, ai-coding, analytics, observability, swift, dashboard, monitoring, local-first
gnome, terminal-ui, cost-tracking, menubar, token-usage, ai-coding, analytics, observability, swift, dashboard, monitoring, local-first