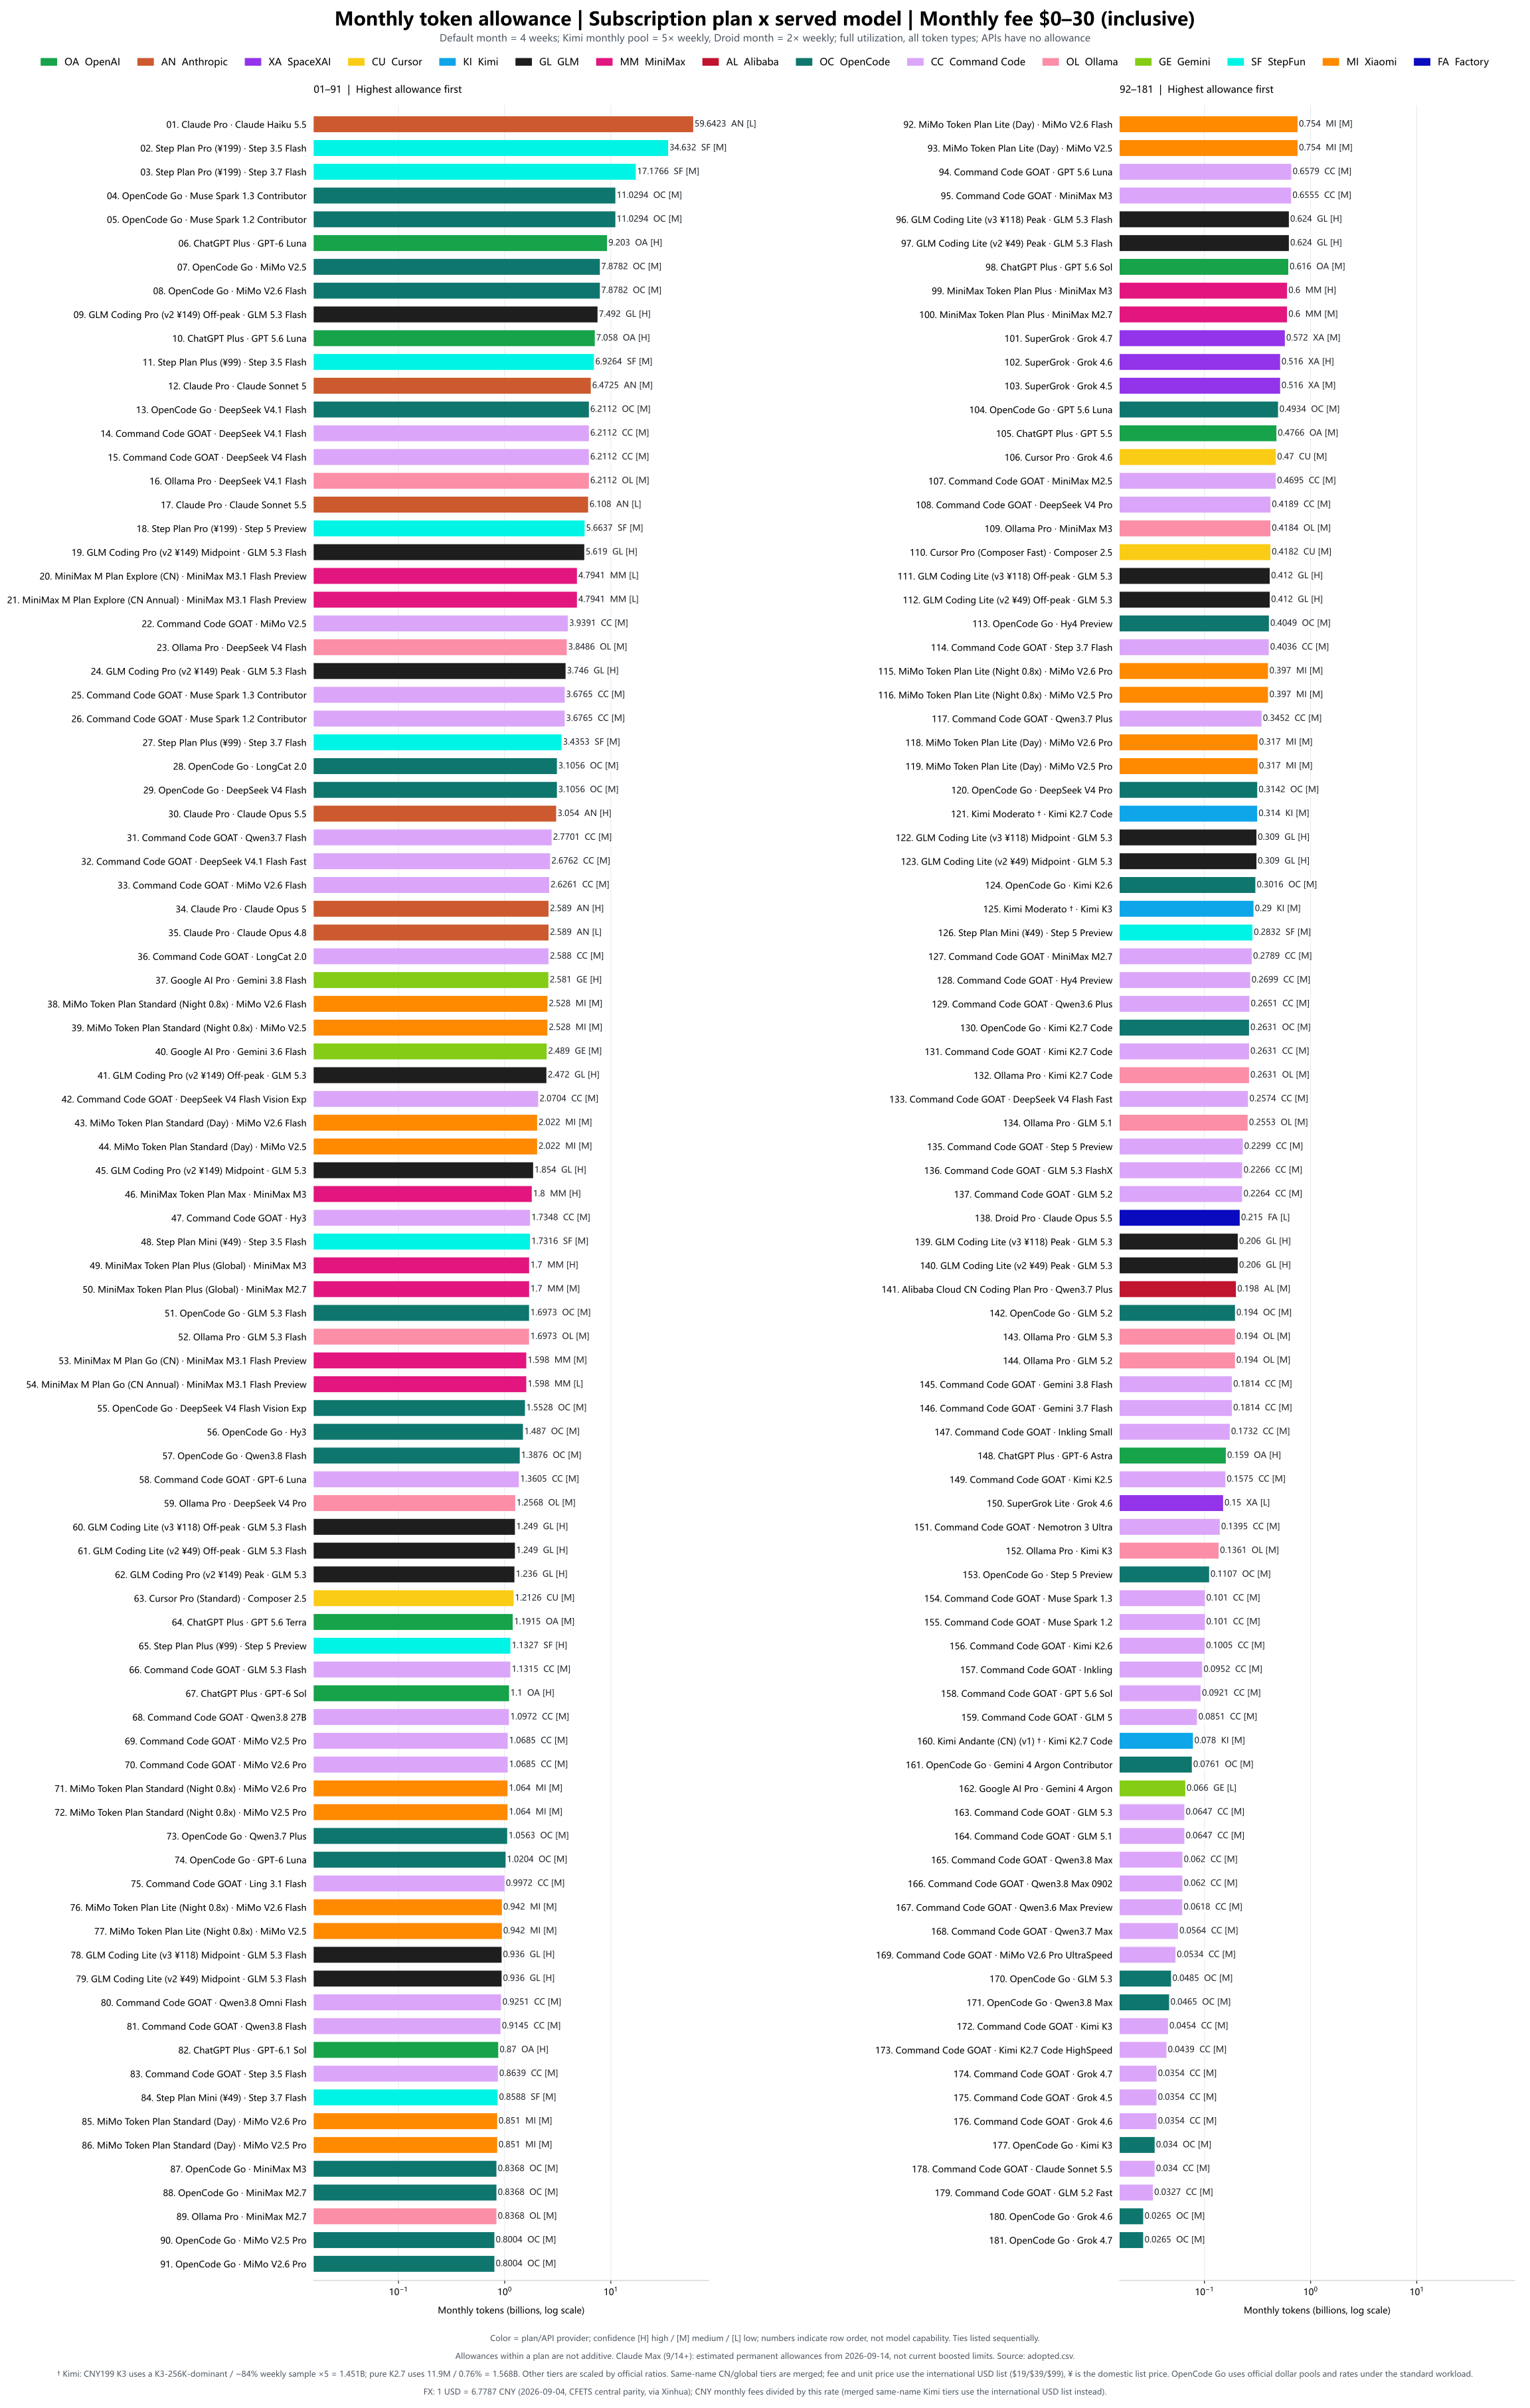
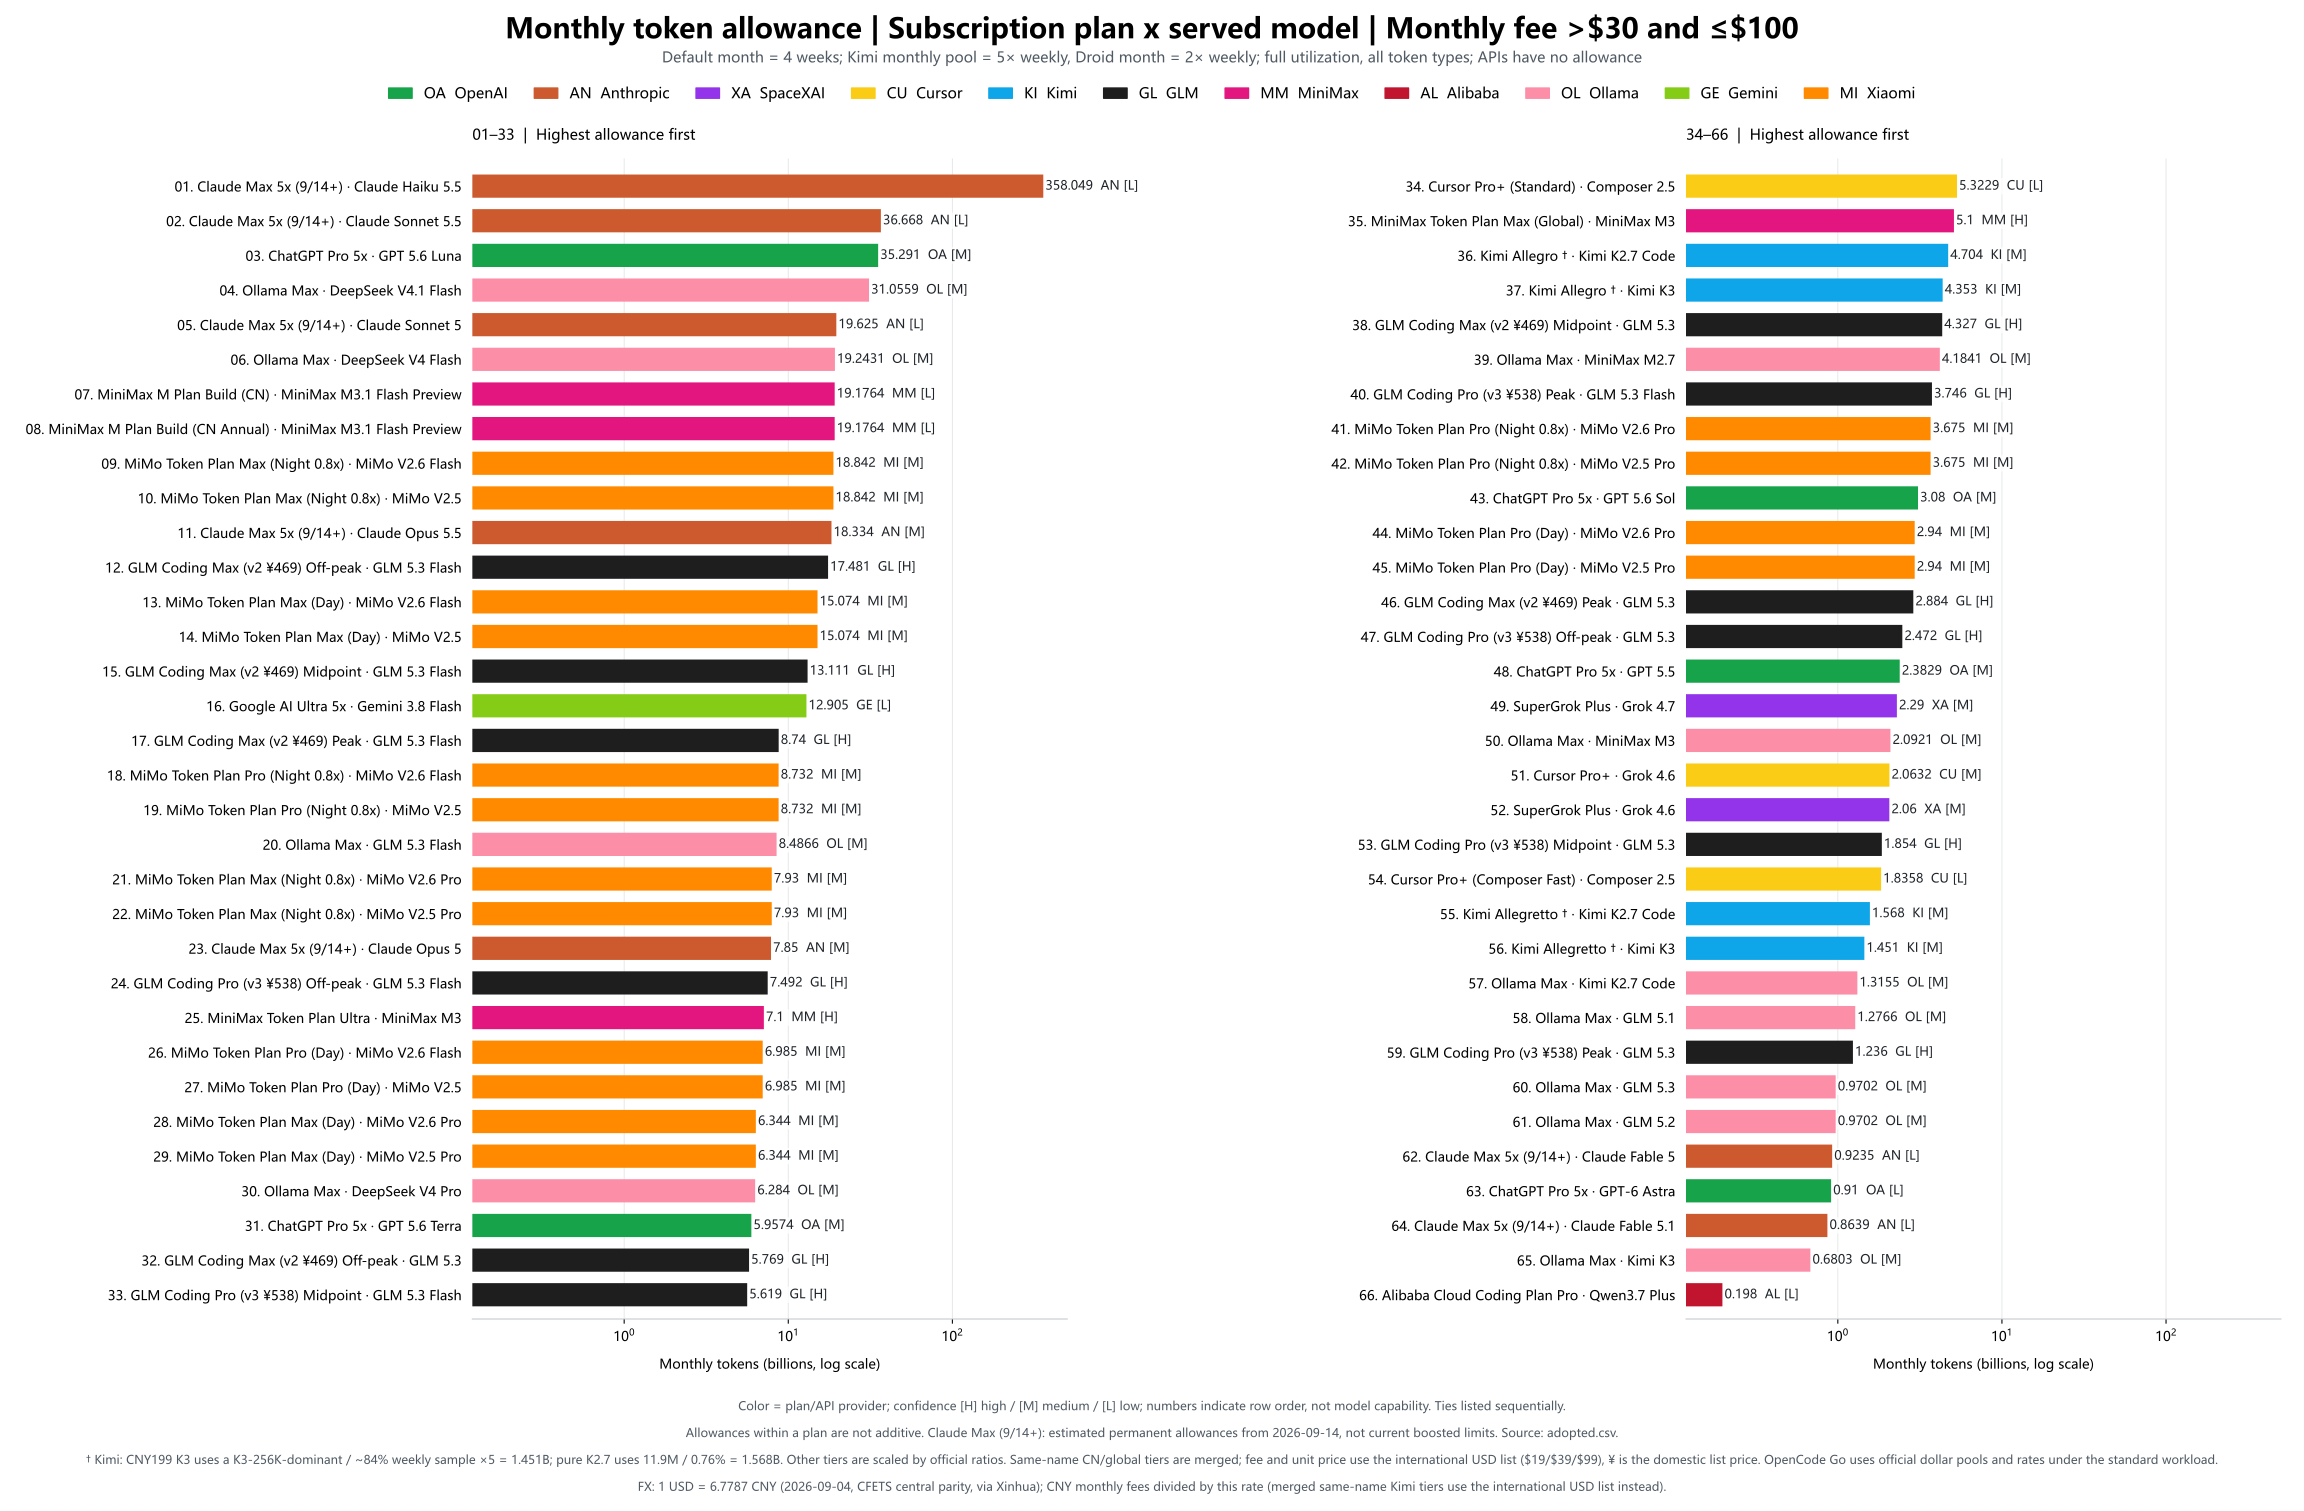
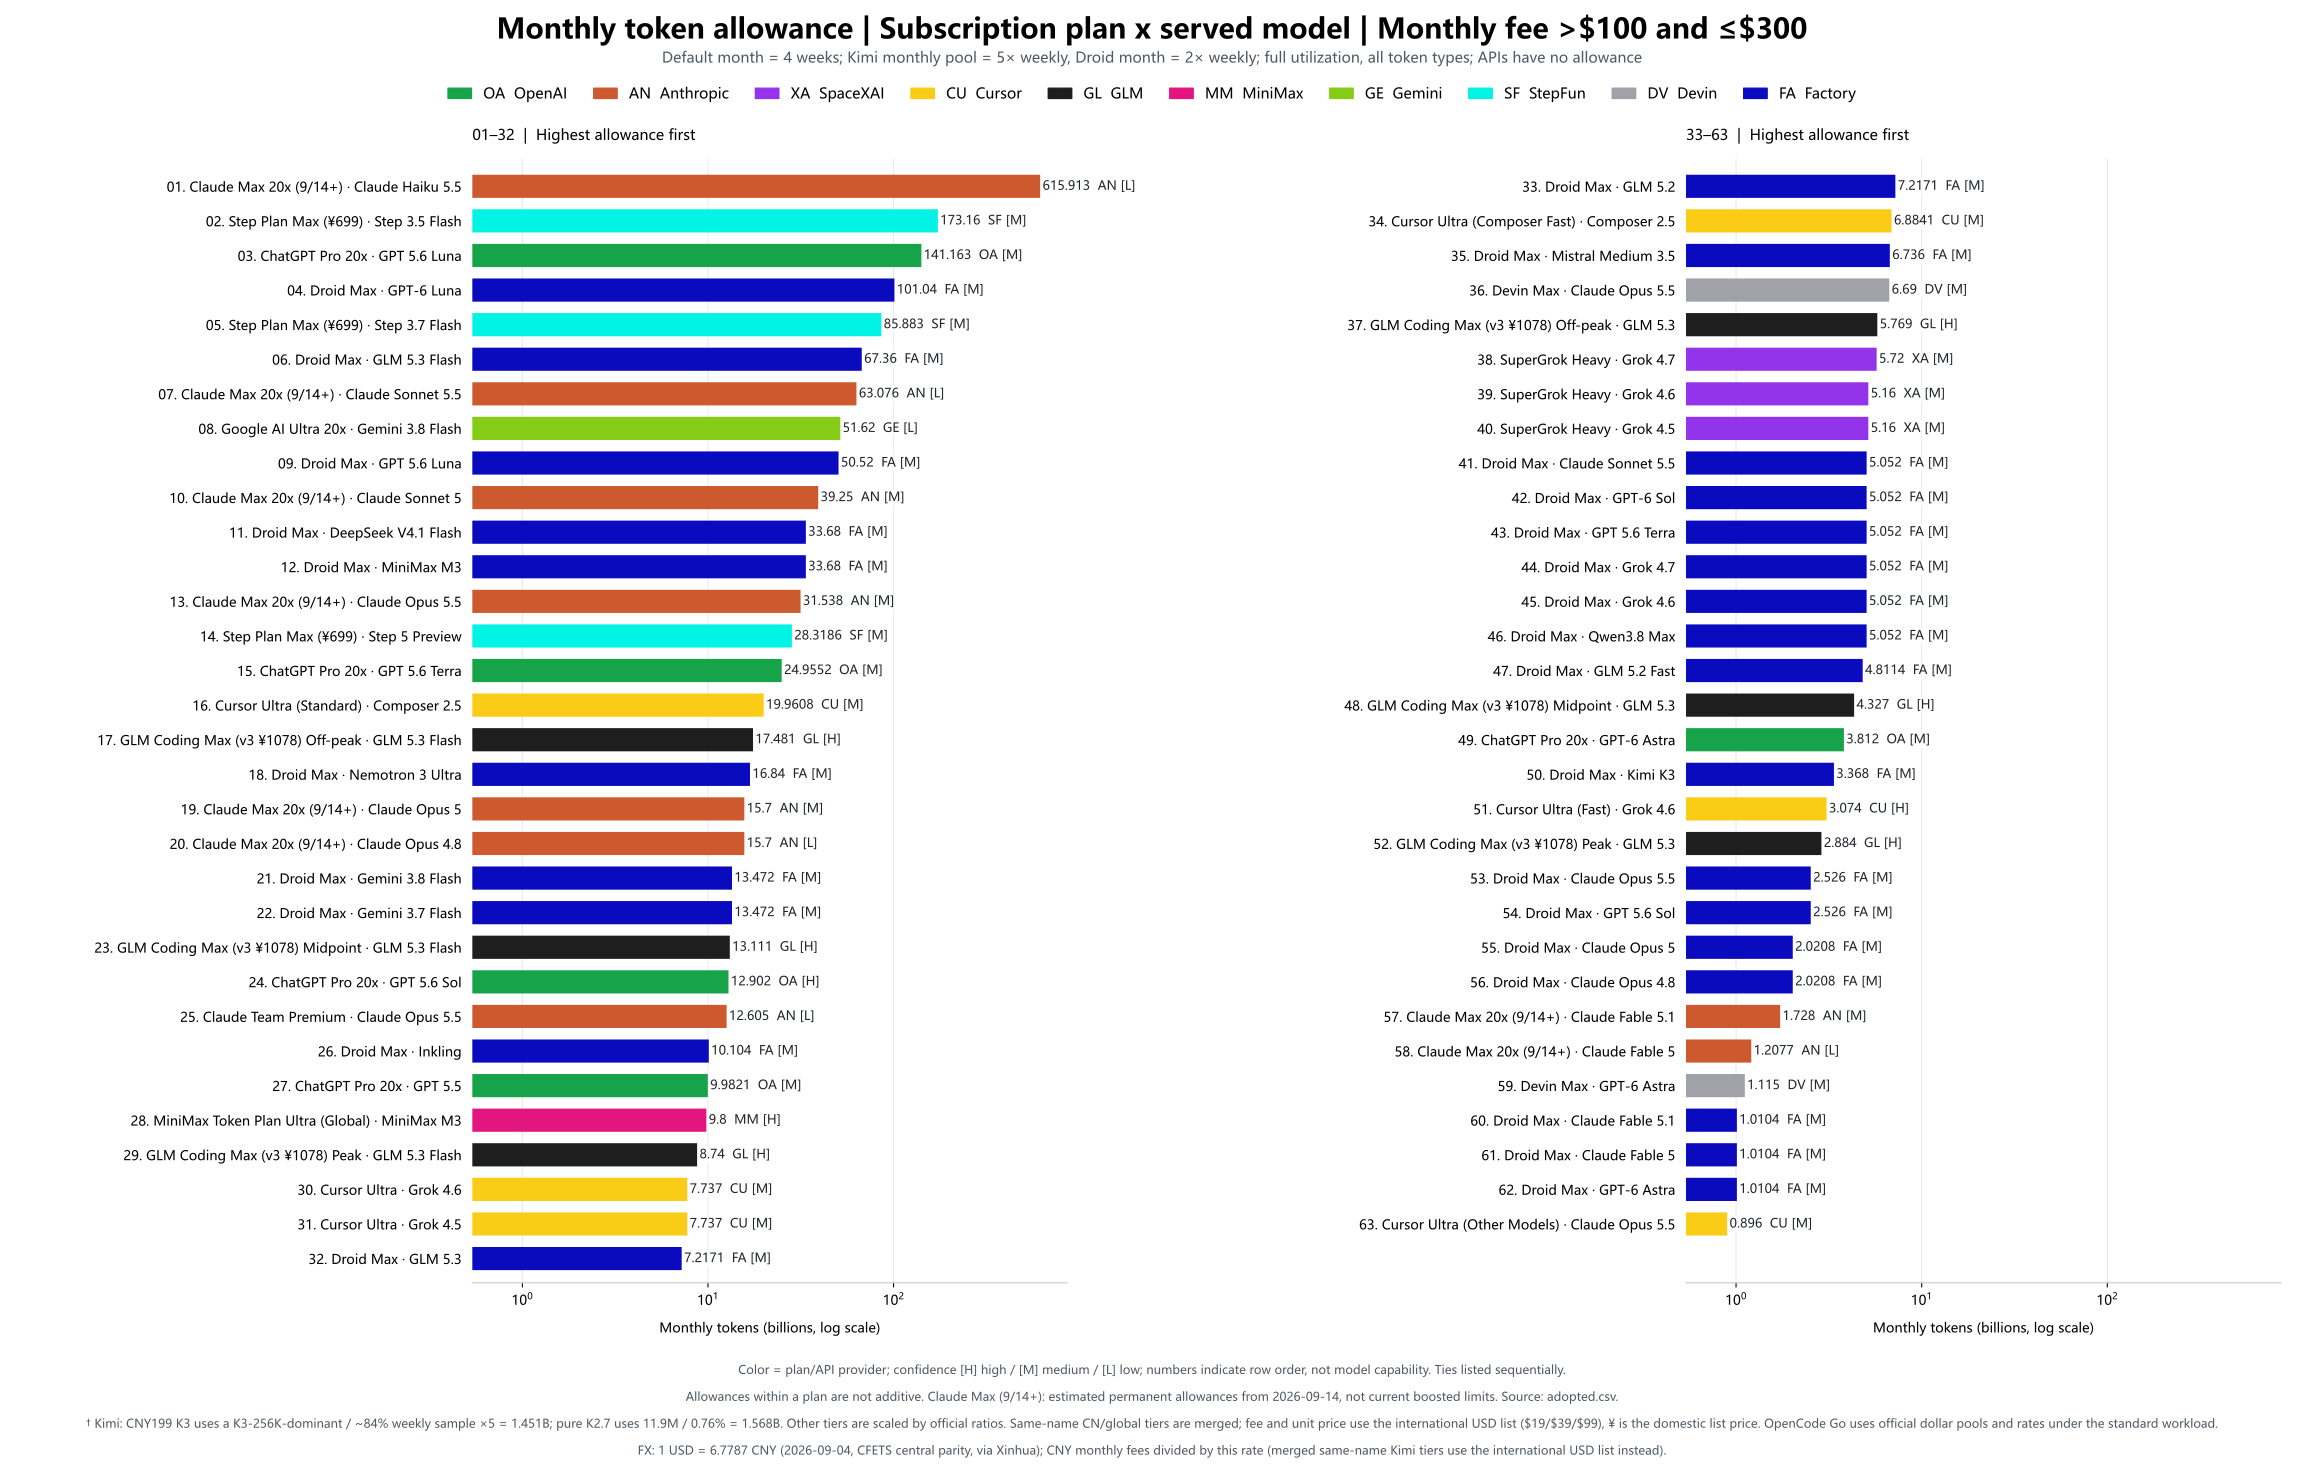
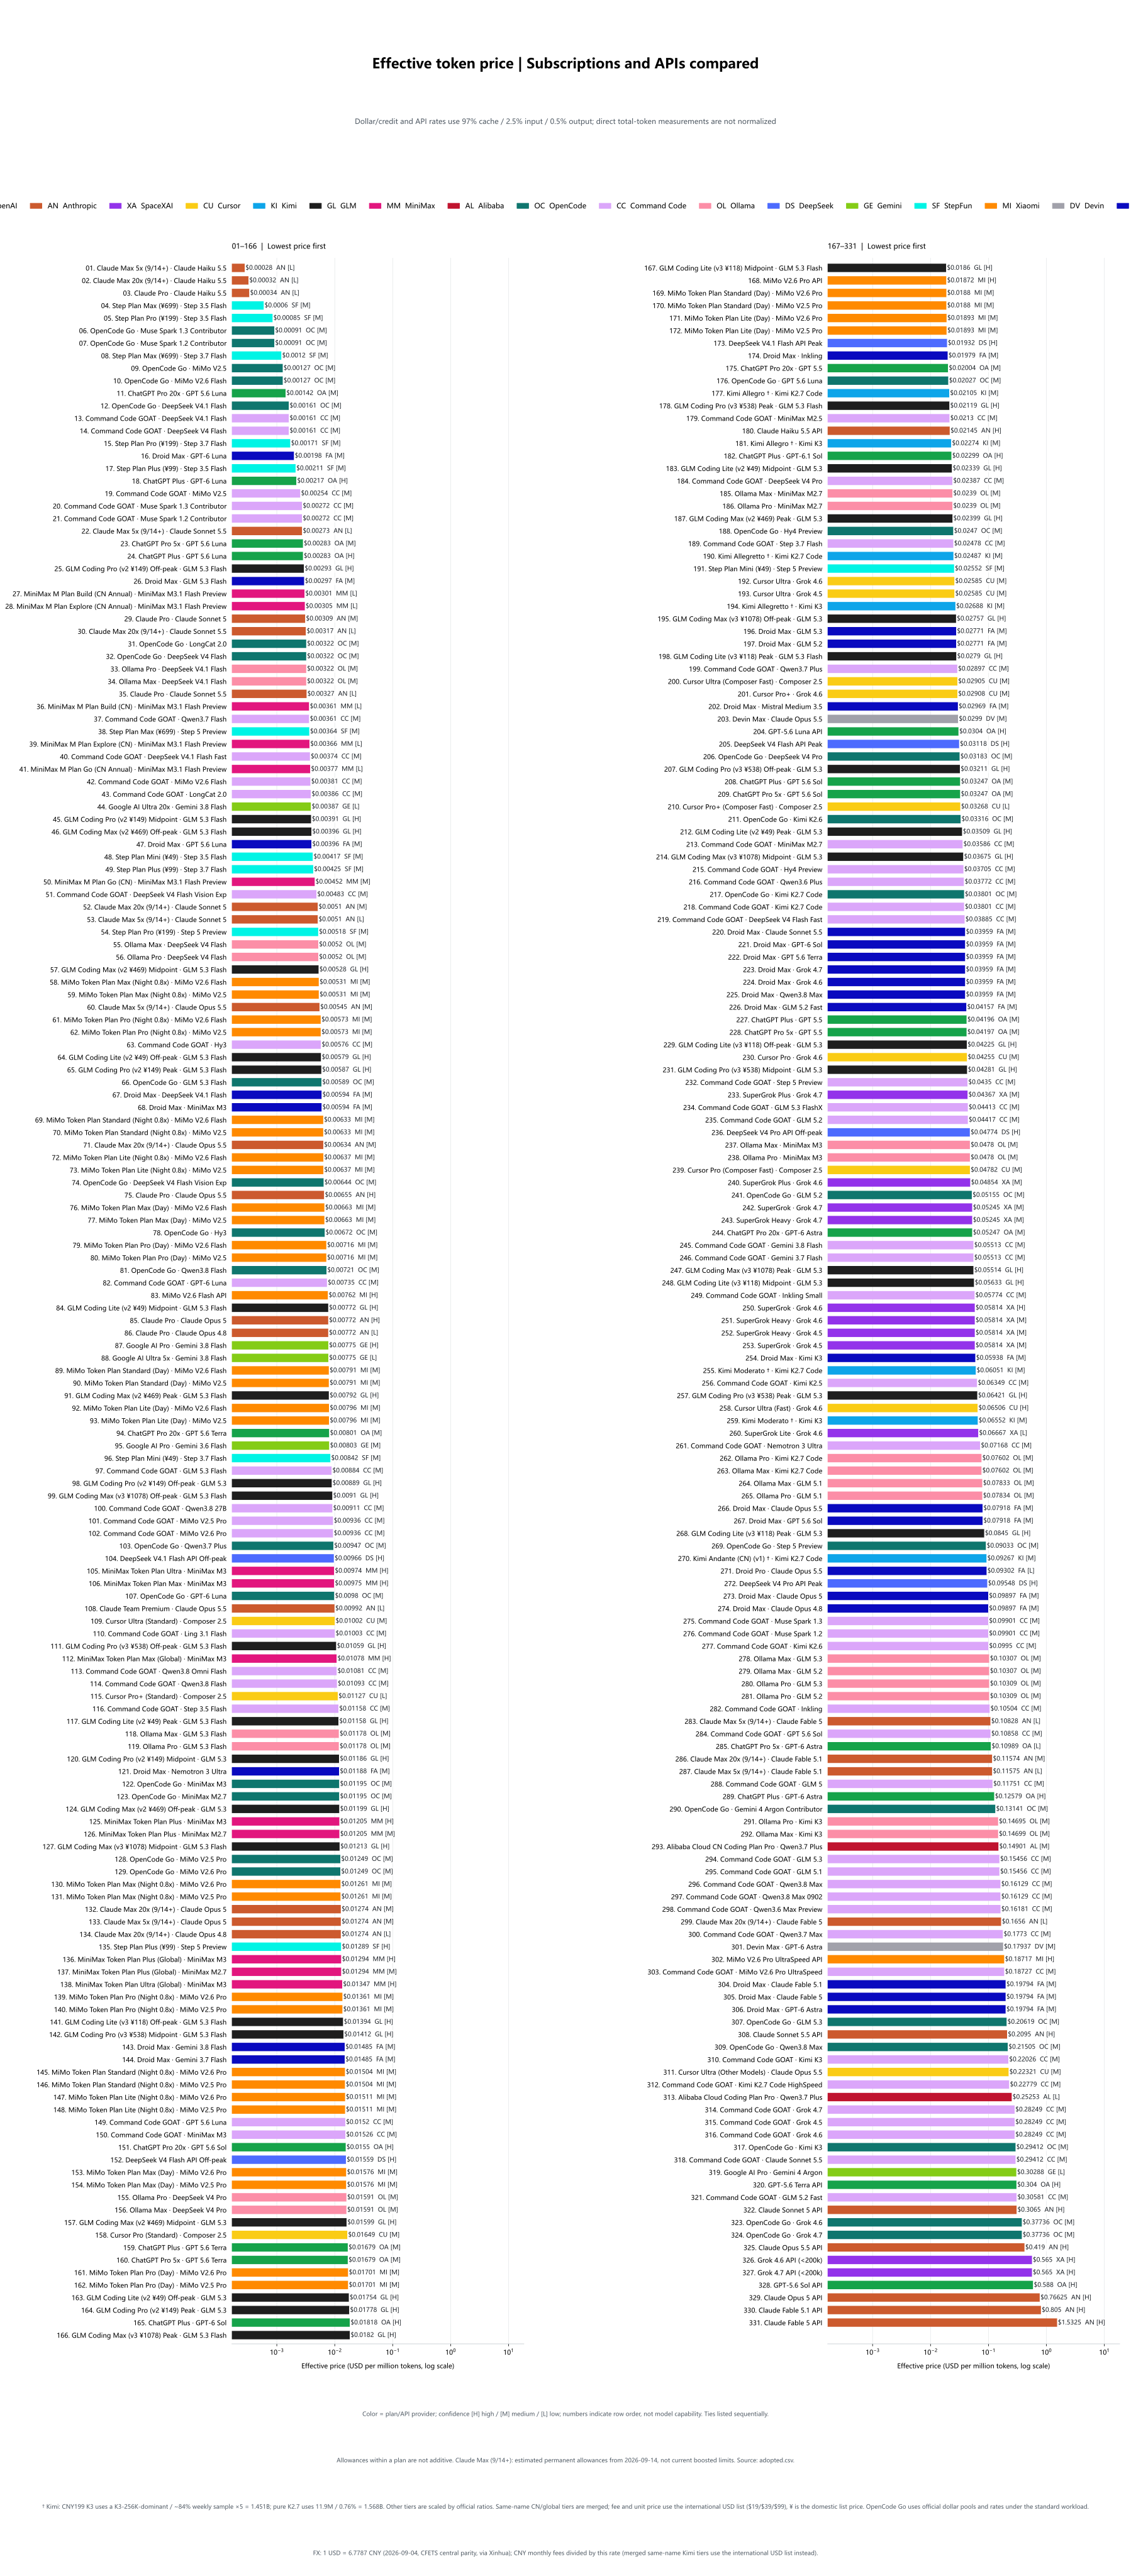
What is this?
 It is a data and chart project that computes the real price of AI subscription plans by dividing the monthly fee by the actual usable tokens, then plots those real unit prices against coding/agent leaderboard scores as Pareto frontier charts.
It is a data and chart project that computes the real price of AI subscription plans by dividing the monthly fee by the actual usable tokens, then plots those real unit prices against coding/agent leaderboard scores as Pareto frontier charts.Is this an app I install, or just a set of charts and data?It is a static website plus downloadable charts and tables — you browse the interactive site or grab the SVG/PNG charts and CSV/JSON data directly, there is no software to install.
It is a static website plus downloadable charts and tables — you browse the interactive site or grab the SVG/PNG charts and CSV/JSON data directly, there is no software to install.How do I actually use this?Open the interactive website to compare models, prices and allowances, or download the English/Chinese SVG and PNG charts and the CSV/JSON tables straight from the repo.
Open the interactive website to compare models, prices and allowances, or download the English/Chinese SVG and PNG charts and the CSV/JSON tables straight from the repo.Do I need anything to regenerate the charts myself?Chart regeneration is done with a Node script (node scripts/render_svg.cjs) using the 'sharp' package; the repo also contains Python tooling, but just viewing the published charts needs nothing.
Chart regeneration is done with a Node script (node scripts/render_svg.cjs) using the 'sharp' package; the repo also contains Python tooling, but just viewing the published charts needs nothing.How accurate are these price comparisons?Many figures are not official numbers but conversions under one standardized workload assumption (mostly cache reads with a small input/output split), and some leaderboard scores are reference harness configurations rather than verified per-channel measurements.
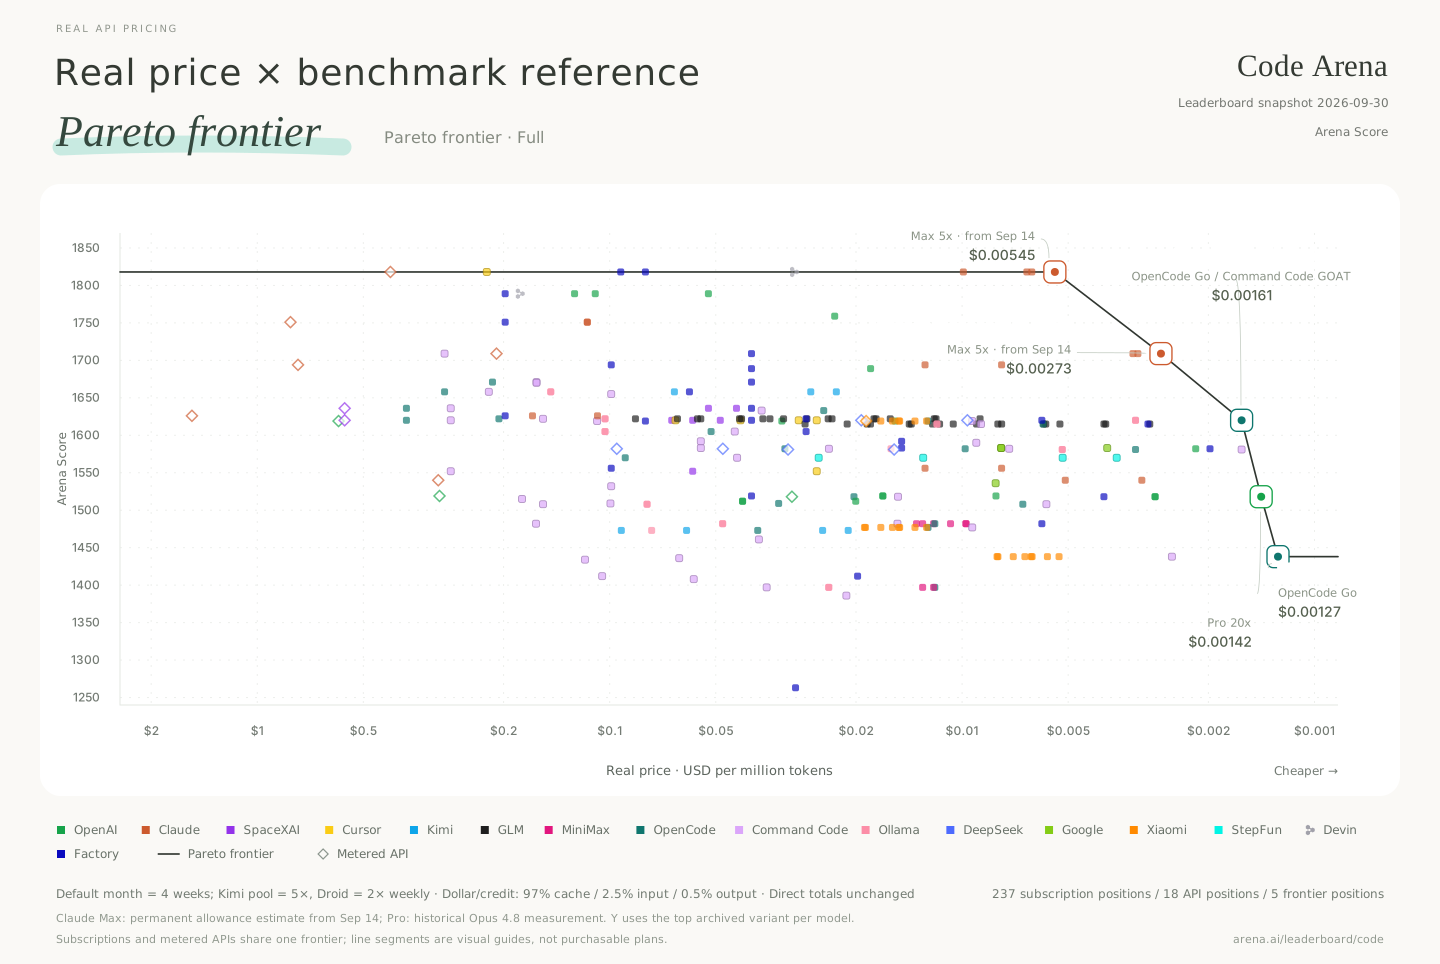
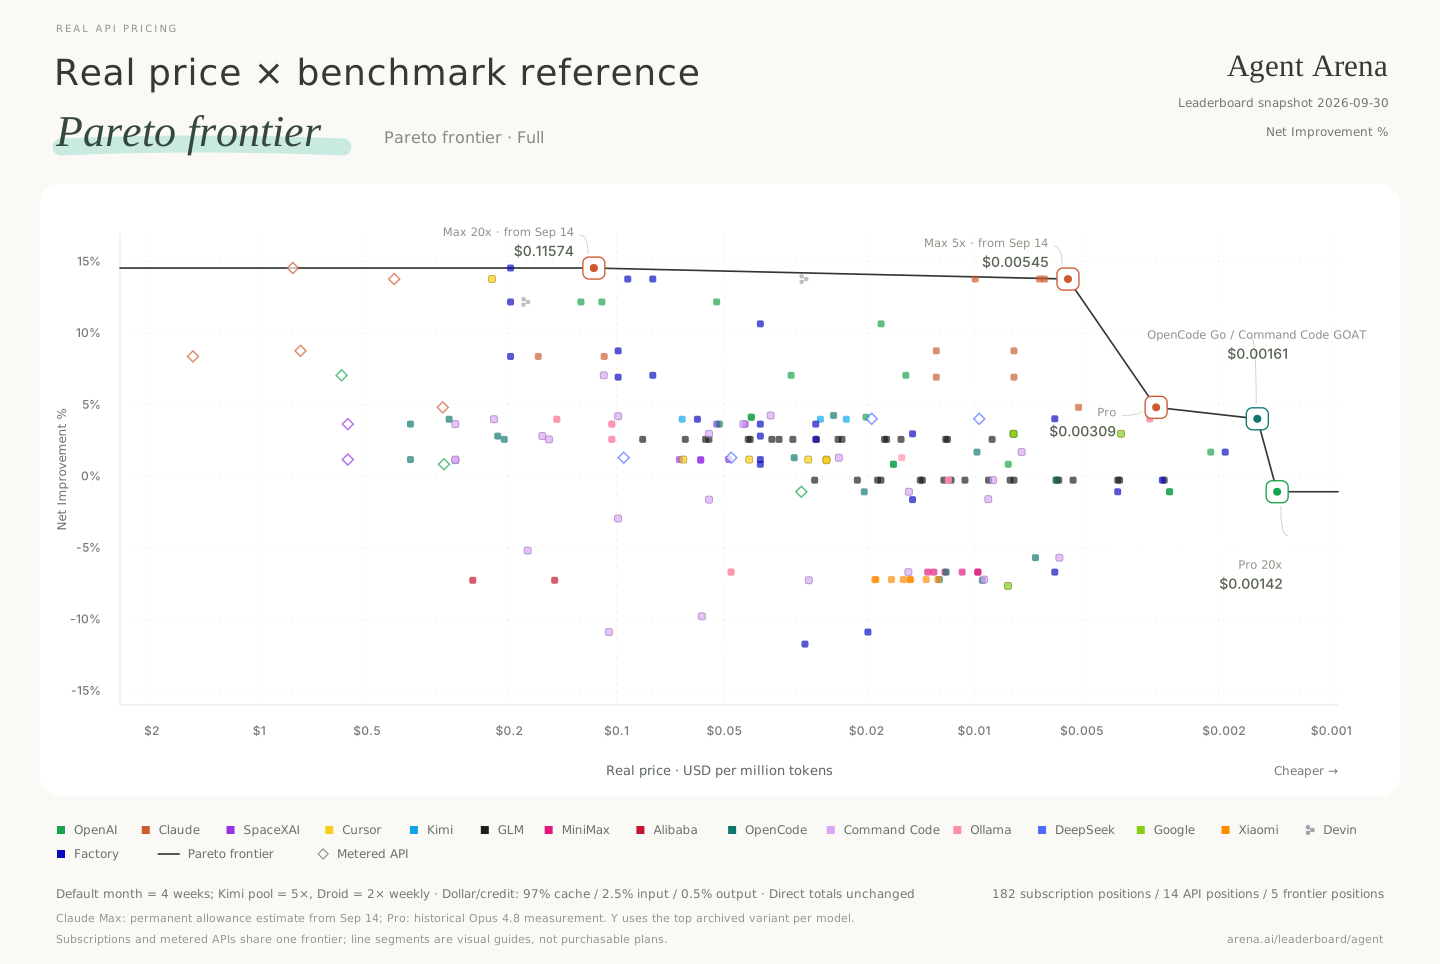
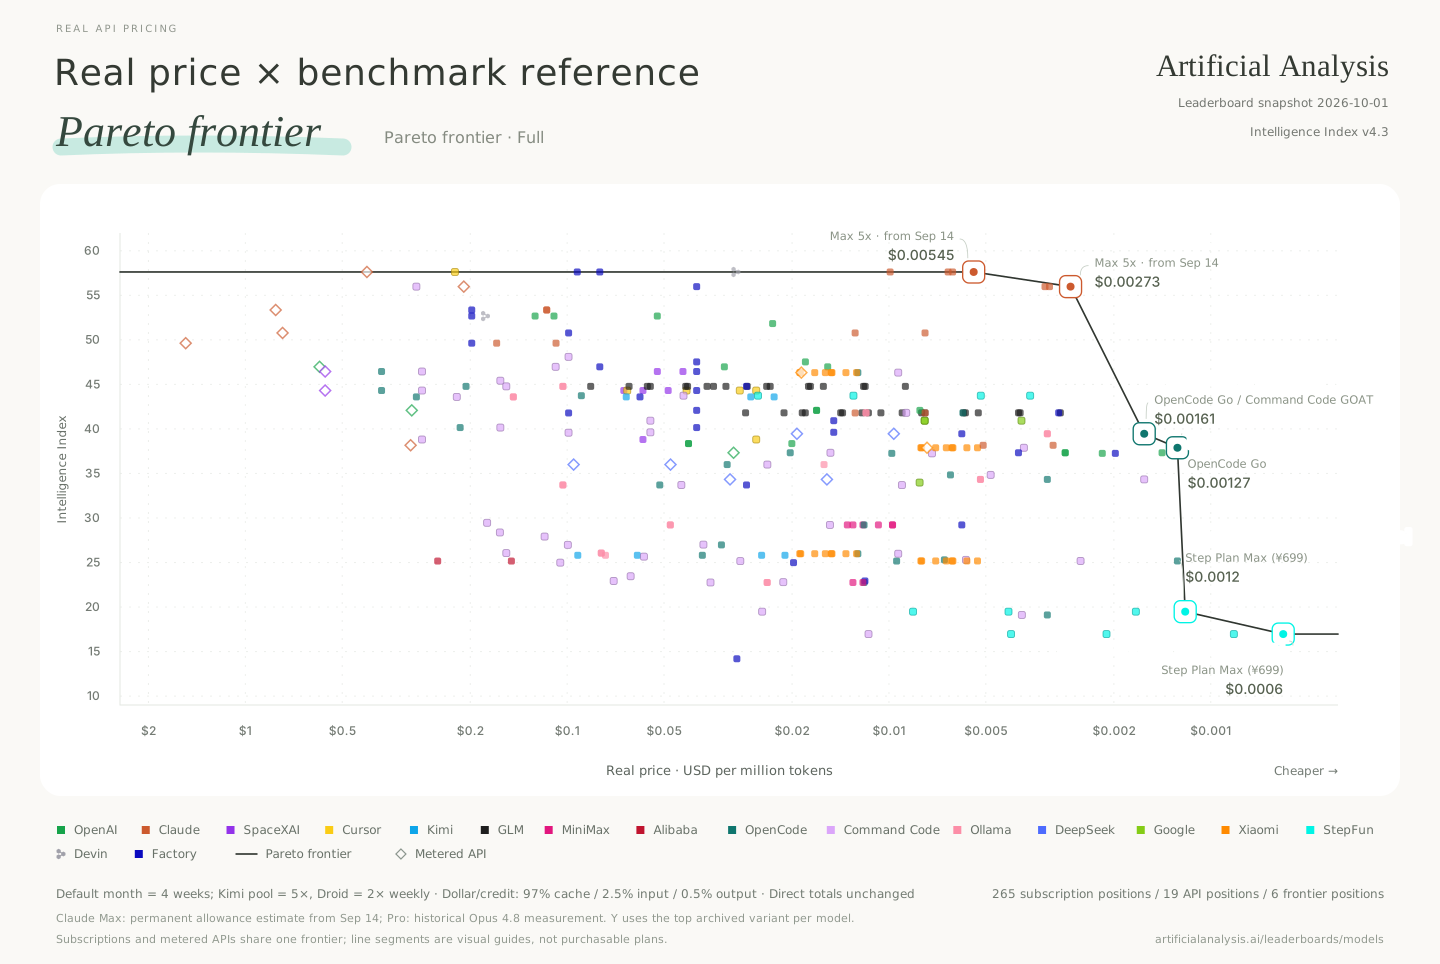
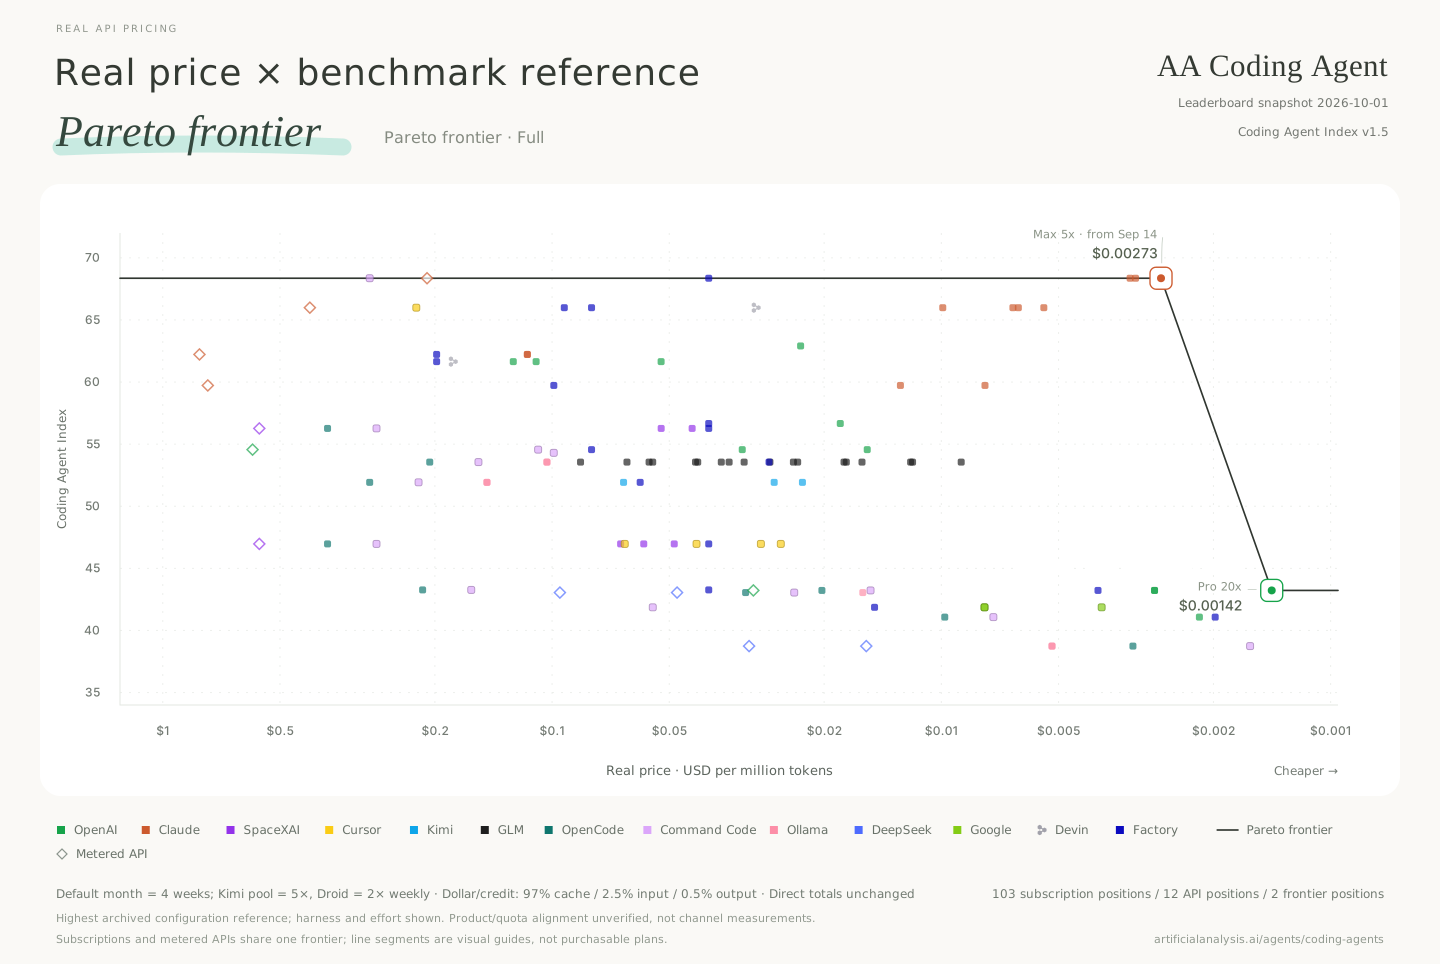
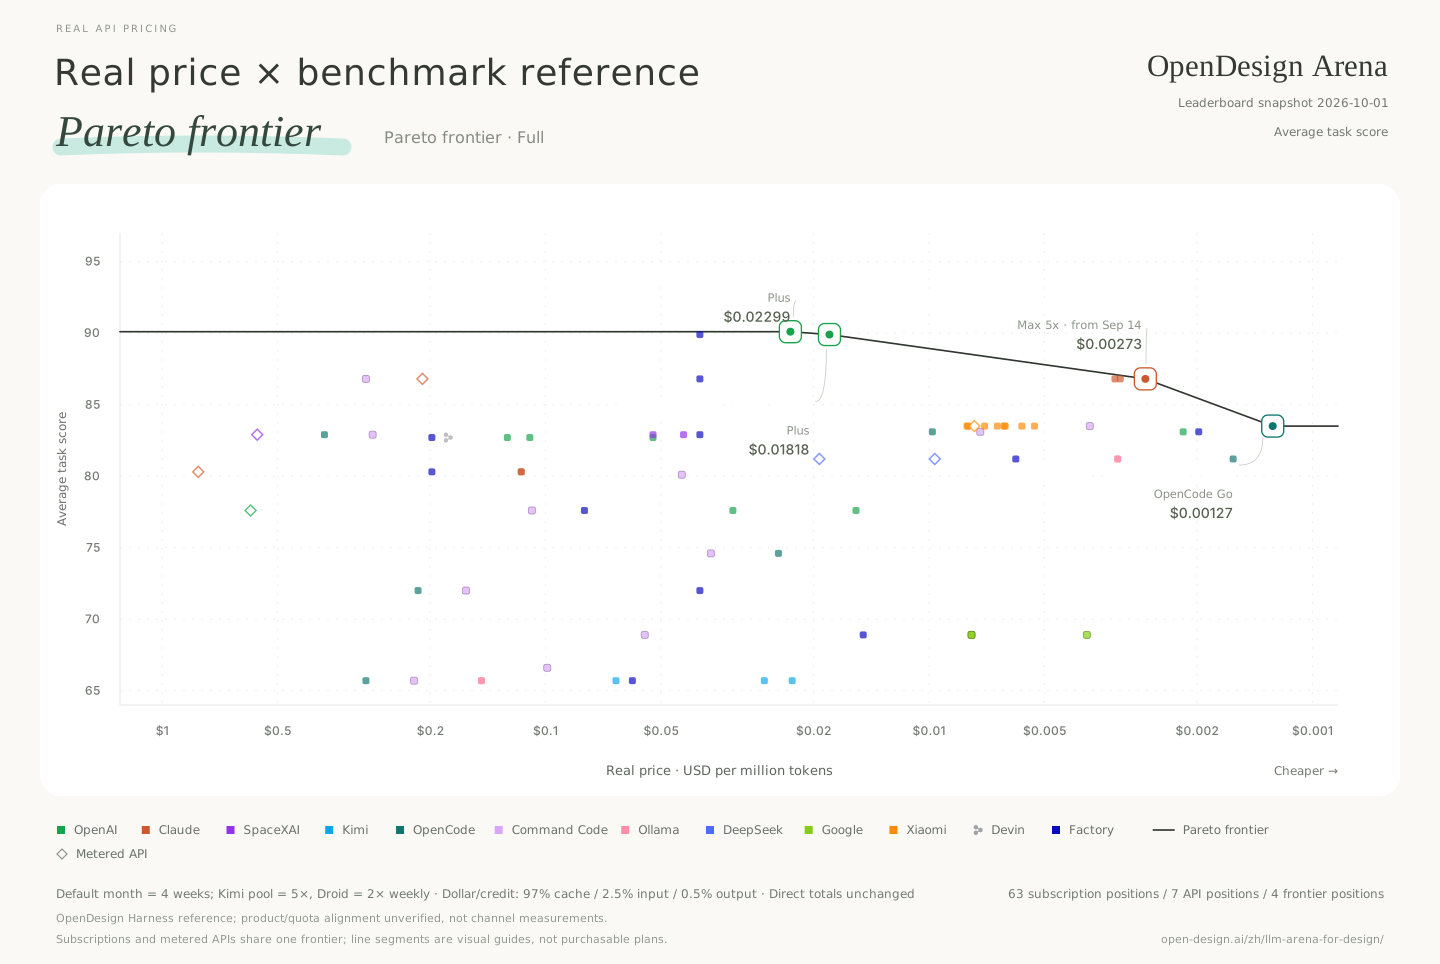
Many figures are not official numbers but conversions under one standardized workload assumption (mostly cache reads with a small input/output split), and some leaderboard scores are reference harness configurations rather than verified per-channel measurements.What does each Pareto chart actually show?Each chart plots a leaderboard's score against the real $/MTok price and draws the dominance frontier line, with both subscription plans and metered APIs competing on the same frontier.
Each chart plots a leaderboard's score against the real $/MTok price and draws the dominance frontier line, with both subscription plans and metered APIs competing on the same frontier.Which leaderboards are compared?Code Arena (WebDev Overall Arena Score), Agent Arena, AA Intelligence, AA Coding Agent, and OpenDesign Arena each get their own Pareto chart.
Code Arena (WebDev Overall Arena Score), Agent Arena, AA Intelligence, AA Coding Agent, and OpenDesign Arena each get their own Pareto chart.How many plans and models does the dataset cover?The latest snapshot (2026-09-09) covers 188 adopted plan×model points, including 175 subscription points with monthly allowances and 13 metered API baselines.
The latest snapshot (2026-09-09) covers 188 adopted plan×model points, including 175 subscription points with monthly allowances and 13 metered API baselines.Why convert everything into a token price instead of just quoting the subscription fee?Vendors price plans very differently (dollar/credit pools, tiered token rates, weekly vs monthly pools), so normalizing all of them to a $/million-token figure under one workload assumption makes plans directly comparable.
Vendors price plans very differently (dollar/credit pools, tiered token rates, weekly vs monthly pools), so normalizing all of them to a $/million-token figure under one workload assumption makes plans directly comparable.What are similar projects?trade-journal, chartist, vega, DB-GPT, daily_stock_analysis, metrics, d3, apexcharts.js
trade-journal, chartist, vega, DB-GPT, daily_stock_analysis, metrics, d3, apexcharts.js