



1.8K ·GitHub
What is this?
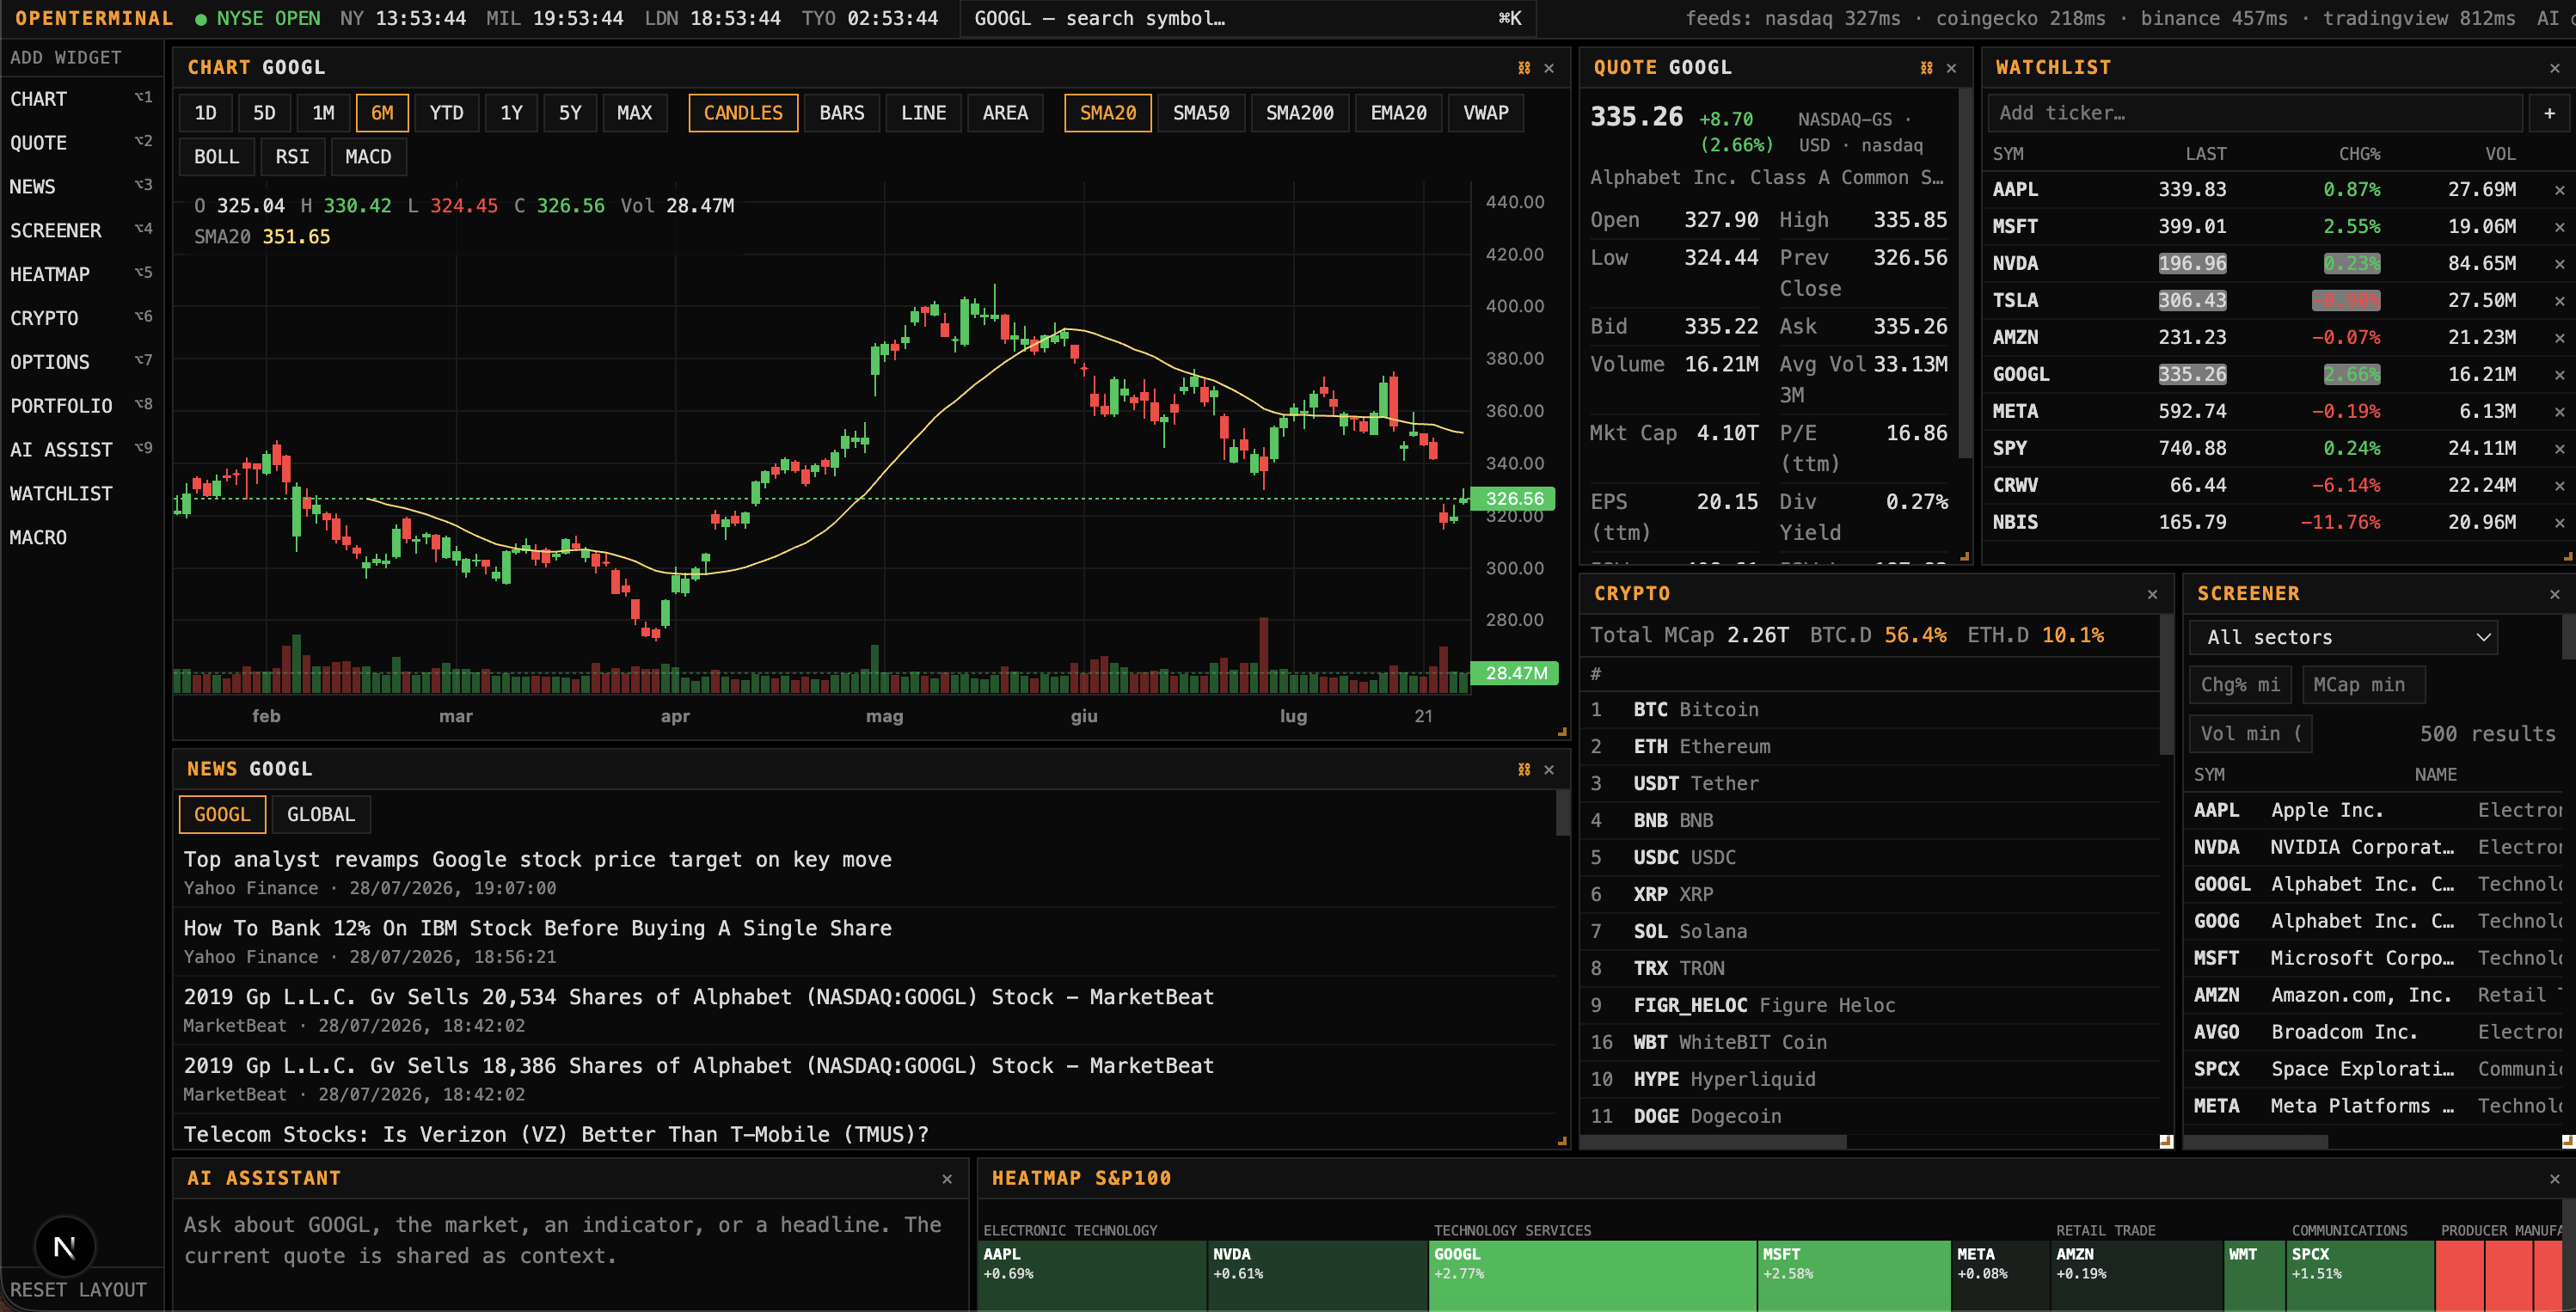
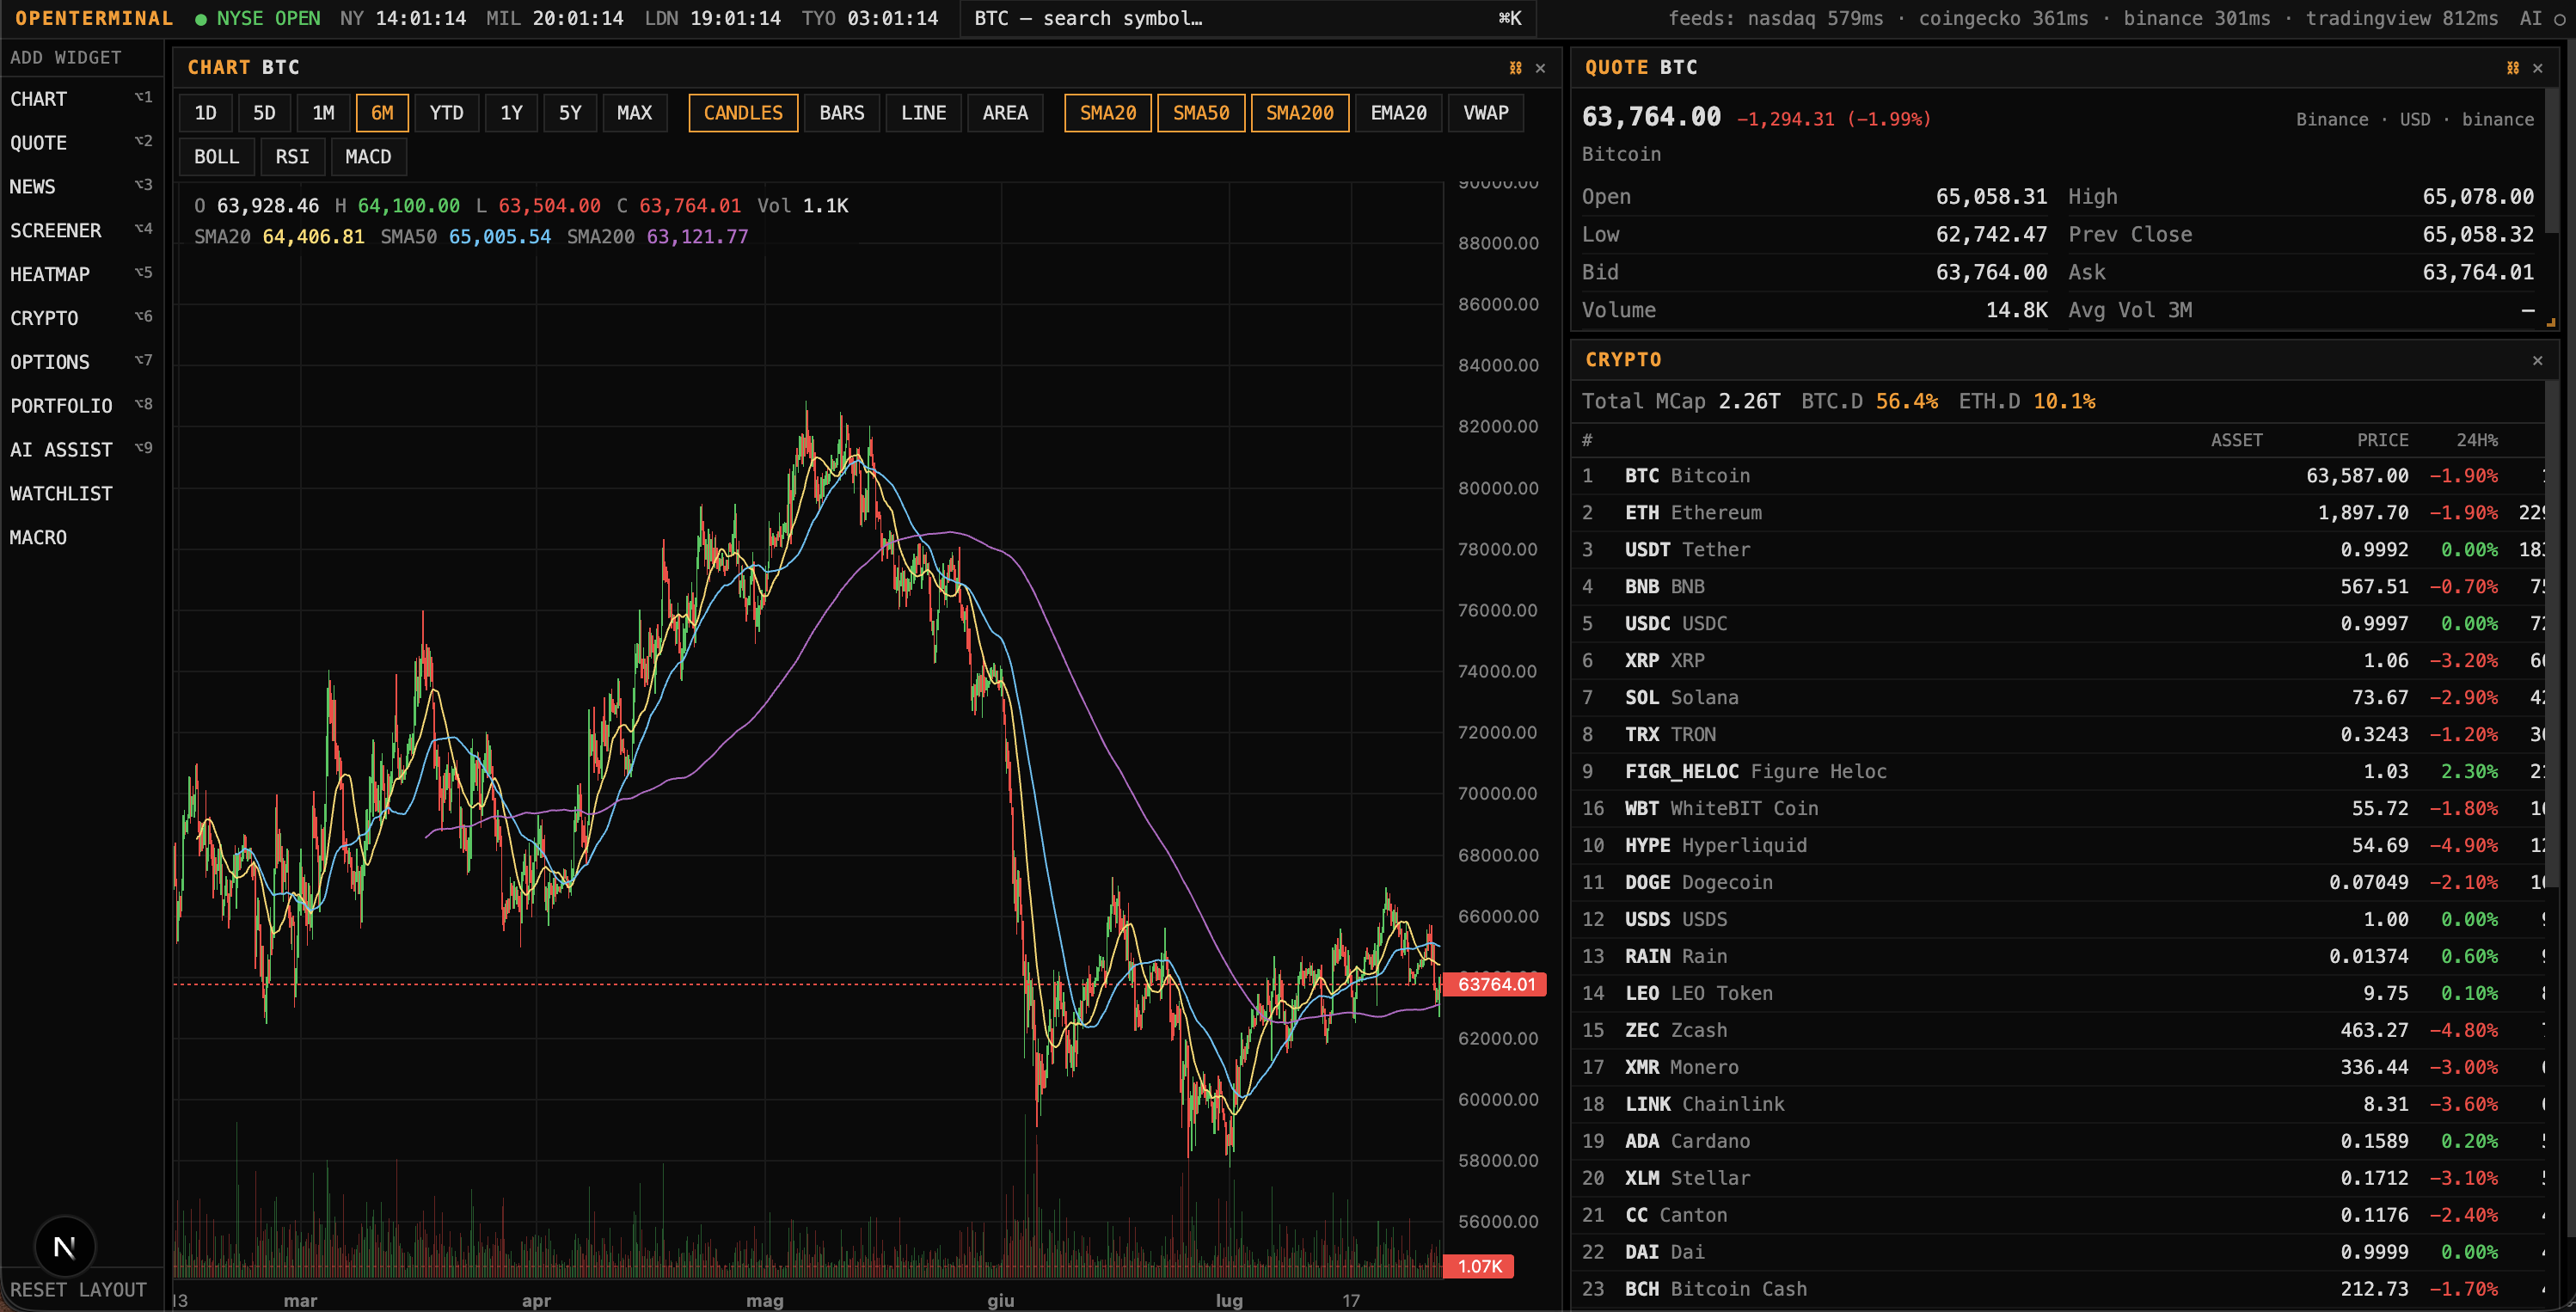
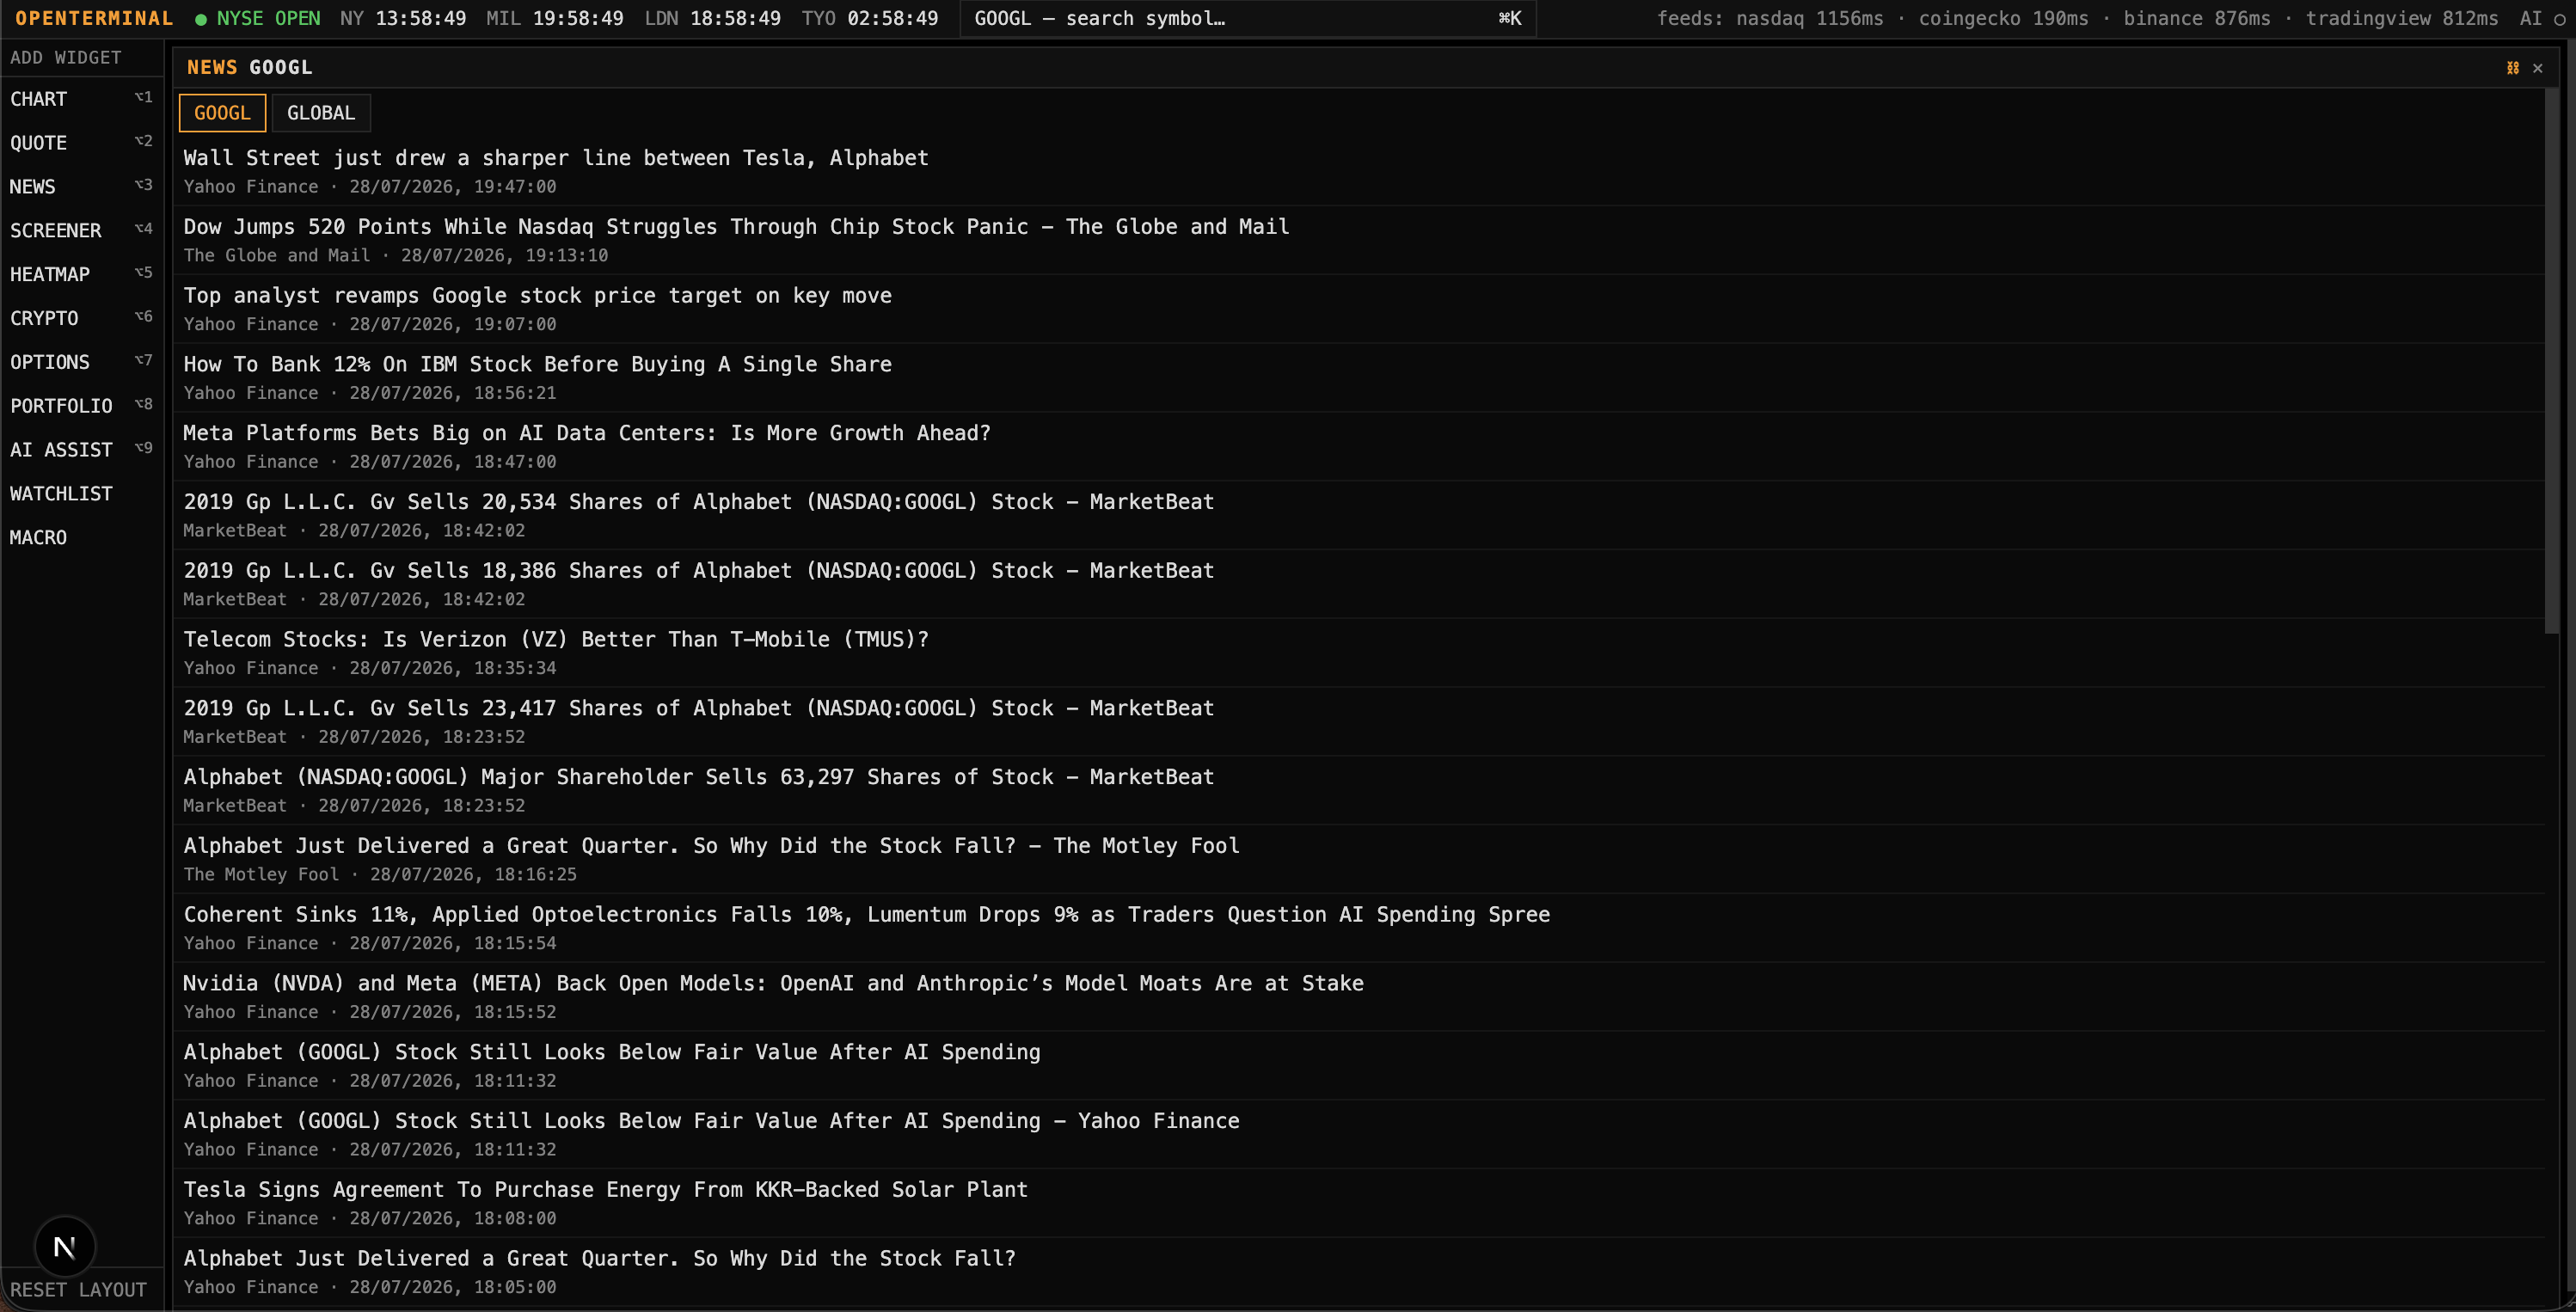
 OpenTerminal is a self-hosted, terminal-style trading dashboard that aggregates free public market data for stocks, crypto, and macro indicators into one keyboard-driven workspace, with no paid API keys or subscriptions required.
OpenTerminal is a self-hosted, terminal-style trading dashboard that aggregates free public market data for stocks, crypto, and macro indicators into one keyboard-driven workspace, with no paid API keys or subscriptions required.Is this a desktop app or something I run in the browser?It is a self-hosted web app: a Next.js/React frontend paired with a Node.js/Express backend that you run yourself (locally or via Docker) and then open in your browser.
It is a self-hosted web app: a Next.js/React frontend paired with a Node.js/Express backend that you run yourself (locally or via Docker) and then open in your browser.How do I get it running?Clone the repo and run npm install, then start it — the web UI and API come up with no .env file required; Docker is also supported with portfolio data persisted in a SQLite volume.
Clone the repo and run npm install, then start it — the web UI and API come up with no .env file required; Docker is also supported with portfolio data persisted in a SQLite volume.Do I need an Anthropic API key for anything?No — the whole dashboard works without any keys. An Anthropic API key only unlocks the optional AI assistant widget; without one that widget just shows an unavailable message instead of breaking anything else.
No — the whole dashboard works without any keys. An Anthropic API key only unlocks the optional AI assistant widget; without one that widget just shows an unavailable message instead of breaking anything else.How reliable is the market data?The data comes from public (and sometimes reverse-engineered) endpoints rather than licensed feeds, so prices should be treated as delayed or indicative, not execution-grade; each data type still has an automatic fallback provider if the primary source goes down.
The data comes from public (and sometimes reverse-engineered) endpoints rather than licensed feeds, so prices should be treated as delayed or indicative, not execution-grade; each data type still has an automatic fallback provider if the primary source goes down.Is it safe to expose this beyond my own machine?By default the API only binds to 127.0.0.1 and requires an auto-generated shared secret for the portfolio and AI endpoints, so nothing else on your network can reach it; exposing it further means manually setting APIHOST, APIKEY, and WEBORIGIN, and the project doesn't terminate HTTPS itself.
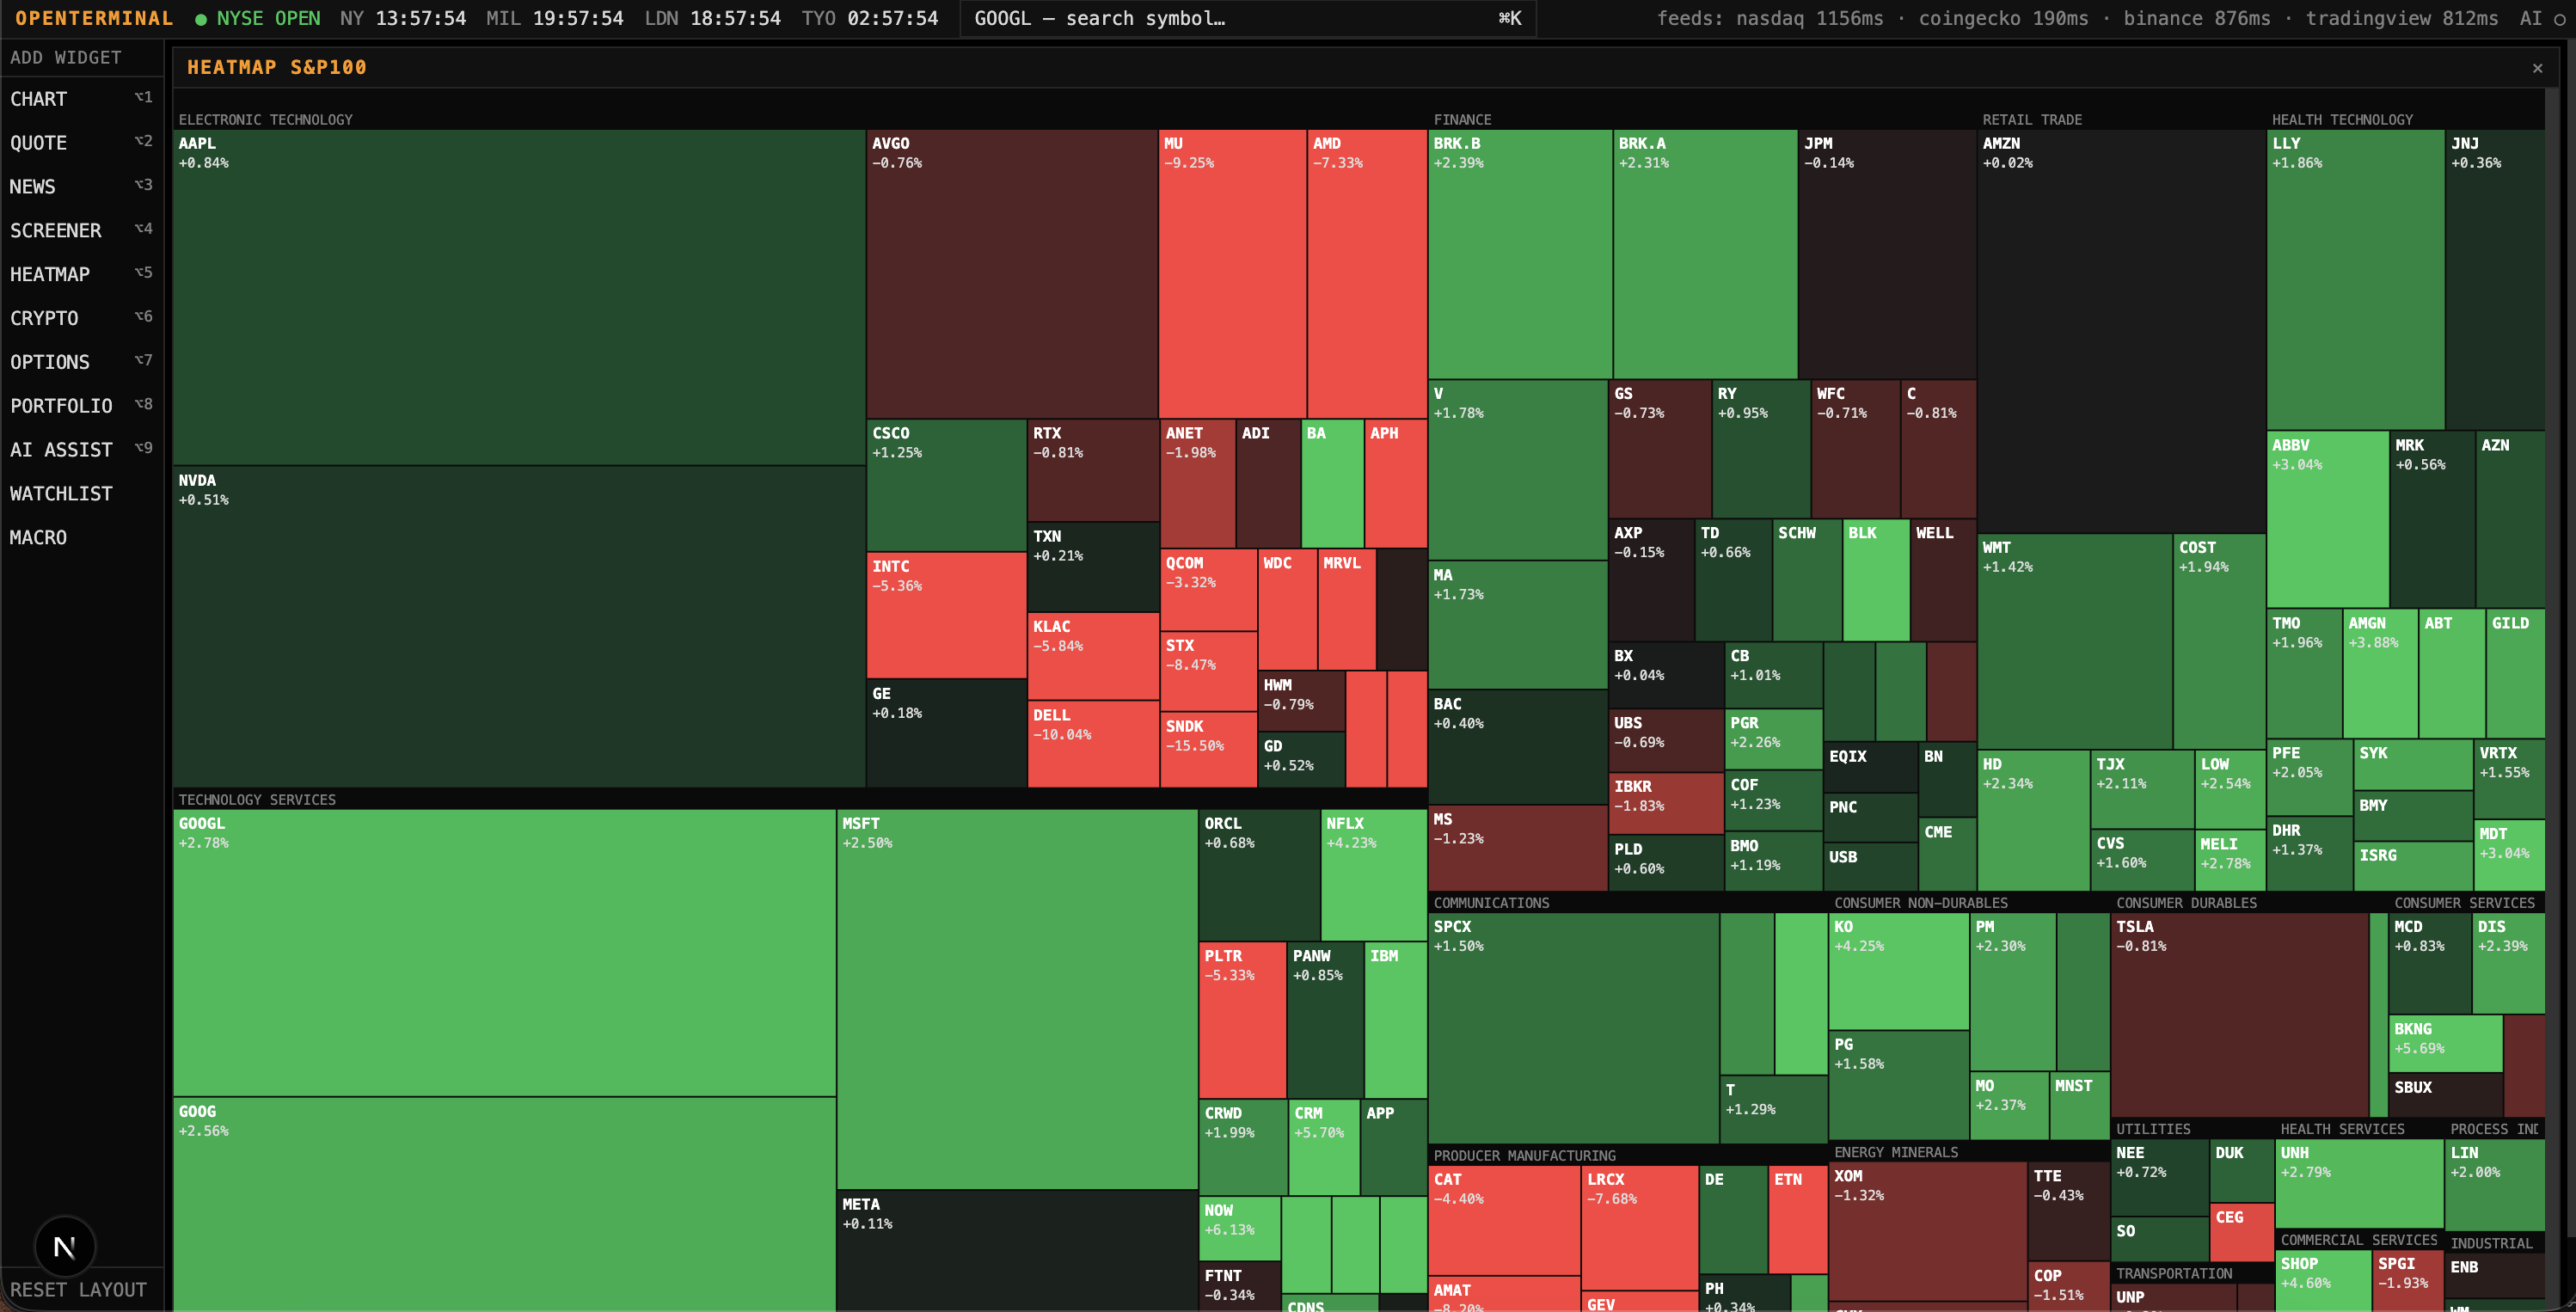
By default the API only binds to 127.0.0.1 and requires an auto-generated shared secret for the portfolio and AI endpoints, so nothing else on your network can reach it; exposing it further means manually setting APIHOST, APIKEY, and WEBORIGIN, and the project doesn't terminate HTTPS itself.What can the full-market screener and heatmap do?The screener filters the entire US equity market by sector, market cap, % change, and volume with sortable columns, while the live sector heatmap shows the same market as a treemap sized by market cap and colored by daily % change, refreshing every few seconds.
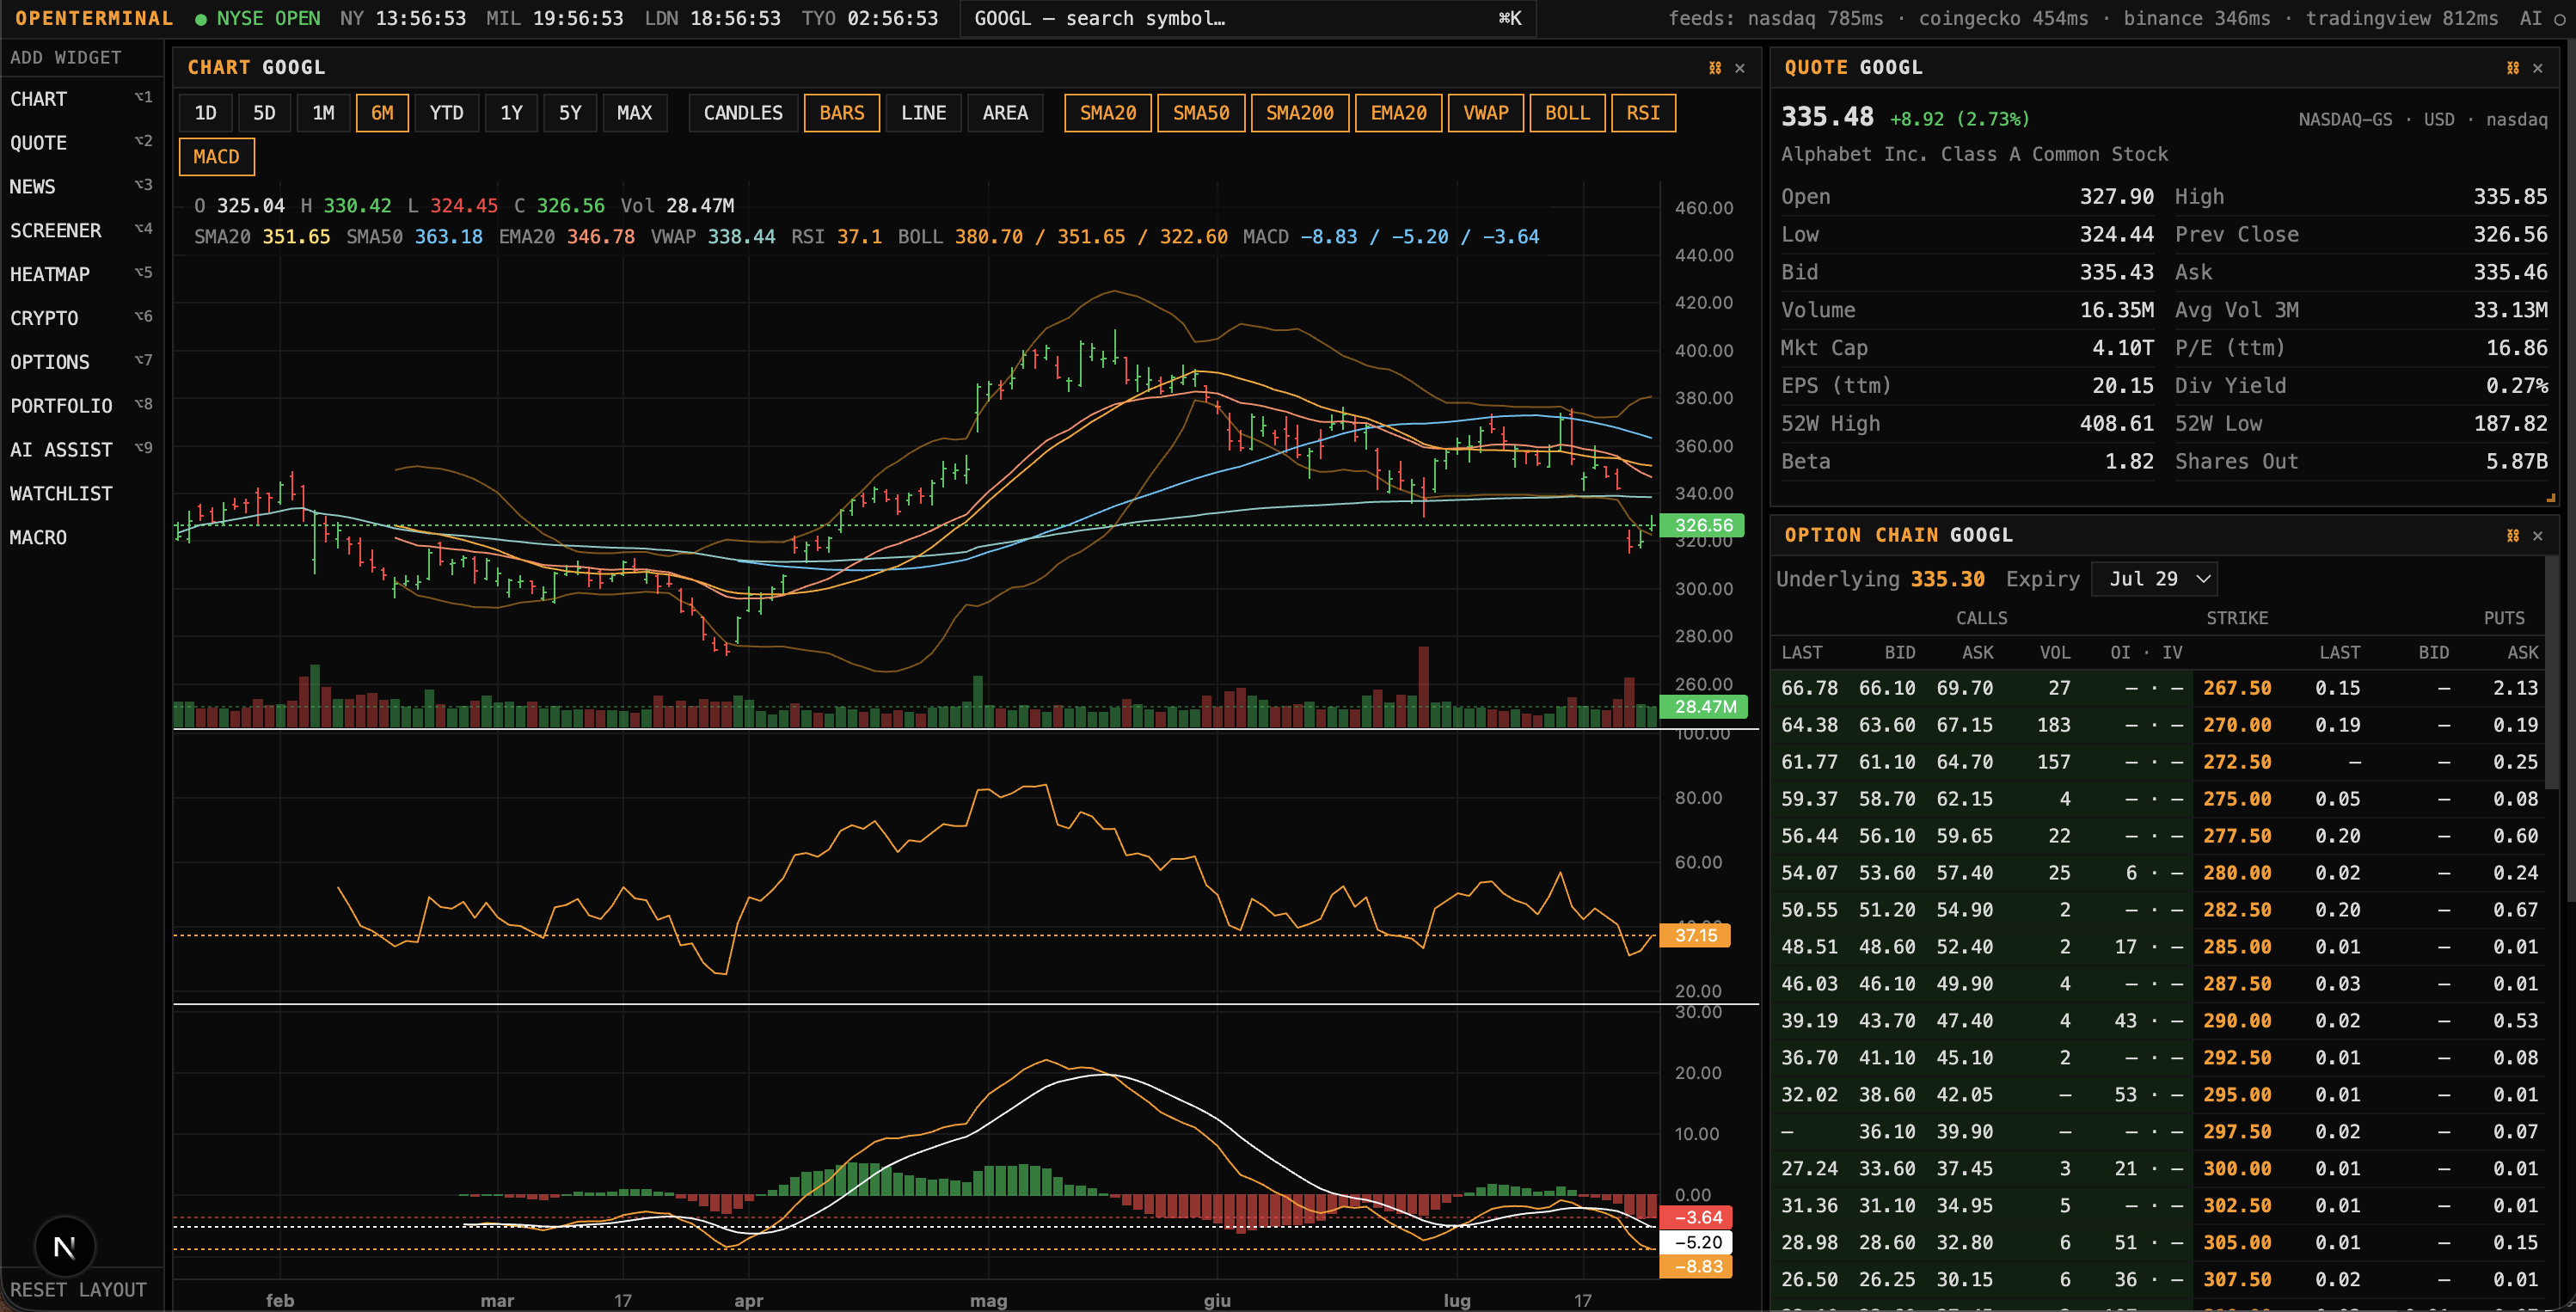
The screener filters the entire US equity market by sector, market cap, % change, and volume with sortable columns, while the live sector heatmap shows the same market as a treemap sized by market cap and colored by daily % change, refreshing every few seconds.What indicators does the charting support?Charts support candlesticks, bars, line, and area views across 8 timeframes with SMA, EMA, VWAP, Bollinger Bands, RSI, and MACD indicators, shown live under your cursor alongside OHLC and volume.
Charts support candlesticks, bars, line, and area views across 8 timeframes with SMA, EMA, VWAP, Bollinger Bands, RSI, and MACD indicators, shown live under your cursor alongside OHLC and volume.Can I track my own trades in it?Yes — the built-in portfolio tracker lets you log buy/sell transactions and tracks average cost plus realized and unrealized P&L, persisted locally in SQLite.
Yes — the built-in portfolio tracker lets you log buy/sell transactions and tracks average cost plus realized and unrealized P&L, persisted locally in SQLite.Why build this instead of using a real trading terminal?Real trading terminals cost $2,000+ a month and most free dashboards rely on one flaky data source; OpenTerminal stitches together several free public endpoints with automatic fallback chains so a single provider outage never takes the app down.
Real trading terminals cost $2,000+ a month and most free dashboards rely on one flaky data source; OpenTerminal stitches together several free public endpoints with automatic fallback chains so a single provider outage never takes the app down.What are similar projects?trade-journal, OpenStock, beebots, Trpjan-solana-trading-toolkit, dsh-trading, DoveVannoINostriSoldi, Crucix, rankme.fast
trade-journal, OpenStock, beebots, Trpjan-solana-trading-toolkit, dsh-trading, DoveVannoINostriSoldi, Crucix, rankme.fastWhich topics is it in?command-palette, personal-finance, stock-market, express, cryptocurrency, charts, finance, tailwindcss, data-visualization, real-time, nextjs, sqlite
command-palette, personal-finance, stock-market, express, cryptocurrency, charts, finance, tailwindcss, data-visualization, real-time, nextjs, sqlite