










mermaid README

The project's README from github.com/mermaid-js/mermaid. As one markdown file: README.md.

Mermaid

Generate diagrams from Markdown-like text.

Live Editor!

📖 Documentation | 🚀 Getting Started | 🌐 CDN | 🙌 Join Us

简体中文

Try Live Editor previews of future releases: Develop | Next


NPM Build CI Status npm minified gzipped bundle size Coverage Status CDN Status NPM Downloads Join our Discord! Twitter Follow Covered by Argos Visual Testing OpenSSF Scorecard

:trophy: Mermaid was nominated and won the JS Open Source Awards (2019) in the category "The most exciting use of technology"!!!

Thanks to all involved, people committing pull requests, people answering questions! 🙏

Banner for "The Official Guide to Mermaid.js" book

Table of content

Expand contents

About

Mermaid is a JavaScript-based diagramming and charting tool that uses Markdown-inspired text definitions and a renderer to create and modify complex diagrams. The main purpose of Mermaid is to help documentation catch up with development.

Doc-Rot is a Catch-22 that Mermaid helps to solve.

Diagramming and documentation costs precious developer time and gets outdated quickly. But not having diagrams or docs ruins productivity and hurts organizational learning.
Mermaid addresses this problem by enabling users to create easily modifiable diagrams. It can also be made part of production scripts (and other pieces of code).

Mermaid allows even non-programmers to easily create detailed diagrams through the Mermaid Live Editor.
For video tutorials, visit our Tutorials page. Use Mermaid with your favorite applications, check out the list of Integrations and Usages of Mermaid.

You can also use Mermaid within GitHub as well many of your other favorite applications—check out the list of Integrations and Usages of Mermaid.

For a more detailed introduction to Mermaid and some of its more basic uses, look to the Beginner's Guide, Usage and Tutorials.

Our PR Visual Regression Testing is powered by Argos with their generous Open Source plan. It makes the process of reviewing PRs with visual changes a breeze.

Covered by Argos Visual Testing

In our release process we rely heavily on visual regression tests using applitools. Applitools is a great service which has been easy to use and integrate with our tests.

Features

Examples

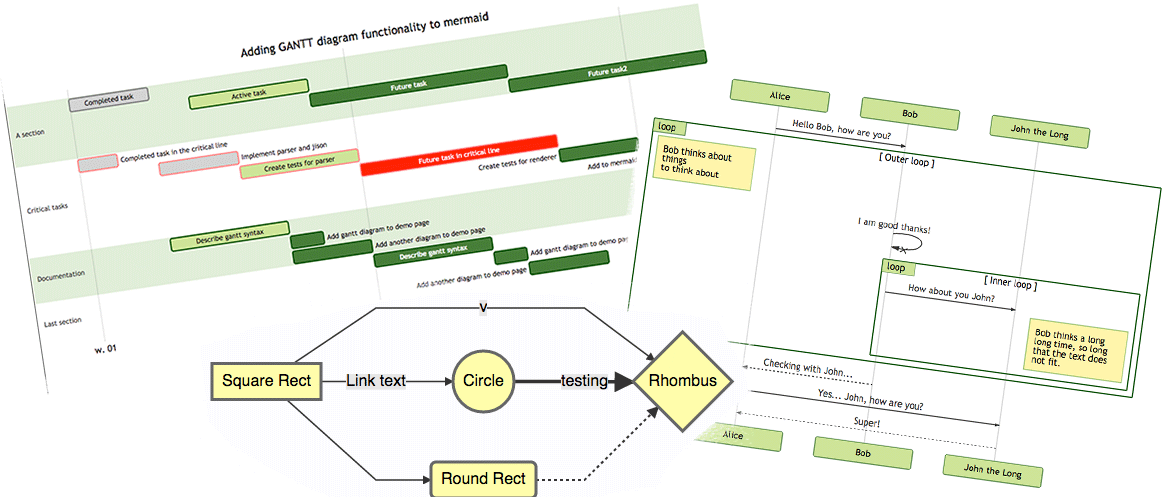
The following are some examples of the diagrams, charts and graphs that can be made using Mermaid. Click here to jump into the text syntax.

Flowchart [docs - live editor]

flowchart LR

A[Hard] -->|Text| B(Round)
B --> C{Decision}
C -->|One| D[Result 1]
C -->|Two| E[Result 2]
flowchart LR

A[Hard] -->|Text| B(Round)
B --> C{Decision}
C -->|One| D[Result 1]
C -->|Two| E[Result 2]

Sequence diagram [docs - live editor]

sequenceDiagram
Alice->>John: Hello John, how are you?
loop HealthCheck
    John->>John: Fight against hypochondria
end
Note right of John: Rational thoughts!
John-->>Alice: Great!
John->>Bob: How about you?
Bob-->>John: Jolly good!
sequenceDiagram
Alice->>John: Hello John, how are you?
loop HealthCheck
    John->>John: Fight against hypochondria
end
Note right of John: Rational thoughts!
John-->>Alice: Great!
John->>Bob: How about you?
Bob-->>John: Jolly good!

Gantt chart [docs - live editor]

gantt
    section Section
    Completed :done,    des1, 2014-01-06,2014-01-08
    Active        :active,  des2, 2014-01-07, 3d
    Parallel 1   :         des3, after des1, 1d
    Parallel 2   :         des4, after des1, 1d
    Parallel 3   :         des5, after des3, 1d
    Parallel 4   :         des6, after des4, 1d
gantt
    section Section
    Completed :done,    des1, 2014-01-06,2014-01-08
    Active        :active,  des2, 2014-01-07, 3d
    Parallel 1   :         des3, after des1, 1d
    Parallel 2   :         des4, after des1, 1d
    Parallel 3   :         des5, after des3, 1d
    Parallel 4   :         des6, after des4, 1d

Class diagram [docs - live editor]

classDiagram
Class01 <|-- AveryLongClass : Cool
<<Interface>> Class01
Class09 --> C2 : Where am I?
Class09 --* C3
Class09 --|> Class07
Class07 : equals()
Class07 : Object[] elementData
Class01 : size()
Class01 : int chimp
Class01 : int gorilla
class Class10 {
  <<service>>
  int id
  size()
}
classDiagram
Class01 <|-- AveryLongClass : Cool
<<Interface>> Class01
Class09 --> C2 : Where am I?
Class09 --* C3
Class09 --|> Class07
Class07 : equals()
Class07 : Object[] elementData
Class01 : size()
Class01 : int chimp
Class01 : int gorilla
class Class10 {
  <<service>>
  int id
  size()
}

State diagram [docs - live editor]

stateDiagram-v2
[*] --> Still
Still --> [*]
Still --> Moving
Moving --> Still
Moving --> Crash
Crash --> [*]
stateDiagram-v2
[*] --> Still
Still --> [*]
Still --> Moving
Moving --> Still
Moving --> Crash
Crash --> [*]

Pie chart [docs - live editor]

pie
"Dogs" : 386
"Cats" : 85.9
"Rats" : 15
pie
"Dogs" : 386
"Cats" : 85.9
"Rats" : 15

Git graph [experimental - live editor]

gitGraph
  commit
  commit
  branch develop
  checkout develop
  commit
  commit
  checkout main
  merge develop
  commit
  commit
gitGraph
  commit
  commit
  branch develop
  checkout develop
  commit
  commit
  checkout main
  merge develop
  commit
  commit

Bar chart (using gantt chart) [docs - live editor]

gantt
    title Git Issues - days since last update
    dateFormat  X
    axisFormat %s

    section Issue19062
    71   : 0, 71
    section Issue19401
    36   : 0, 36
    section Issue193
    34   : 0, 34
    section Issue7441
    9    : 0, 9
    section Issue1300
    5    : 0, 5
gantt
    title Git Issues - days since last update
    dateFormat  X
    axisFormat %s

    section Issue19062
    71   : 0, 71
    section Issue19401
    36   : 0, 36
    section Issue193
    34   : 0, 34
    section Issue7441
    9    : 0, 9
    section Issue1300
    5    : 0, 5

User Journey diagram [docs - live editor]

  journey
    title My working day
    section Go to work
      Make tea: 5: Me
      Go upstairs: 3: Me
      Do work: 1: Me, Cat
    section Go home
      Go downstairs: 5: Me
      Sit down: 3: Me
  journey
    title My working day
    section Go to work
      Make tea: 5: Me
      Go upstairs: 3: Me
      Do work: 1: Me, Cat
    section Go home
      Go downstairs: 5: Me
      Sit down: 3: Me

C4 diagram [docs]

C4Context
title System Context diagram for Internet Banking System

Person(customerA, "Banking Customer A", "A customer of the bank, with personal bank accounts.")
Person(customerB, "Banking Customer B")
Person_Ext(customerC, "Banking Customer C")
System(SystemAA, "Internet Banking System", "Allows customers to view information about their bank accounts, and make payments.")

Person(customerD, "Banking Customer D", "A customer of the bank, <br/> with personal bank accounts.")

Enterprise_Boundary(b1, "BankBoundary") {

  SystemDb_Ext(SystemE, "Mainframe Banking System", "Stores all of the core banking information about customers, accounts, transactions, etc.")

  System_Boundary(b2, "BankBoundary2") {
    System(SystemA, "Banking System A")
    System(SystemB, "Banking System B", "A system of the bank, with personal bank accounts.")
  }

  System_Ext(SystemC, "E-mail system", "The internal Microsoft Exchange e-mail system.")
  SystemDb(SystemD, "Banking System D Database", "A system of the bank, with personal bank accounts.")

  Boundary(b3, "BankBoundary3", "boundary") {
    SystemQueue(SystemF, "Banking System F Queue", "A system of the bank, with personal bank accounts.")
    SystemQueue_Ext(SystemG, "Banking System G Queue", "A system of the bank, with personal bank accounts.")
  }
}

BiRel(customerA, SystemAA, "Uses")
BiRel(SystemAA, SystemE, "Uses")
Rel(SystemAA, SystemC, "Sends e-mails", "SMTP")
Re

mermaid (mermaid-js/mermaid)

diagrams-as-code
Searching Database…

90.7K ·GitHub
What is this?Mermaid is a JavaScript-based diagramming and charting tool that lets you create flowcharts, sequence diagrams, Gantt charts and more from simple Markdown-inspired text definitions instead of a drag-and-drop editor.
Is this a library I add to my app, or a standalone editor?It's primarily a JavaScript/TypeScript library you embed in web pages or tools, but it also ships a Live Editor (mermaid.live) for people who just want to paste text and get a diagram without coding.
How do I add it to my project?Install the mermaid package and feed it diagram text, or just use a fenced code block tagged 'mermaid' — GitHub, many wikis and documentation tools render it natively without any setup.
Is it safe to render diagrams from untrusted text?Mermaid builds in sanitization and offers a sandboxed rendering mode specifically because diagram text can come from user input, so untrusted sources should still use that sandboxed mode rather than default rendering.
Who is this for — just developers?It targets both developers who want diagrams versioned as text alongside code, and non-programmers who can build diagrams visually through the Live Editor.
How many diagram types does Mermaid support?Over 20, including flowcharts, sequence, class, state, ER, Gantt, pie, Git graph, mindmap, timeline, Sankey and C4 diagrams.
Why would I use Mermaid instead of a drawing tool like draw.io?Because diagrams are plain text, they live in version control, diff cleanly in pull requests, and update instantly when the text changes, instead of being opaque binary files.
Can I preview diagrams without installing anything?Yes, the Mermaid Live Editor at mermaid.live lets you write and preview diagrams instantly in the browser with no install.
Has Mermaid won any recognition?It won the JS Open Source Awards in 2019 in the category 'The most exciting use of technology'.
Creator
mermaid-js
Size
275.5 MB
Stars
90.7K
Age
11y
Commits · 90 Days