
Neko Master
See your network traffic clearly.
Real-time monitoring · Traffic auditing · Multi-gateway support
English | 中文







[!IMPORTANT]
Disclaimer
This project is a traffic analysis and visualization tool
for local gateway environments.
It does not provide any network access service,
proxy subscription, or cross-network connectivity.
All data is collected from the user's own network environment.
This project is open-sourced under the MIT License. We assume no responsibility for any consequences resulting from the use of this software. Please use it in compliance with applicable laws and regulations.
About the Name
Neko (ねこ) means cat in Japanese.
Pronounced /ˈneɪkoʊ/ (NEH-ko).
Like a cat, Neko Master observes network traffic quietly and precisely.
It is a lightweight analytics dashboard designed for modern gateway environments.
📋 Table of Contents
✨ Features
| Feature |
Description |
| 📊 Real-time Monitoring |
WebSocket real-time collection with millisecond latency |
| 📈 Trend Analysis |
Multi-dimensional traffic trends: 30min / 1h / 24h |
| 🌐 Domain Analysis |
View traffic, associated IPs, and connection count per domain |
| 🗺️ IP Analysis |
ASN, geo-location, and associated domain display |
| 🚀 Proxy Statistics |
Traffic distribution and connection count per proxy node |
| 📱 PWA Support |
Install as desktop app for native experience |
| 🌙 Dark Mode |
Light / Dark / System theme support |
| 🌍 i18n Support |
English / Chinese seamless switching |
| 🔄 Multi-Backend |
Monitor multiple OpenClash backend instances simultaneously |
🚀 Quick Start
Option 1: Docker Compose (Recommended)
The repository's built-in docker-compose.yml maps 3000/3001/3002 by default.
Scenarios A/B below are minimal templates for common deployments.
Scenario A: Minimal deployment (only expose 3000)
services:
  neko-master:
    image: foru17/neko-master:latest
    container_name: neko-master
    restart: unless-stopped
    ports:
      - "3000:3000" # Web UI
    volumes:
      - ./data:/app/data
      # Local MMDB (optional, files should be downloaded into ./geoip)
      - ./geoip:/app/data/geoip:ro
    environment:
      - NODE_ENV=production
      - DB_PATH=/app/data/stats.db
      - COOKIE_SECRET=${COOKIE_SECRET}
Recommended in .env (same directory as docker-compose.yml):
COOKIE_SECRET=<at least 32-byte random string> (generate with openssl rand -hex 32)
This mode is fully upgrade-compatible and works out of the box.
If WS is not routed, the app falls back to HTTP polling automatically.
Scenario B: Real-time WebSocket (recommended with reverse proxy)
services:
  neko-master:
    image: foru17/neko-master:latest
    container_name: neko-master
    restart: unless-stopped
    ports:
      - "3000:3000" # Web UI
      - "3002:3002" # WebSocket (for Nginx / Tunnel forwarding)
    volumes:
      - ./data:/app/data
      # Local MMDB (optional, files should be downloaded into ./geoip)
      - ./geoip:/app/data/geoip:ro
    environment:
      - NODE_ENV=production
      - DB_PATH=/app/data/stats.db
      - COOKIE_SECRET=${COOKIE_SECRET}
Then run:
docker compose up -d
Open http://localhost:3000 to get started.
If you use the repository's built-in Compose file (default 3000/3001/3002), run the same command.
Option 2: Docker Run
# Generate a fixed cookie secret first (for session persistence)
export COOKIE_SECRET="$(openssl rand -hex 32)"
# Minimal (only 3000)
docker run -d \
  --name neko-master \
  -p 3000:3000 \
  -v $(pwd)/data:/app/data \
  -e COOKIE_SECRET="$COOKIE_SECRET" \
  --restart unless-stopped \
  foru17/neko-master:latest

# Real-time WS (with reverse proxy)
docker run -d \
  --name neko-master \
  -p 3000:3000 \
  -p 3002:3002 \
  -v $(pwd)/data:/app/data \
  -e COOKIE_SECRET="$COOKIE_SECRET" \
  --restart unless-stopped \
  foru17/neko-master:latest
Open http://localhost:3000 to get started.
The frontend uses same-origin /api by default, so port 3001 is usually not required externally.
For real-time WS, your reverse proxy/tunnel must be able to reach port 3002. If not, the app falls back to ~5s HTTP polling.
For docker run, change external ports using -p mappings directly.
Only if you use direct WS access (no reverse proxy) and external WS port is not 3002, also pass -e WS_EXTERNAL_PORT=<external-ws-port>.
Local MMDB lookup mode (optional): mount -v $(pwd)/geoip:/app/data/geoip:ro,
then switch source to Local in Settings -> Preferences -> IP Lookup Source.
Option 3: One-Click Script
Automatically detects port conflicts and configures everything:
# Using curl
curl -fsSL https://raw.githubusercontent.com/foru17/neko-master/main/setup.sh | bash

# Or using wget
wget -qO- https://raw.githubusercontent.com/foru17/neko-master/main/setup.sh | bash
The script will automatically:
- ✅ Download
docker-compose.yml
- ✅ Check if default ports (3000/3001/3002) are in use
- ✅ Suggest available alternative ports
- ✅ Create configuration file and start the service
Option 4: Source Code
# 1. Clone the repository
git clone https://github.com/foru17/neko-master.git
cd neko-master

# 2. Install dependencies
pnpm install

# 3. Prepare collector env (source mode reads apps/collector/.env)
cp apps/collector/.env.example apps/collector/.env

# 4. Start development services
pnpm dev
Open http://localhost:3000 to configure.
In source mode: collector listens on 3001/3002, web listens on 3000 by default.
If you changed API_PORT (not 3001), set API_URL accordingly (for example API_URL=http://localhost:4001) so web /api rewrite targets the correct API.
apps/collector/.env.local takes precedence over apps/collector/.env.
🤖 Agent Deployment
Use Agent mode when you want one centralized Neko Master service and multiple remote devices (OpenWrt, Linux, macOS) collecting local gateway data. The agent runs near the gateway, pulls data, and reports to the panel — the panel never connects to the gateway directly.
Supported gateway types: Clash / Mihomo (WebSocket real-time) and Surge v5+ (HTTP polling).
Quick Install (UI-generated command)
- In the dashboard, go to
Settings → Backends, add an Agent backend, select gateway type
- Click "View Agent Script" and copy the one-line install command, then run it on the target host:
# Clash / Mihomo gateway example
curl -fsSL https://raw.githubusercontent.com/foru17/neko-master/main/apps/agent/install.sh \
  | env NEKO_SERVER='http://your-panel:3000' \
        NEKO_BACKEND_ID='1' \
        NEKO_BACKEND_TOKEN='ag_xxx' \
        NEKO_GATEWAY_TYPE='clash' \
        NEKO_GATEWAY_URL='http://127.0.0.1:9090' \
        sh

# Surge gateway example
curl -fsSL https://raw.githubusercontent.com/foru17/neko-master/main/apps/agent/install.sh \
  | env NEKO_SERVER='http://your-panel:3000' \
        NEKO_BACKEND_ID='2' \
        NEKO_BACKEND_TOKEN='ag_yyy' \
        NEKO_GATEWAY_TYPE='surge' \
        NEKO_GATEWAY_URL='http://127.0.0.1:9091' \
        sh
After install, manage instances with nekoagent:
nekoagent list               # list all instances
nekoagent status <instance>  # check running state
nekoagent logs <instance>    # tail live logs
nekoagent restart <instance> # restart
nekoagent upgrade            # global upgrade (CLI + binary)
The script auto-detects an existing installation — if neko-agent is already present, it only adds the new instance without re-downloading.
Multiple instances can run on the same host (different NEKO_INSTANCE_NAME), each pointing to a different gateway.
Agent Documentation
📖 First Use
Connect Clash / Mihomo
- Open http://localhost:3000
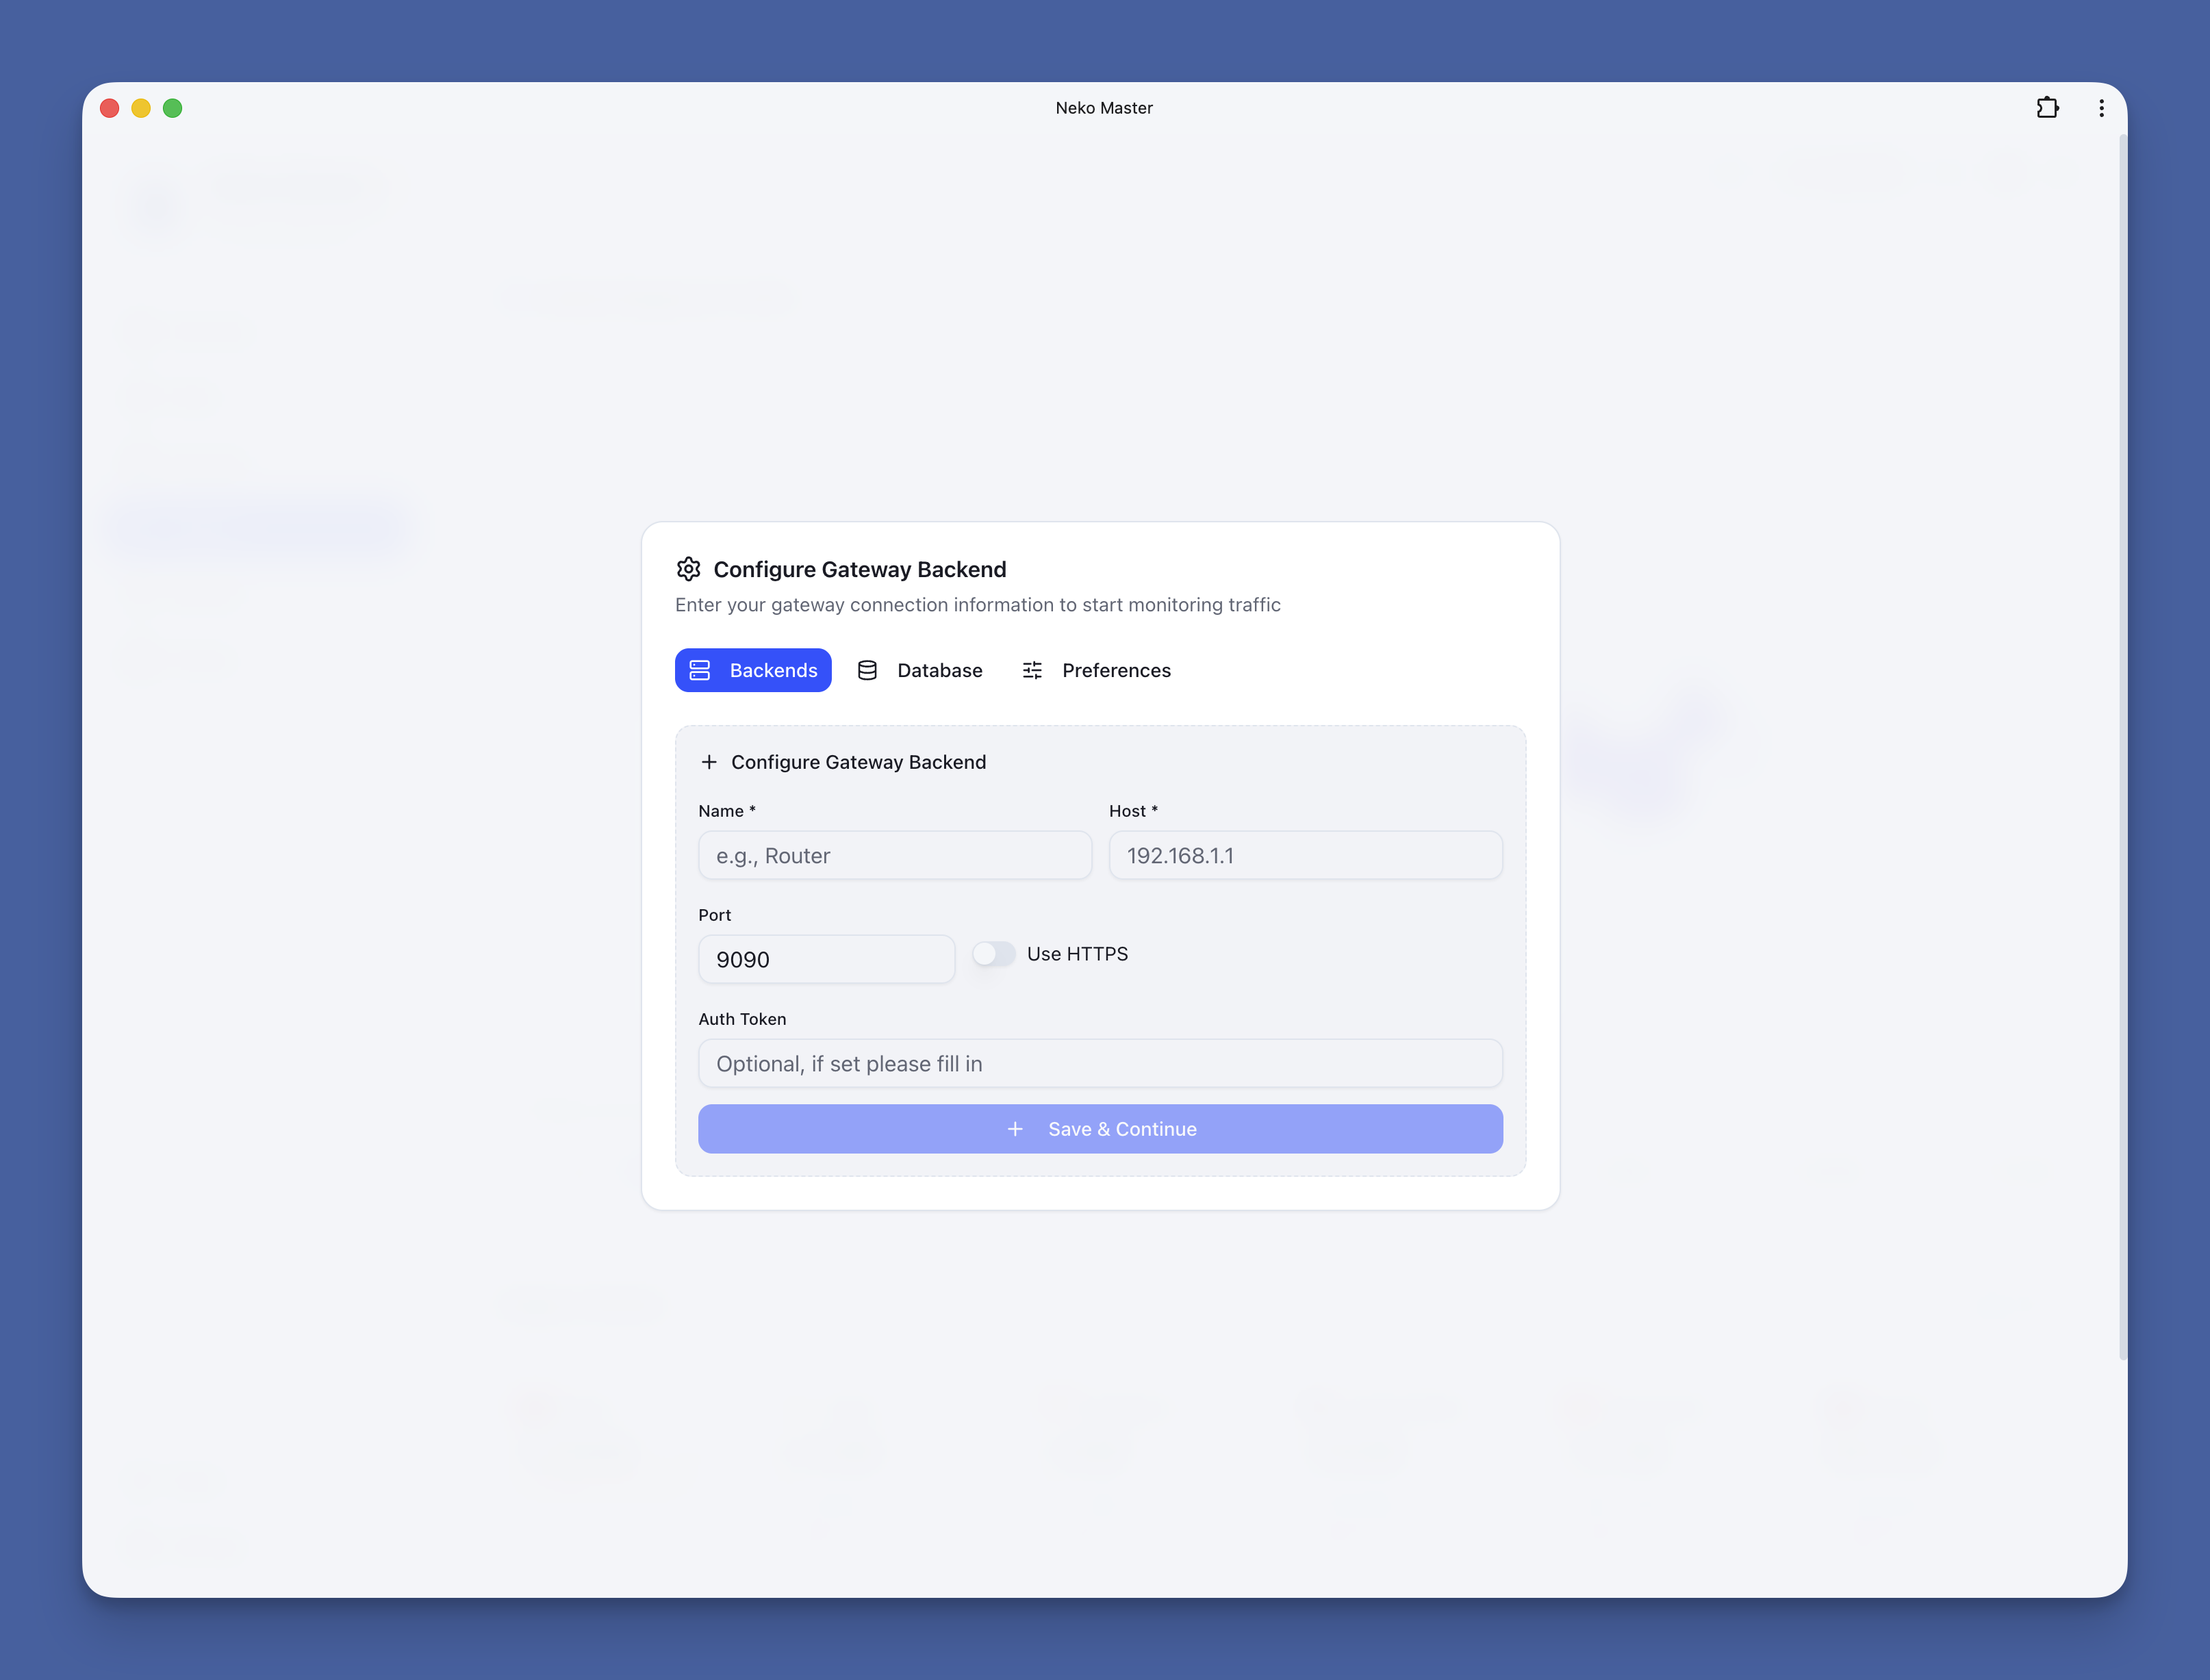
- The Gateway Configuration dialog will appear on first visit
- Fill in your network gateway (e.g., OpenClash) connection info:
- Name: Custom name (e.g., "Home Gateway")
- Type: Select
Clash / Mihomo
- Host: Gateway backend address (e.g.,
192.168.101.1)
- Port: Gateway backend port (e.g.,
9090)
- Token: Fill if Secret is configured, otherwise leave empty
- Click "Add Backend" to save
- The system will automatically start collecting and analyzing traffic data
💡 Get Gateway Address: Go to your gateway control panel (e.g., OpenClash) → Enable "External Control" → Copy API address
Connect Surge
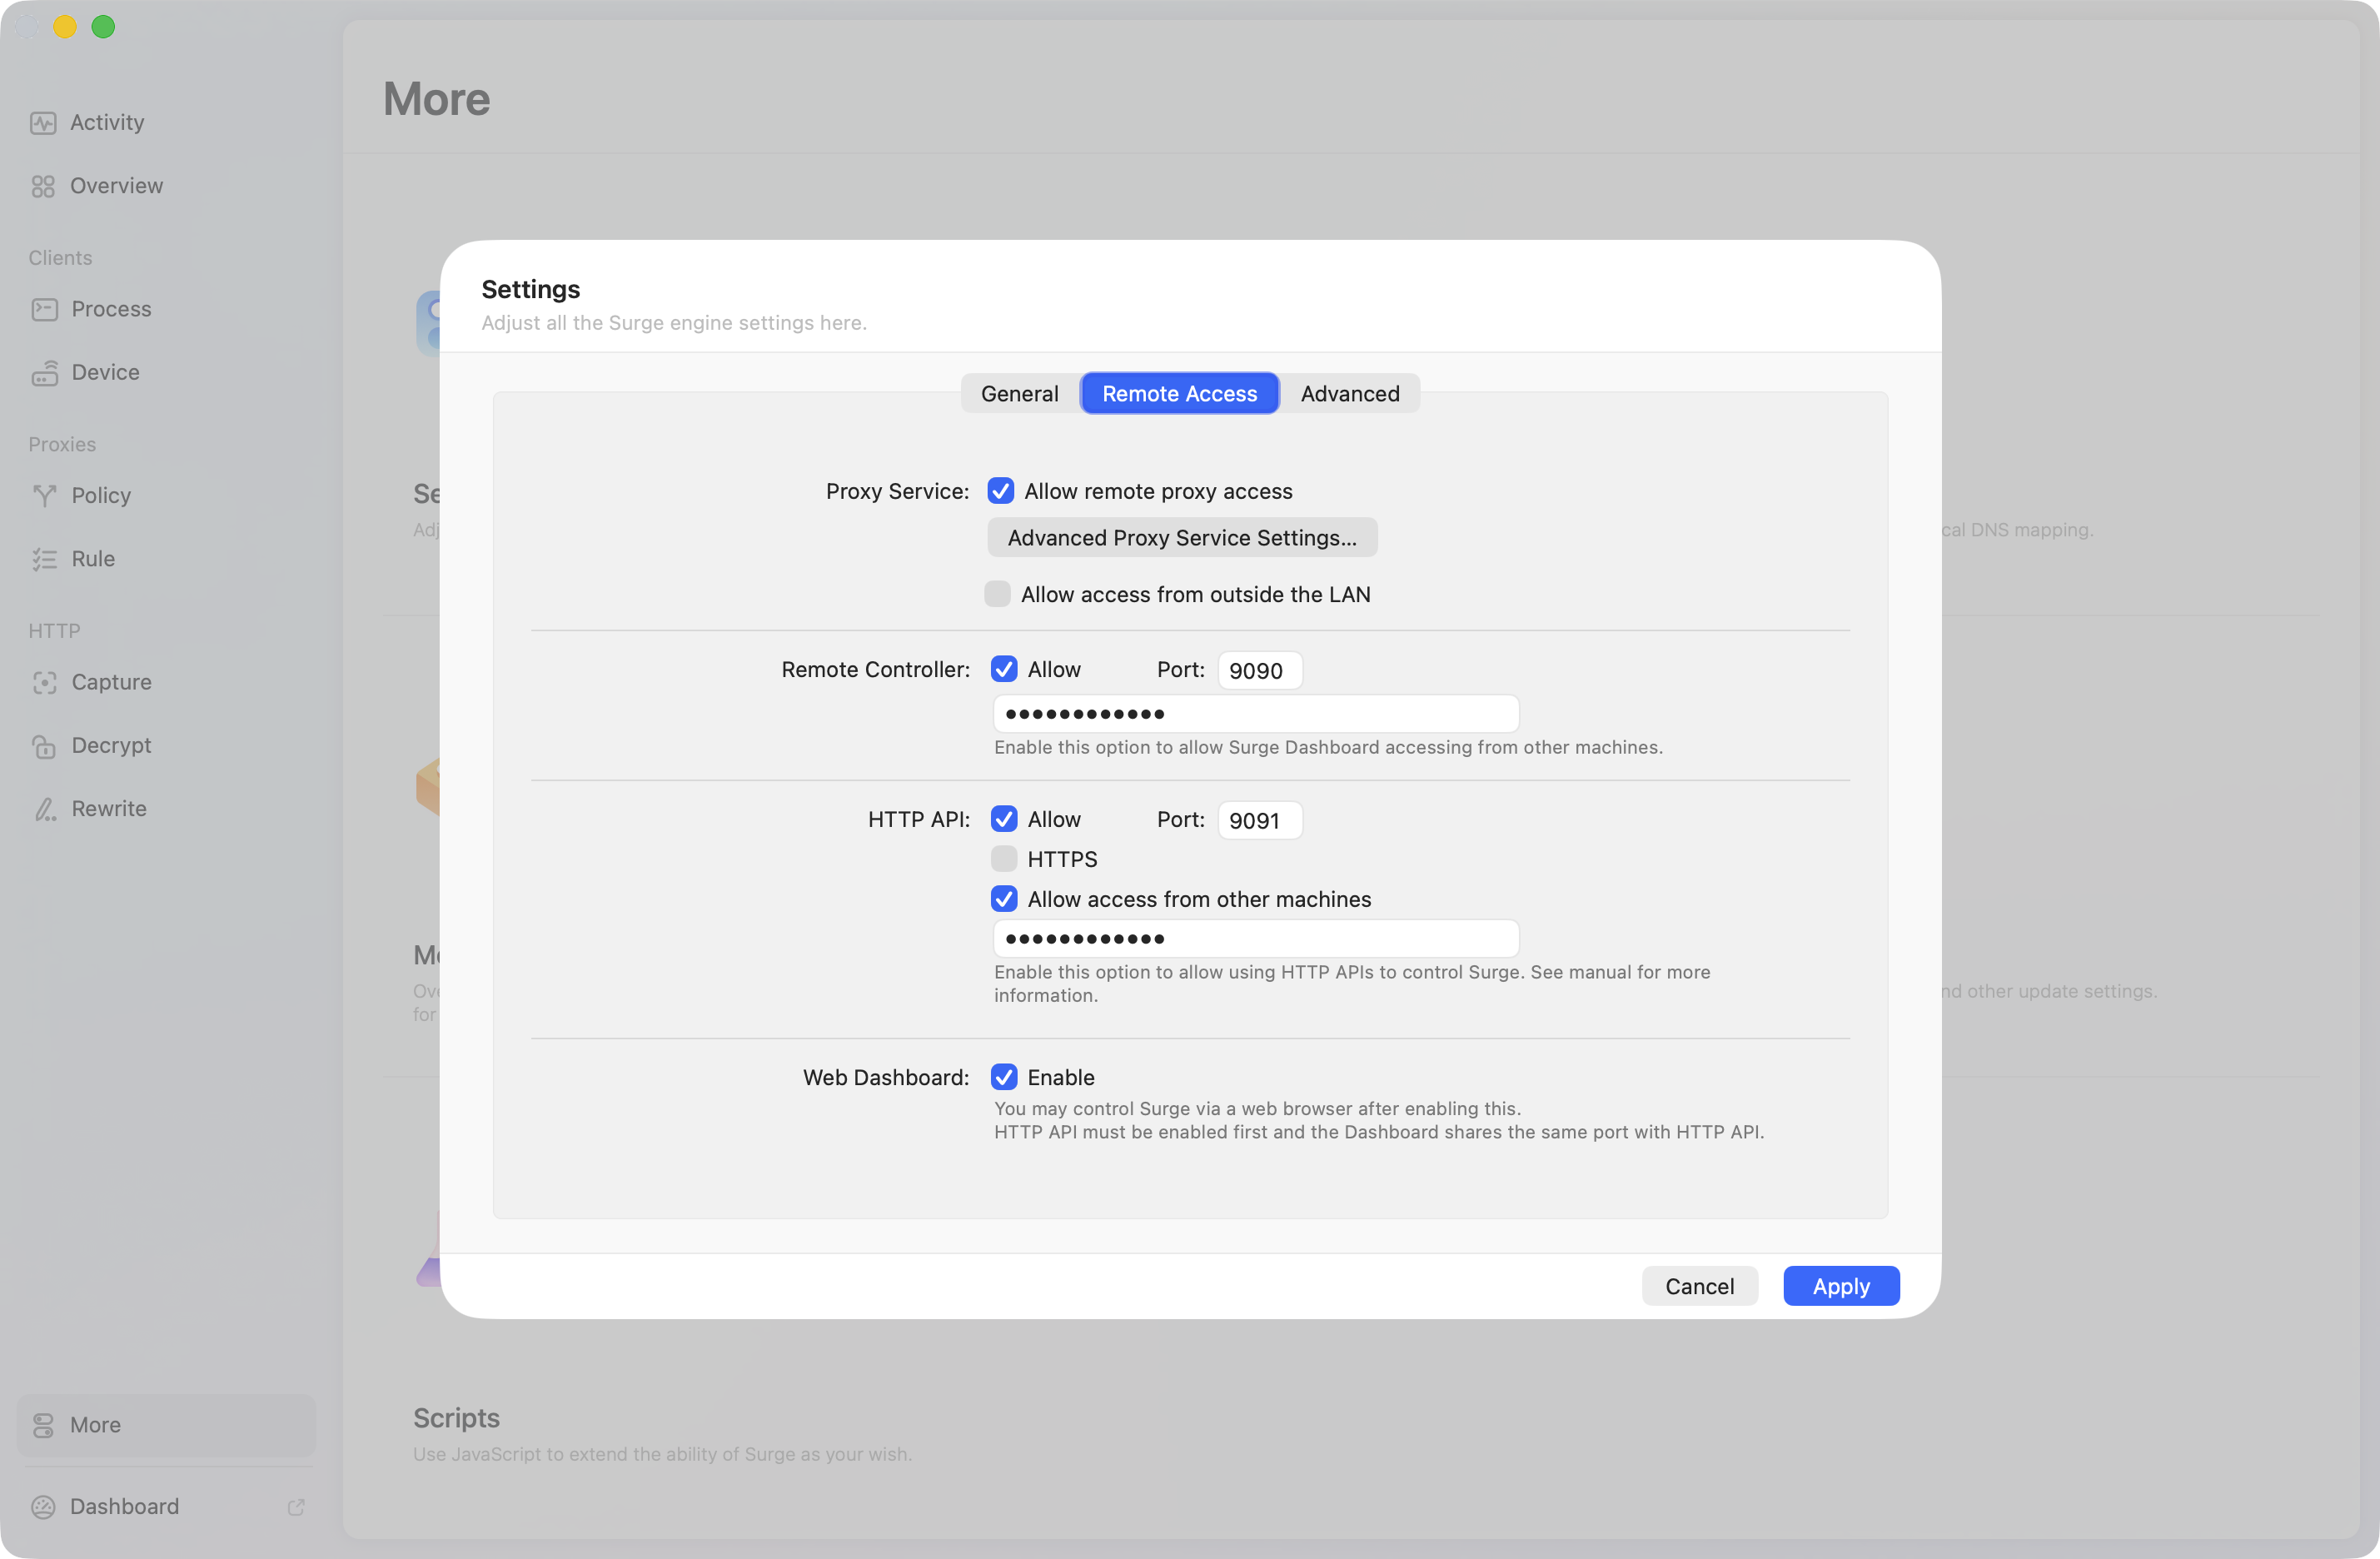
Neko Master supports connecting to Surge gateways for complete rule chain visualization and traffic analysis.
1. Enable Surge HTTP API
Enable HTTP remote API in your Surge configuration:
[General]
http-api = 127.0.0.1:9091
http-api-tls = false
http-api-web-dashboard = true
Or configure via Surge's graphical interface:
- HTTP Remote API:
Settings → General → HTTP Remote API
- Port: Default
9091
- Authentication: Recommended to set a password for enhanced security
2. Add Surge Backend in Neko Master
- Open Neko Master settings dialog
- Click "Add Backend"
- Fill in the connection info:
- Name: Custom name (e.g., "Surge Home")
- Type: Select
Surge
- Host: IP address where Surge is running (e.g.,
192.168.1.1 or 127.0.0.1)
- Port: HTTP API port (default
9091)
- Token: HTTP API password (if configured)
- Click "Test Connection" to verify the configuration
- Save the configuration
💡 Note: Surge uses HTTP polling to fetch data (compared to Clash's WebSocket real-time stream), with a data refresh delay of approximately 2 seconds.
🔧 Port Conflict Resolution
If you see "port already in use" error, here are the solutions:
Solution 1: Use .env File
Create a .env file in the same directory as docker-compose.yml:
WEB_EXTERNAL_PORT=8080    # Change Web UI port
API_EXTERNAL_PORT=8081    # Change API port
WS_EXTERNAL_PORT=8082     # Change WebSocket external port (only for direct access)
COOKIE_SECRET=your-long-random-secret   # Strongly recommended to keep fixed
Then restart:
docker compose down
docker compose up -d
Now access http://localhost:8080
Solution 2: Directly Modify docker-compose.yml
ports:
  - "8080:3000" # External 8080 → Internal 3000
  - "8082:3002" # External 8082 → Internal 3002 (for proxy/tunnel WS forwarding)
Note: if you use direct WS access (no reverse proxy) and external WS port is not 3002, set WS_EXTERNAL_PORT=<external-ws-port>.
Solution 3: Use One-Click Script
curl -fsSL https://raw.githubusercontent.com/foru17/neko-master/main/setup.sh | bash
The script will automatically detect and suggest available ports.
🐳 Docker Configuration
Ports
| Port |
Purpose |
External Required |
Description |
| 3000 |
Web UI |
✅ |
Frontend entry point |
| 3001 |
API |
Optional |
Frontend uses same-origin /api by default; usually no public exposure needed (default Compose maps it) |
| 3002 |
WebSocket |
Optional |
Real-time push endpoint; recommended for reverse proxy/tunnel forwarding only (default Compose maps it) |
Environment Variables (Deployment)
| Variable |
Default |
Purpose |
When to set |
WEB_PORT |
3000 |
Web listen port (inside container) |
Usually unchanged |
API_PORT |
3001 |
API listen port (inside container) |
Usually unchanged |
COLLECTOR_WS_PORT |
3002 |
WS listen port (inside container) |
Usually unchanged |
DB_PATH |
/app/data/stats.db |
SQLite data path |
Custom data path |
WEB_EXTERNAL_PORT |
3000 |
External web port mapping in docker-compose.yml |
External web port changed |
API_EXTERNAL_PORT |
3001 |
External API port mapping in docker-compose.yml |
Direct external API access needed |
WS_EXTERNAL_PORT |
3002 |
External WS port mapping in docker-compose.yml; also used for direct WS port inference |
Direct WS access without proxy and external WS port changed |
NEXT_PUBLIC_API_URL |
empty |
Override frontend API base URL (e.g. https://api.example.com) |
API is not same-origin /api |
NEXT_PUBLIC_WS_URL |
empty |
Override frontend WS URL (absolute URL or /custom_ws) |
Custom WS path/domain |
NEXT_PUBLIC_WS_PORT |
3002 |
WS direct-connection fallback port (build-time only — setting this at Docker runtime has no effect; use WS_EXTERNAL_PORT instead) |
Only for custom source builds |
API_URL |
http://localhost:3001 |
Next.js /api rewrite target (mainly source/custom builds) |
API listen address changed |
COOKIE_SECRET |
auto-generated |
Cookie signing secret; if not fixed, sessions can be invalidated after restart when data dir is not persisted |
Strongly recommended in production |
GEOIP_LOOKUP_PROVIDER |
online |
IP geolocation source (online / local) |
Default to local MMDB lookup |
GEOIP_ONLINE_API_URL |
https://api.ipinfo.es/ipinfo |
Online IP geolocation API endpoint (must be compatible with ipinfo.my response schema) |
Set only when you deploy a compatible endpoint |
FORCE_ACCESS_CONTROL_OFF |
false |
Force disable access control (emergency recovery) |
Temporary use only when token is lost |
SHOWCASE_SITE_MODE |
false |
Read-only showcase mode (blocks sensitive write operations) |
Public demo sites only |
Advanced Tuning Variables (Optional)
| Variable |
Default |
Description |
FLUSH_INTERVAL_MS |
30000 |
Buffer flush interval for collector writes |
FLUSH_MAX_BUFFER_SIZE |
5000 |
Max buffer entries before early flush |
REALTIME_MAX_MINUTES |
180 |
Realtime in-memory window size (minutes) |
REALTIME_RANGE_END_TOLERANCE_MS |
120000 |
End-time tolerance for range queries |
SURGE_POLICY_SYNC_INTERVAL_MS |
600000 |
Surge policy sync interval |
DB_RANGE_QUERY_CACHE_TTL_MS |
8000 |
Range-query cache TTL |
DB_HISTORICAL_QUERY_CACHE_TTL_MS |
300000 |
Historical-query cache TTL |
DB_RANGE_QUERY_CACHE_MAX_ENTRIES |
1024 |
Max range-query cache entries |
DB_RANGE_QUERY_CACHE_DISABLED |
empty |
Set 1 to disable range-query cache |
DEBUG_SURGE |
false |
Enable Surge collector debug logs (true) |
API / WS Resolution Priority
- API client base:
runtime-config.API_URL → NEXT_PUBLIC_API_URL → same-origin /api
/api server-side rewrite target: API_URL (default http://localhost:3001, applied in Next.js rewrites)- WS URL:
runtime-config.WS_URL → NEXT_PUBLIC_WS_URL → auto candidates (when runtime-config.WS_PORT is set, direct port is preferred; otherwise /_cm_ws is tried first)
- WS port:
runtime-config.WS_PORT (from WS_EXTERNAL_PORT) → NEXT_PUBLIC_WS_PORT → 3002
- In normal deployments,
NEXT_PUBLIC_WS_URL is usually unnecessary unless you use a custom WS path/domain
Production Environment Baseline (Recommended)
NODE_ENV=production
DB_PATH=/app/data/stats.db
COOKIE_SECRET=<at least 32-byte random string>
# Optional: default to local MMDB lookup
# GEOIP_LOOKUP_PROVIDER=local
# Keep false in normal operation
# FORCE_ACCESS_CONTROL_OFF=false
Use openssl rand -hex 32 to generate COOKIE_SECRET.
Additional recommendations:
- Mount persistent storage (for example
./data:/app/data) to avoid data and secret loss.
- If using direct WS access and external WS port is not
3002, set WS_EXTERNAL_PORT accordingly.
- If API port/address changes in source deployment, update
API_URL as well
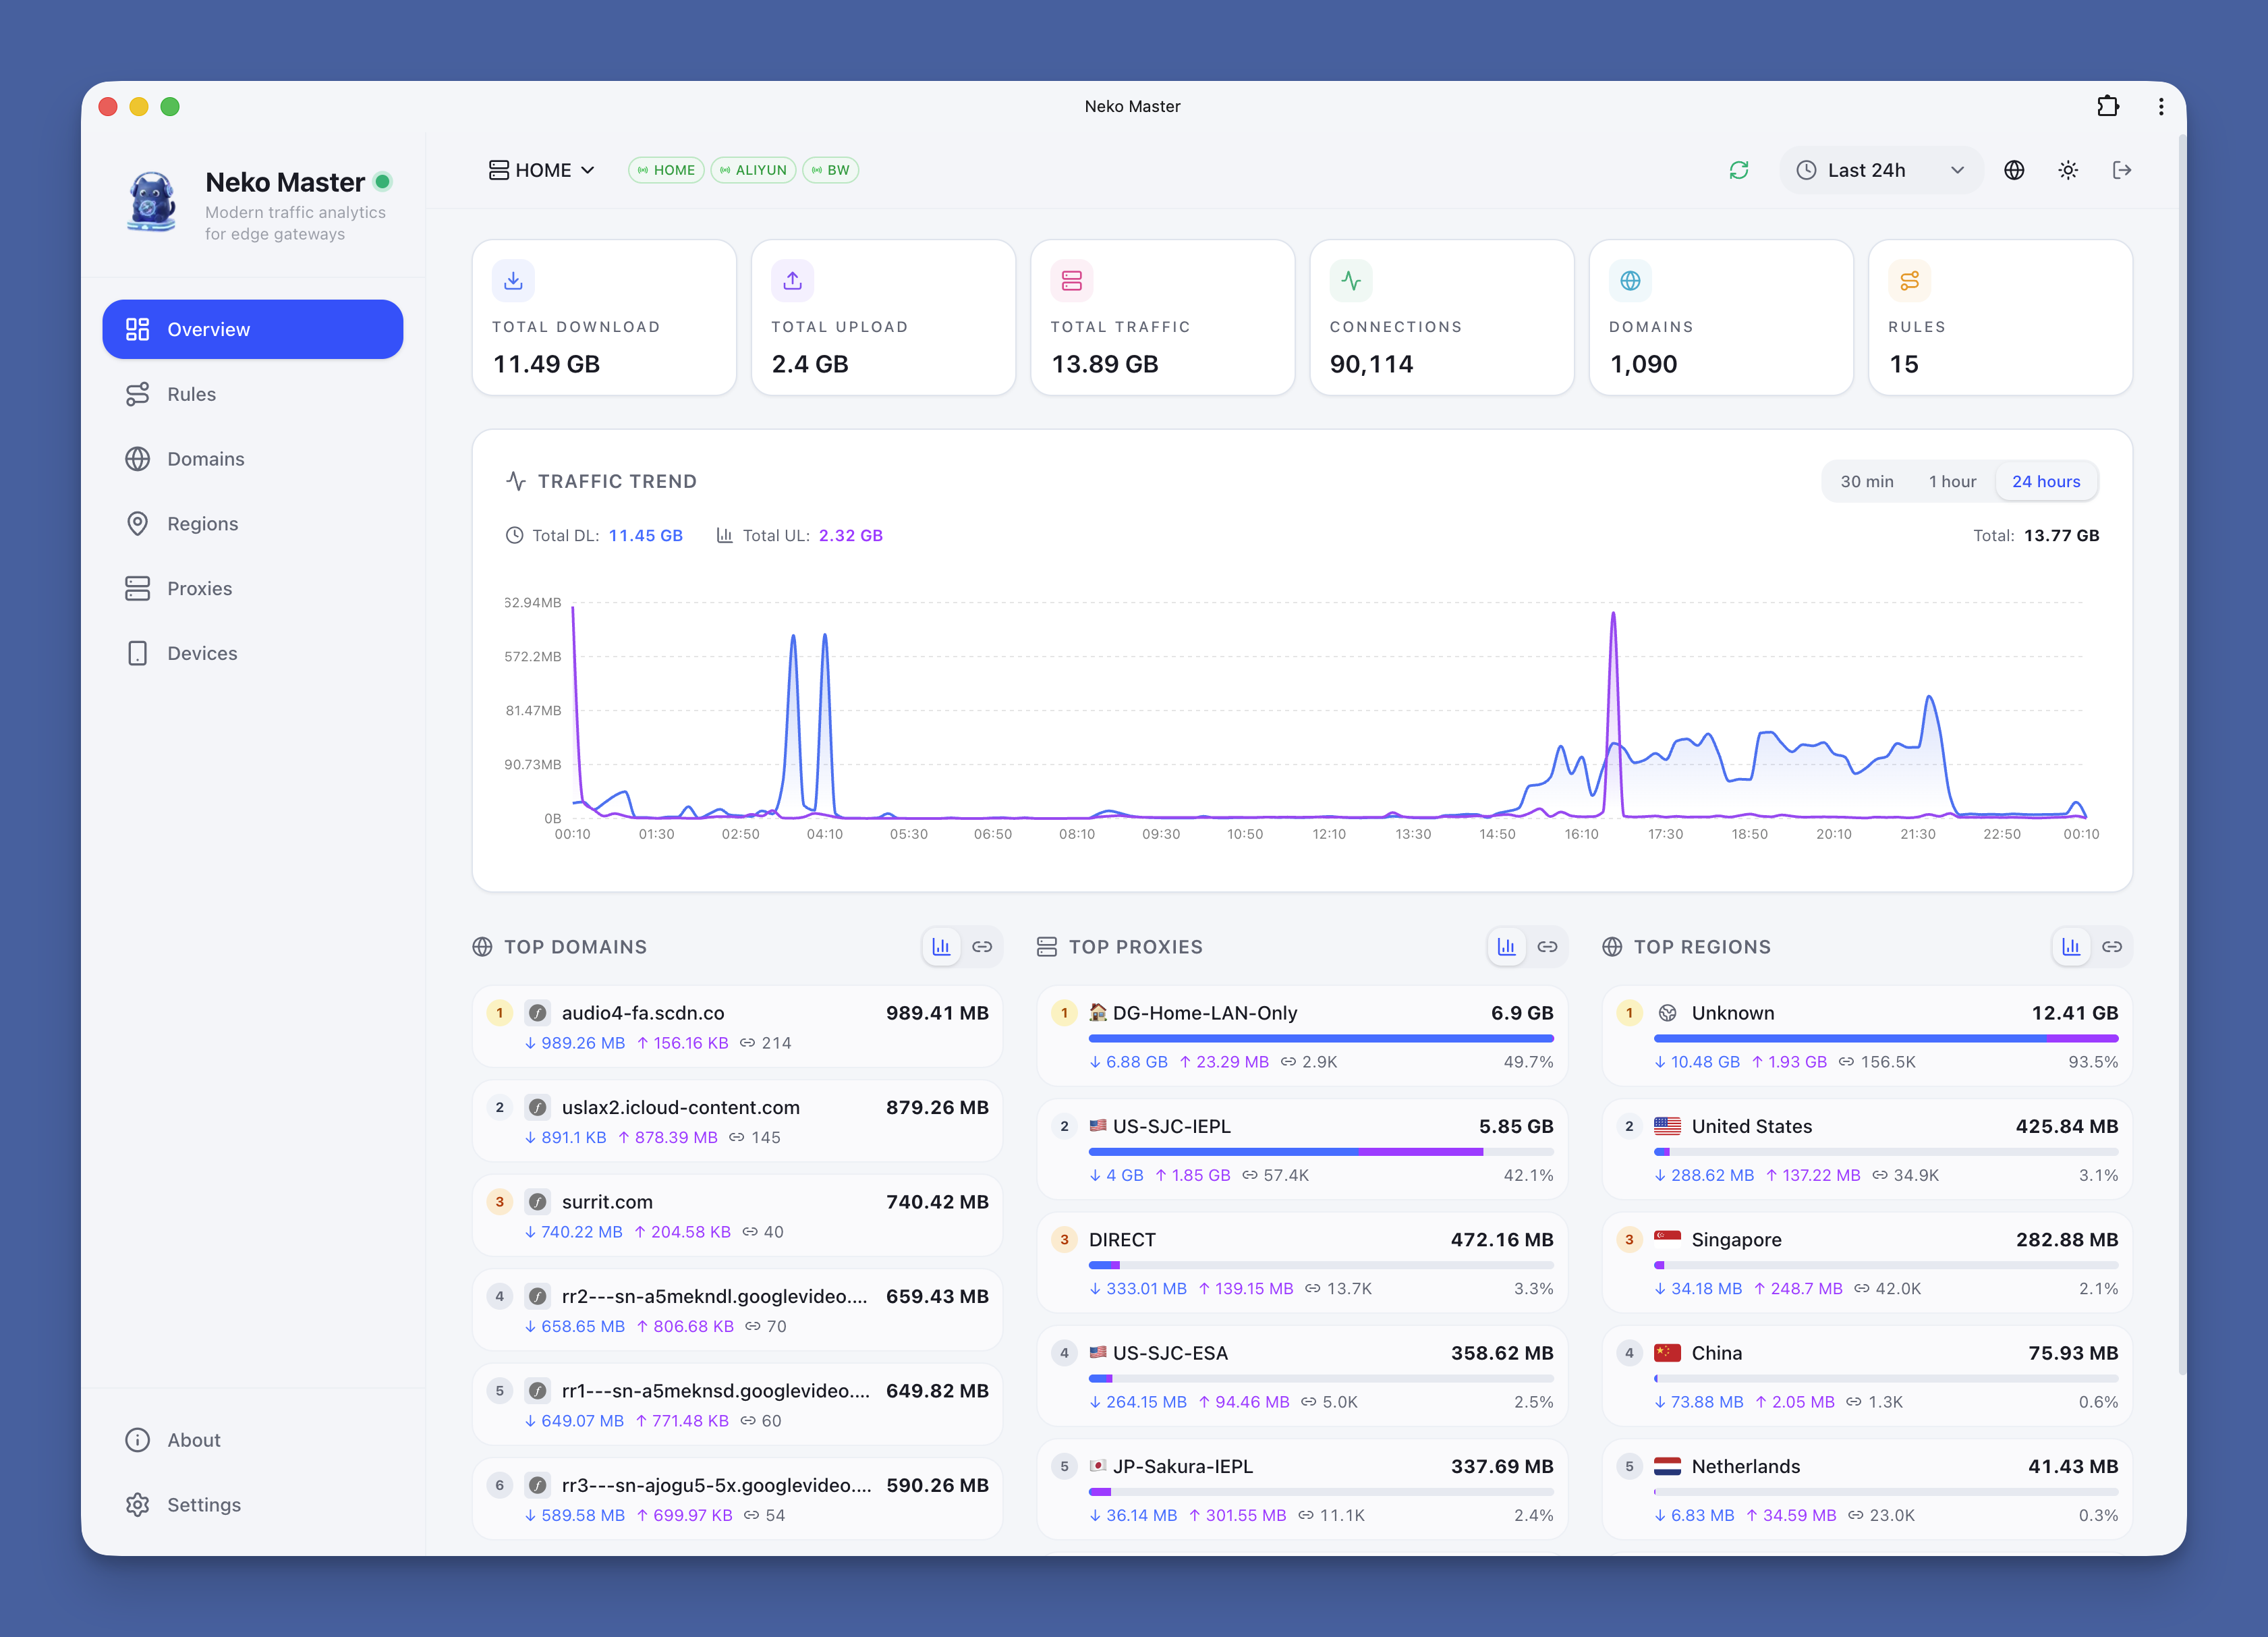
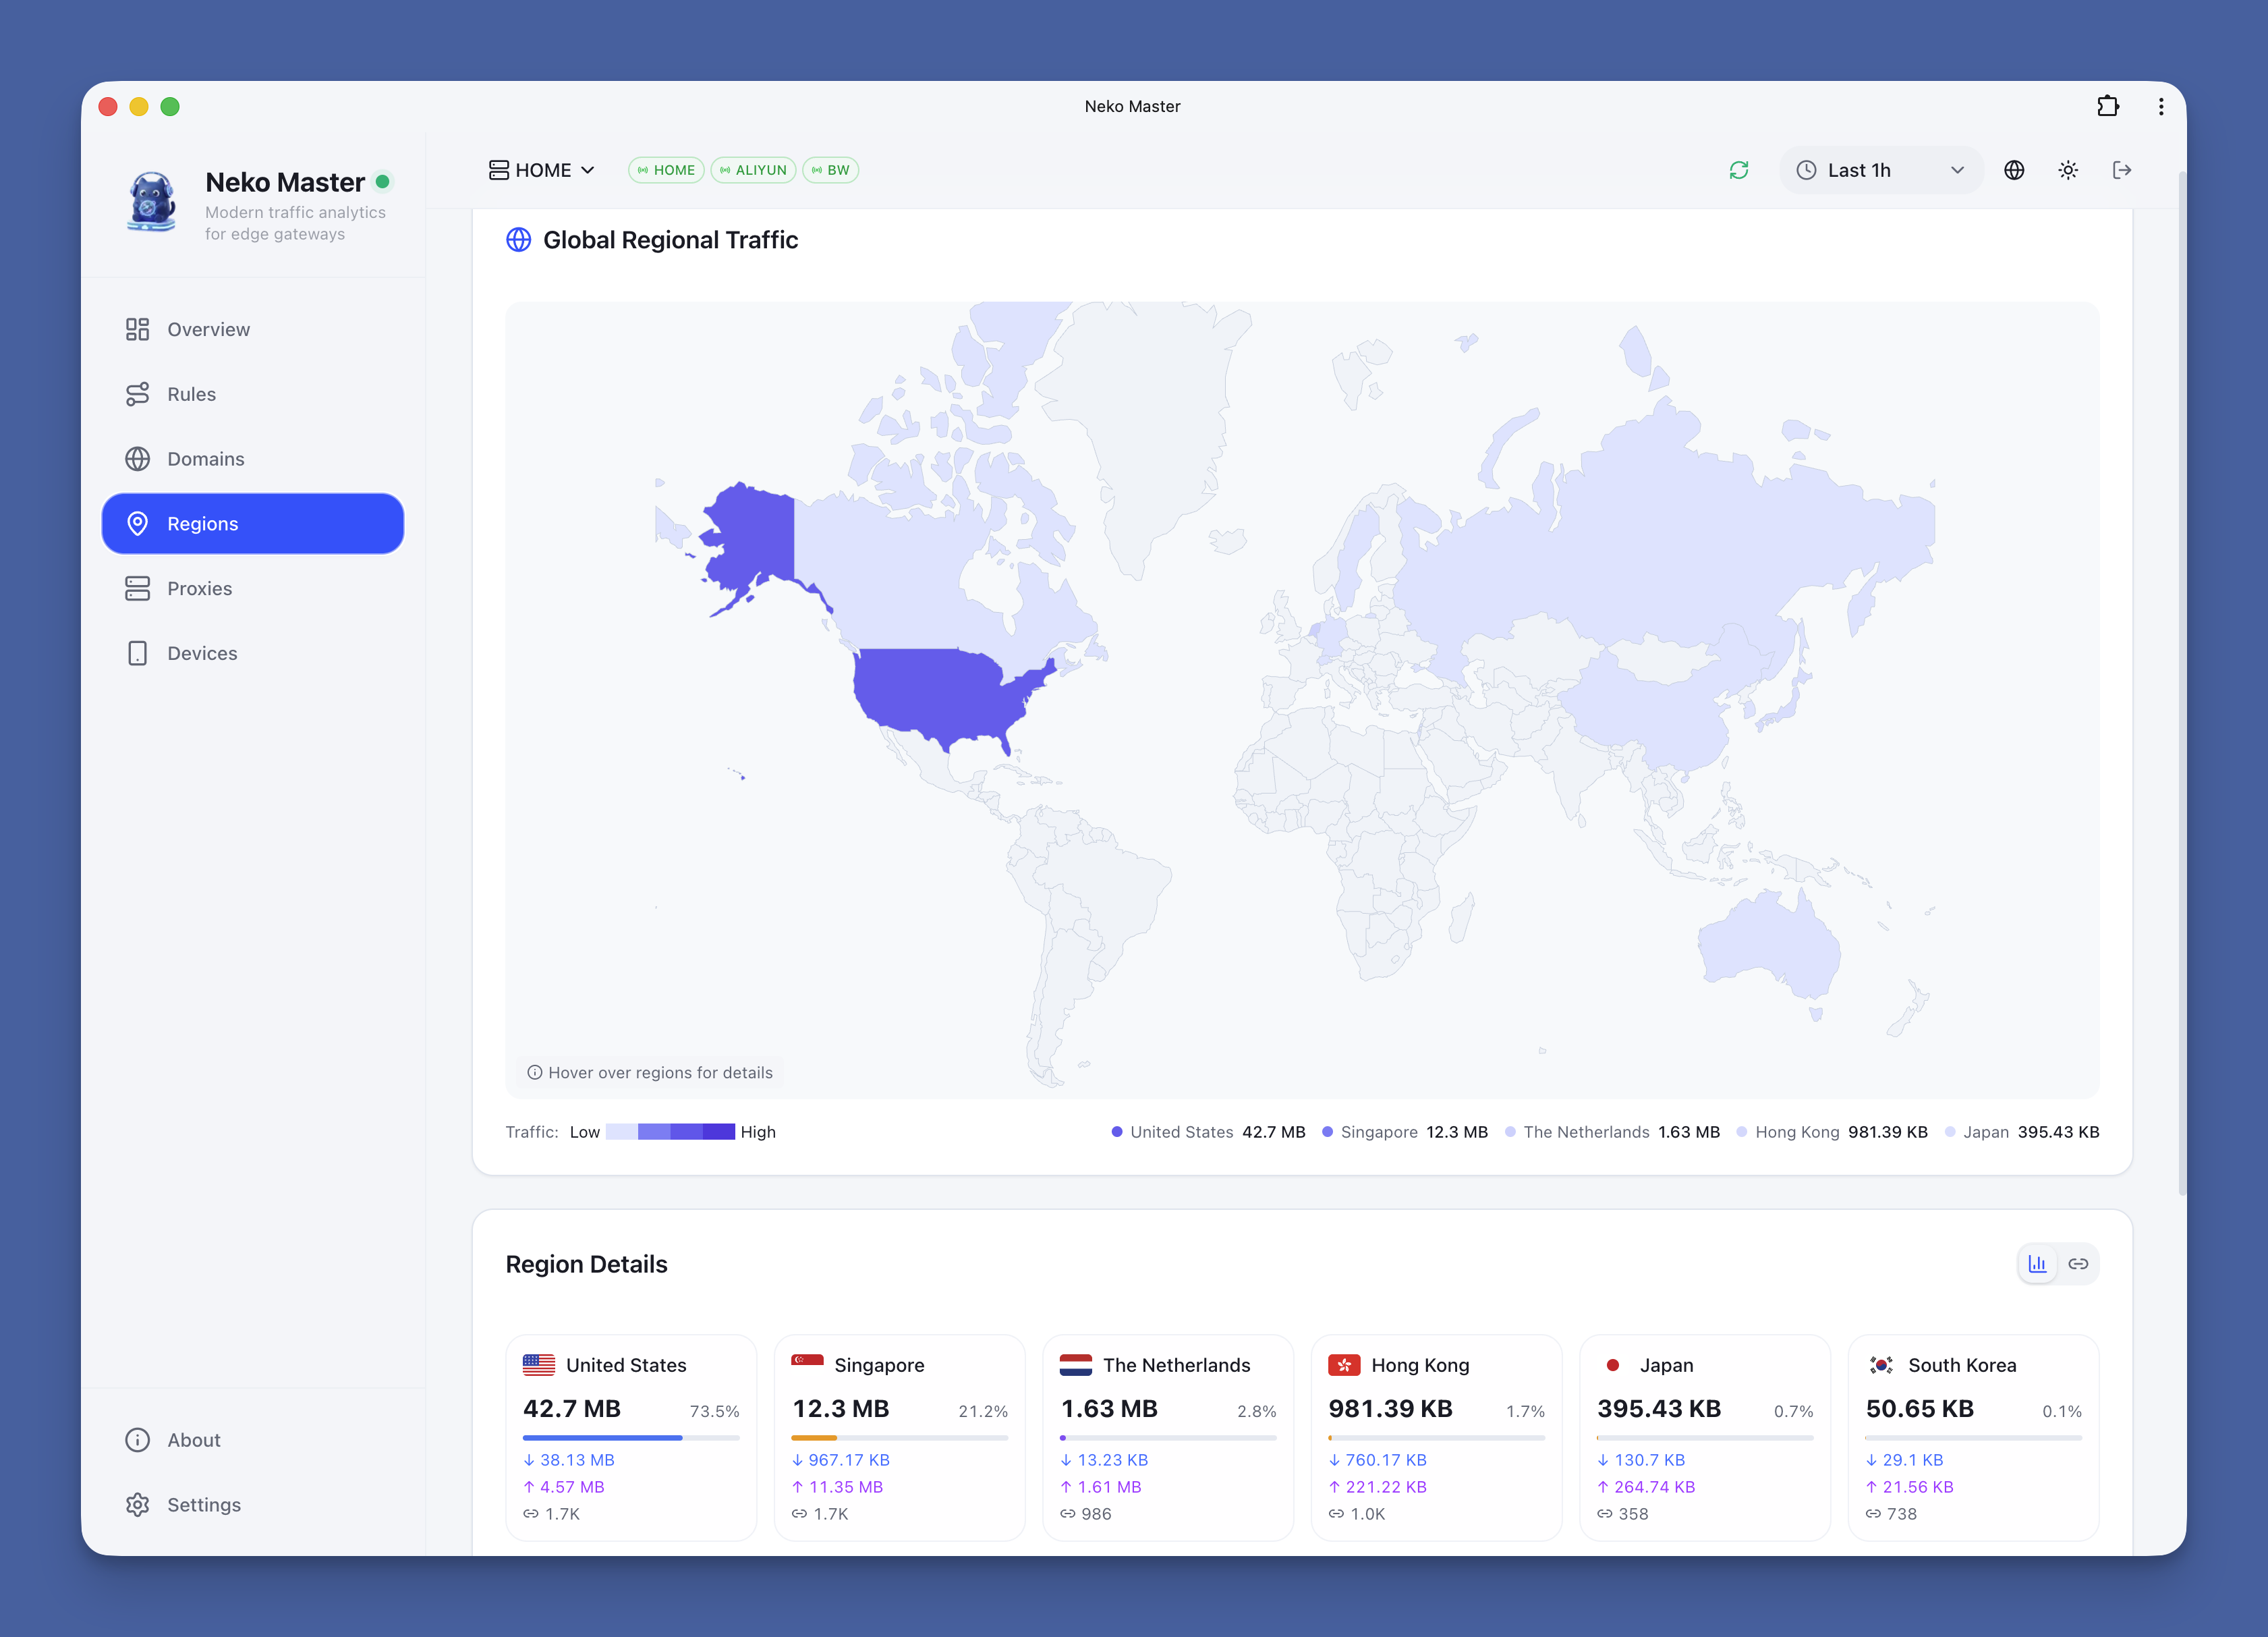
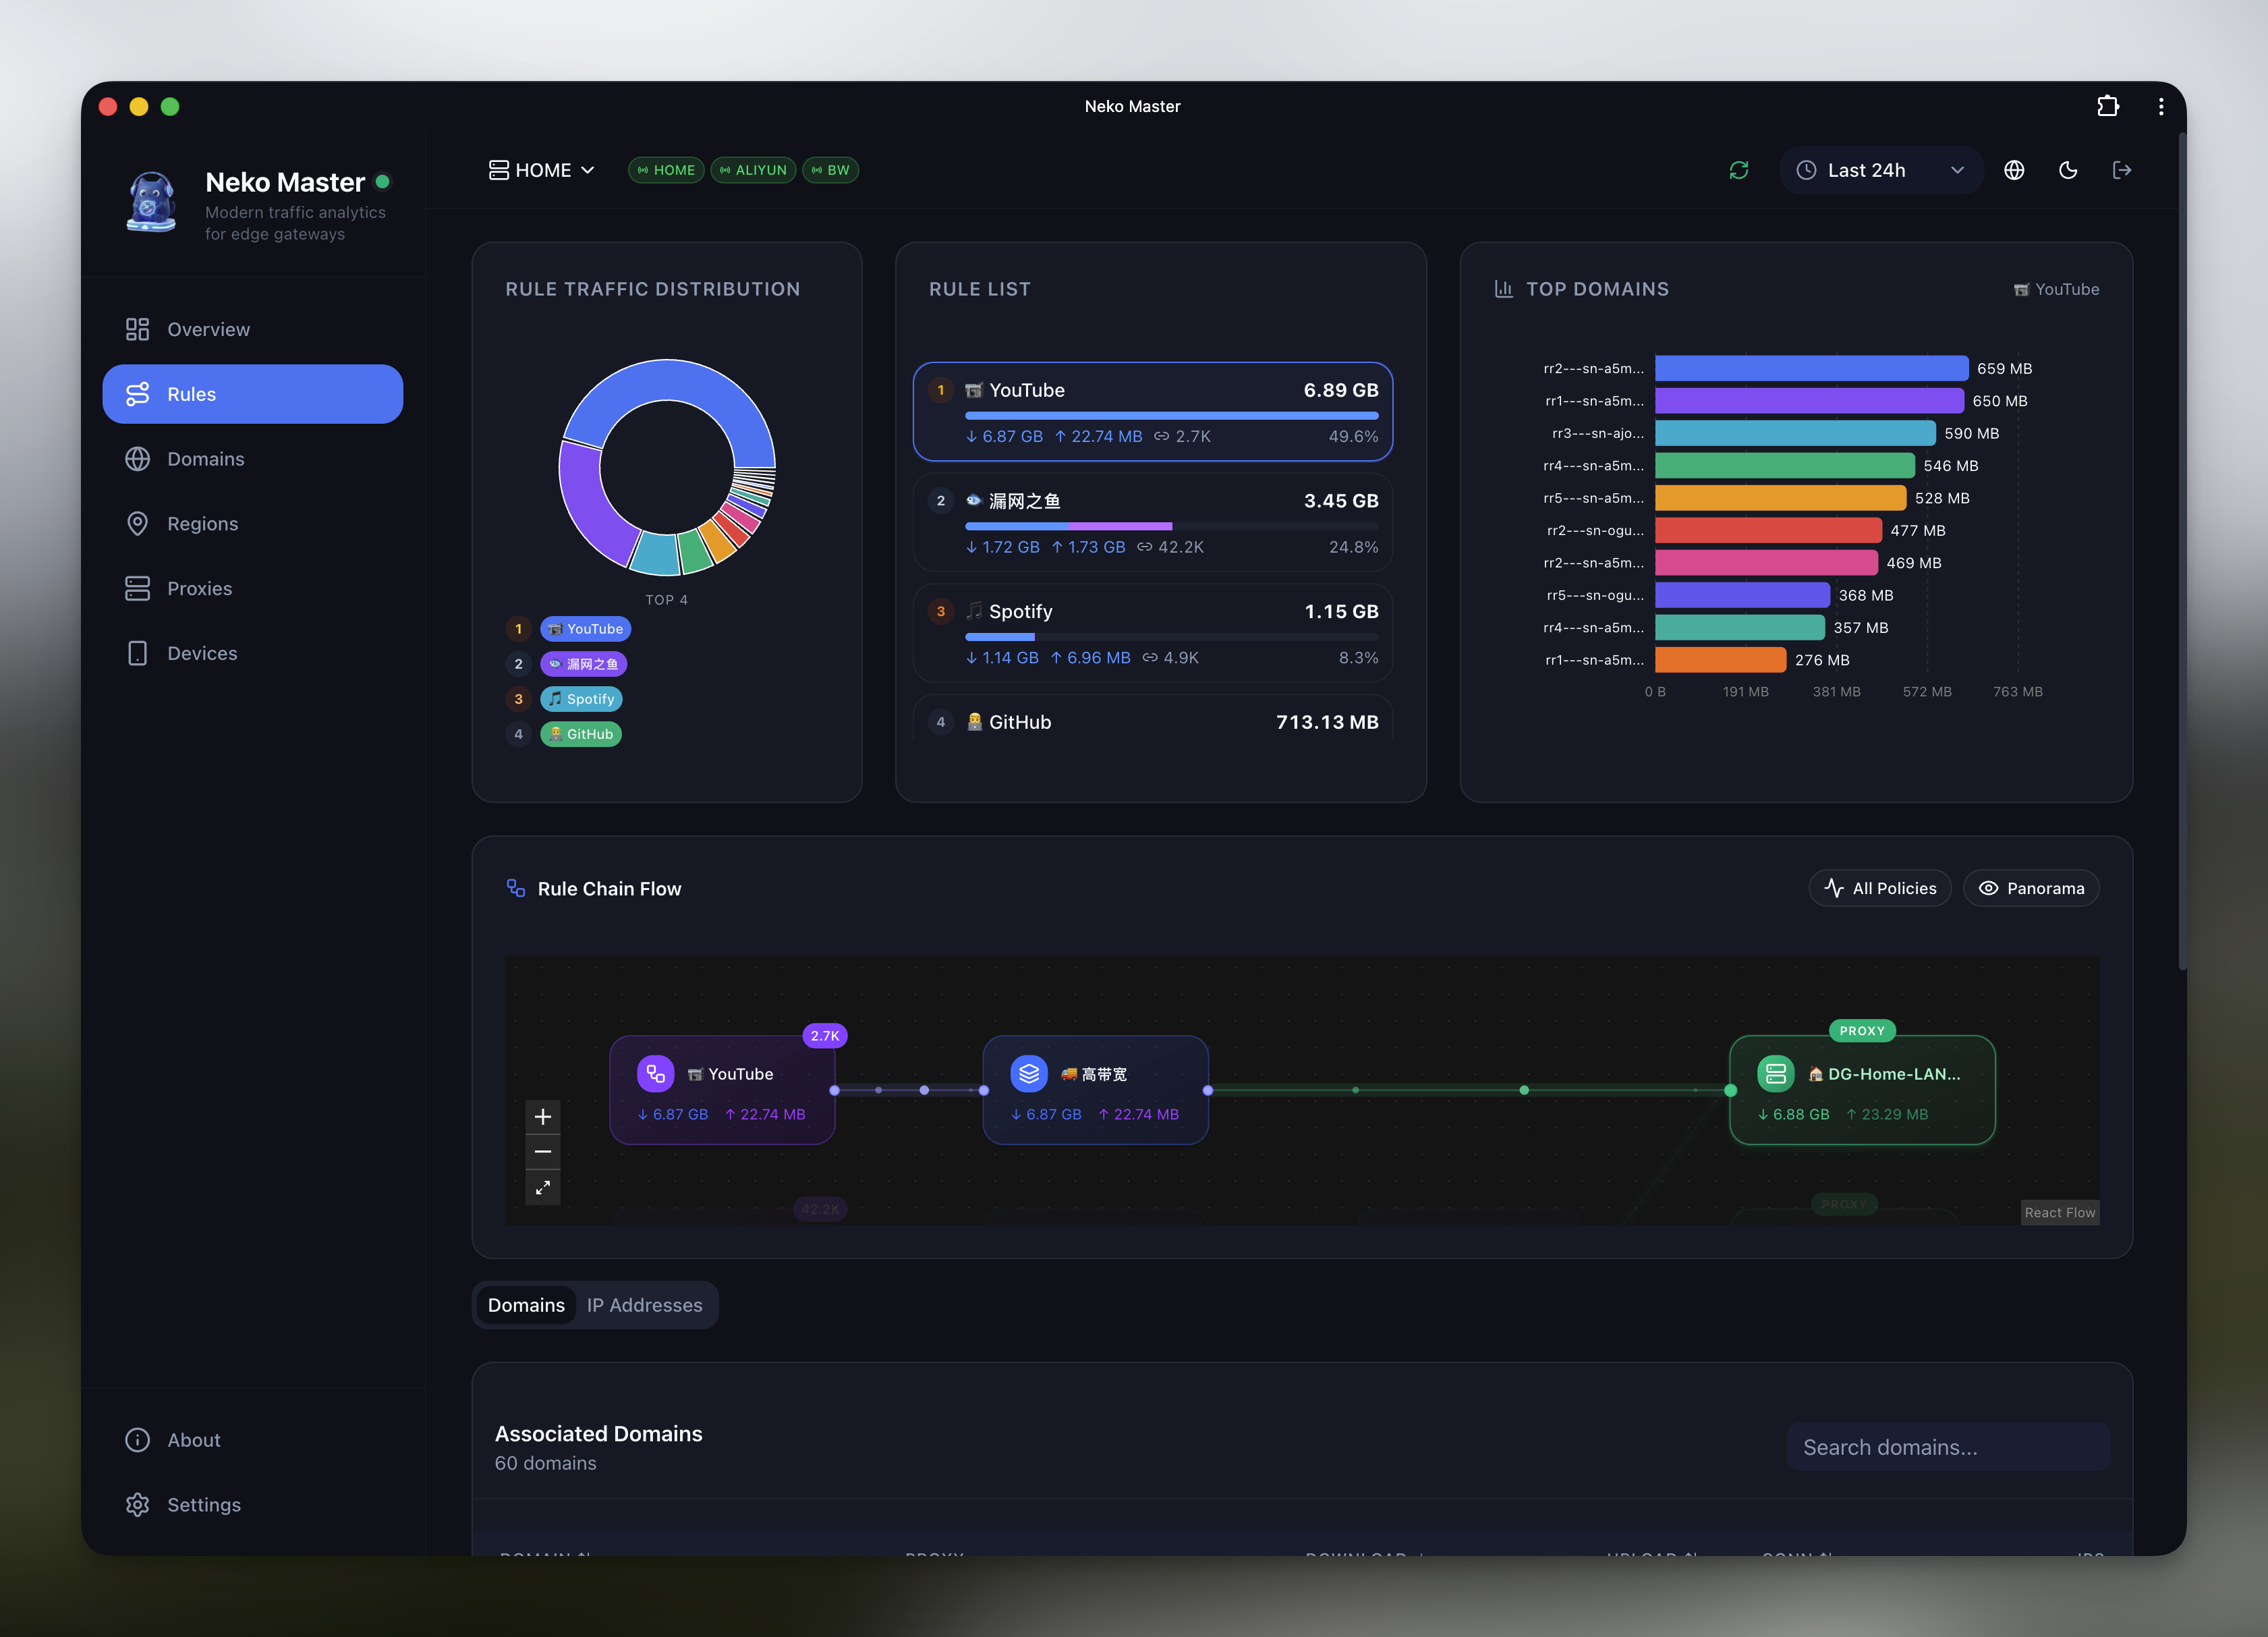
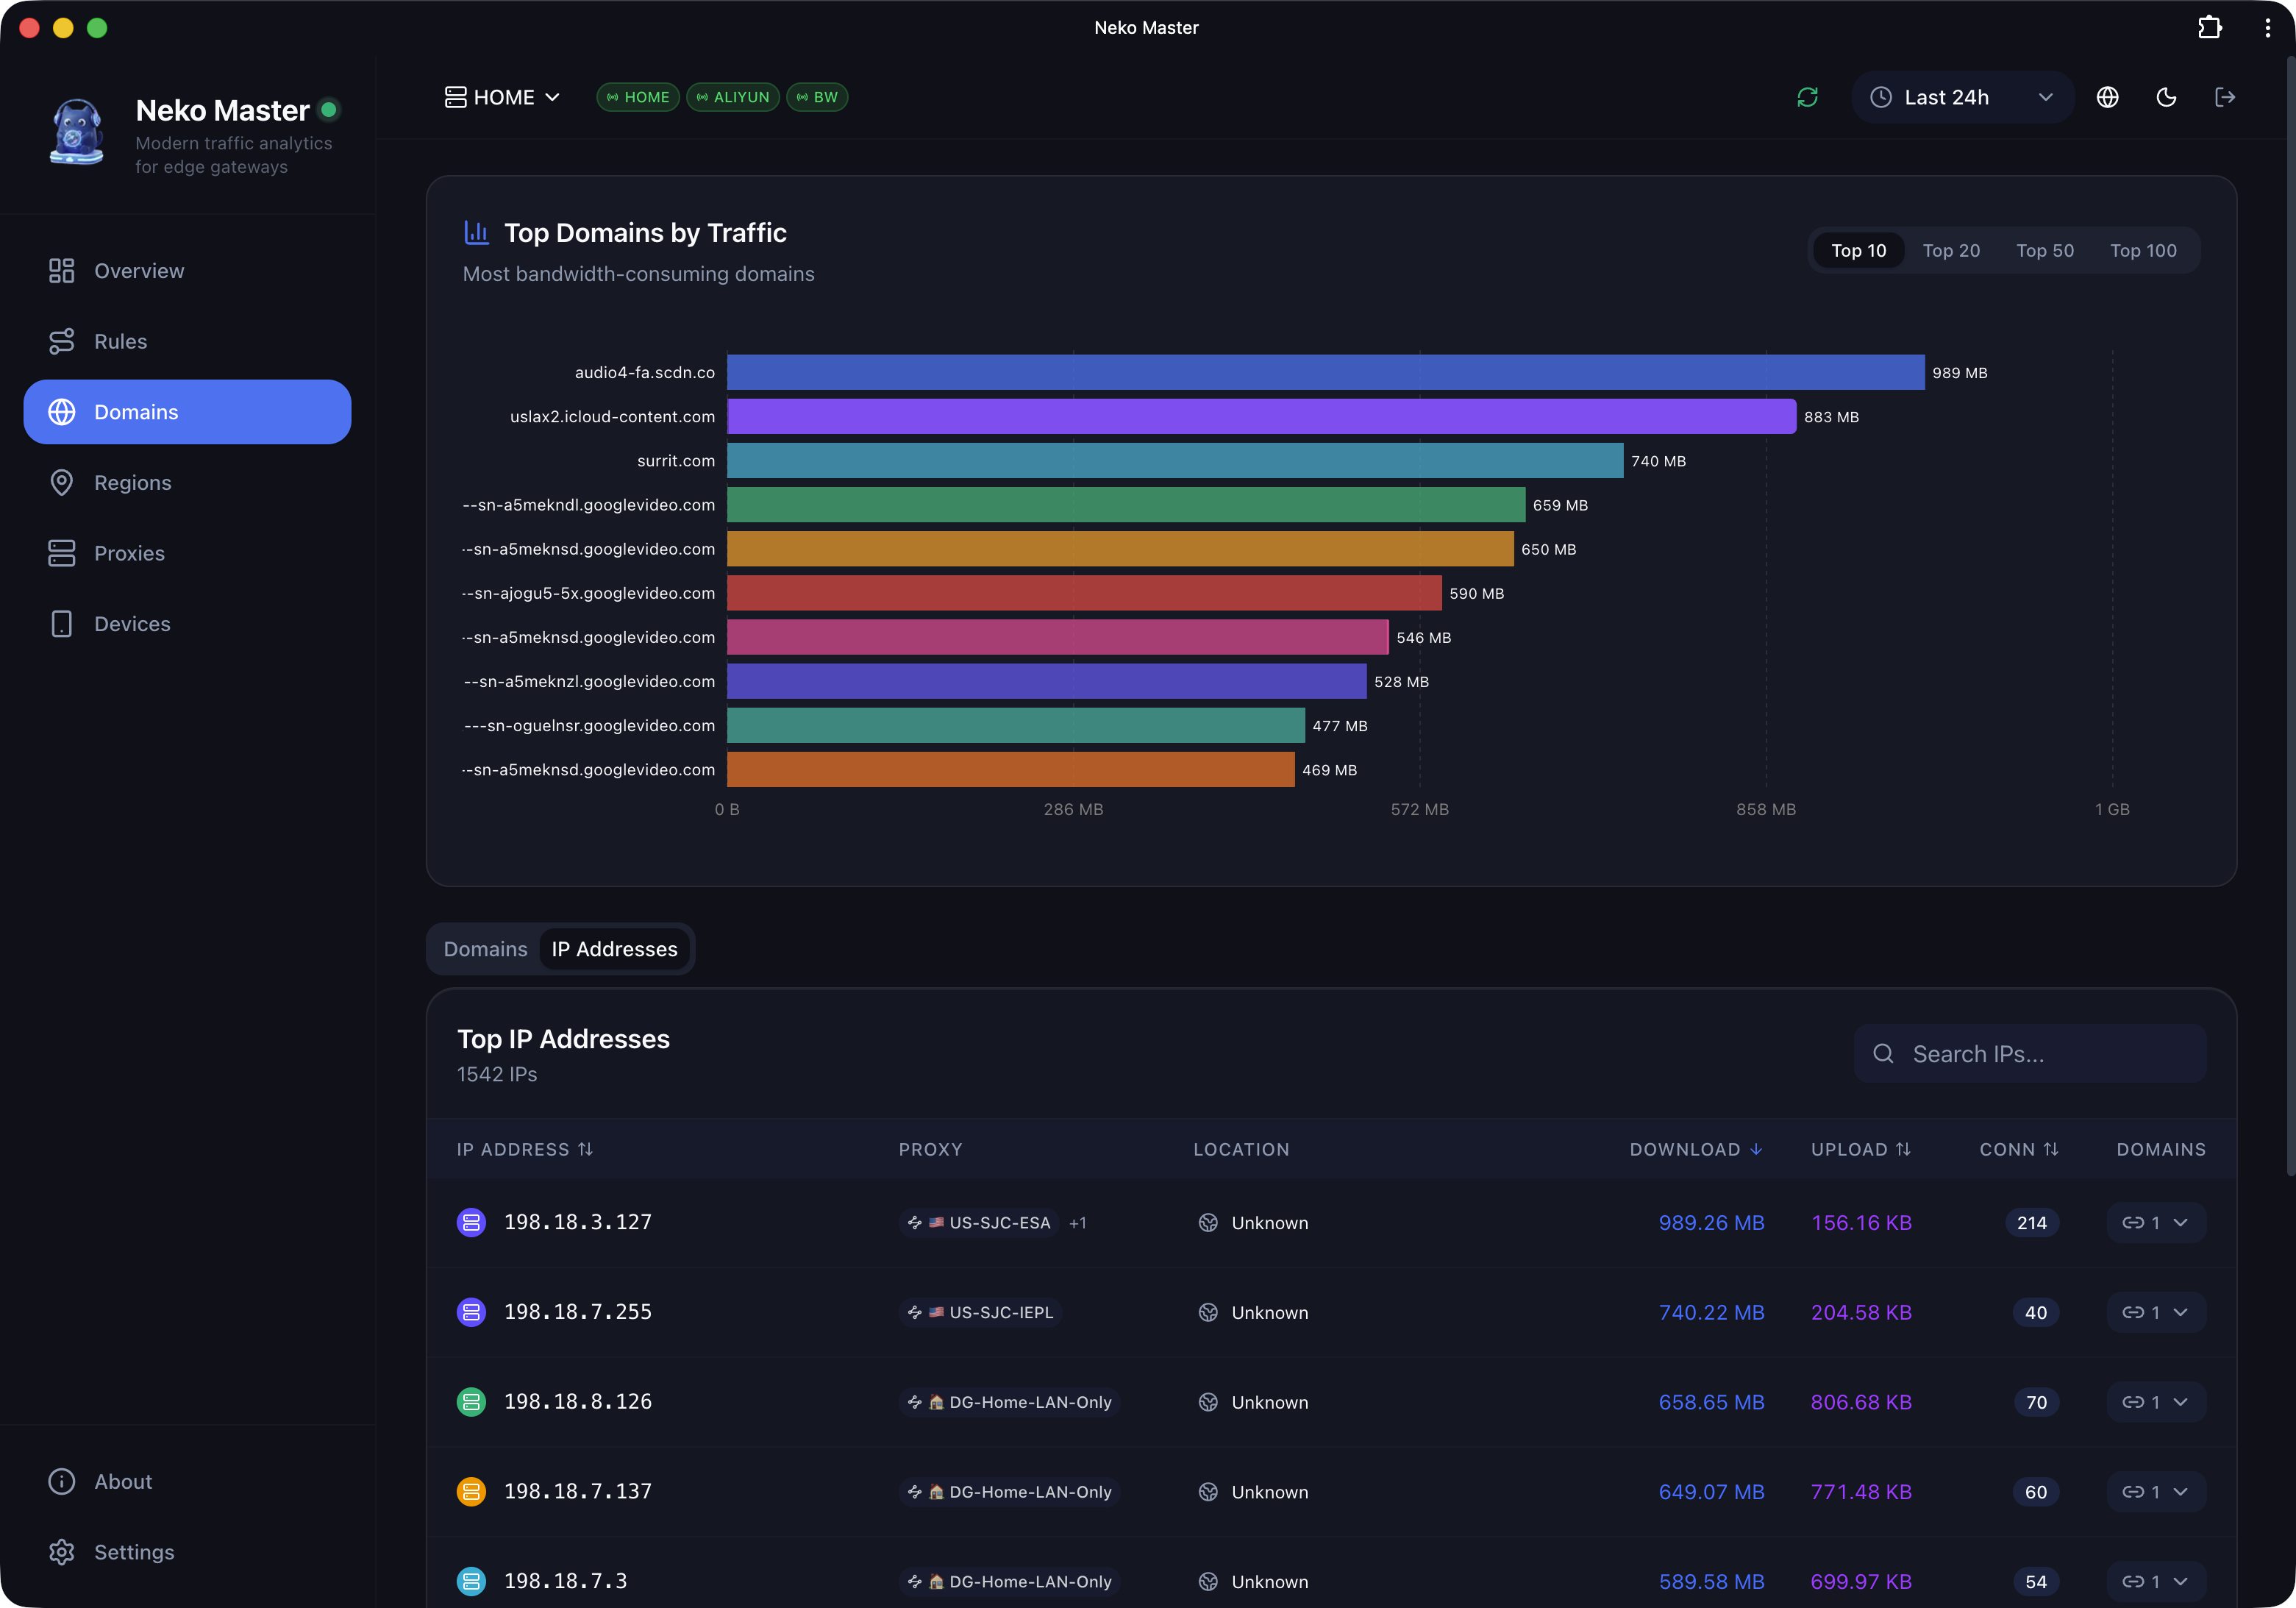

 Neko Master is a self-hosted dashboard that visualizes and analyzes network traffic collected from gateways like Clash, Mihomo, OpenClash and Surge, showing real-time stats, domains, IPs and proxy-node usage.